- The Opening Print
- Posts
- When Shorts Get Trapped: How End-of-Quarter Flows Drove the Close
When Shorts Get Trapped: How End-of-Quarter Flows Drove the Close
Danny Riley
October 01, 2025
Follow @MrTopStep on Twitter and please share if you find our work valuable!
FREE Two-Week Offer for the Opening Print Premium. Open up the Lean and other premium features for the next Two Weeks!
Our View
I'm really sorry about yesterday's OP. I sent it to Laura and Marlin at 11:05 PM Monday night, along with another email that was received, but I lost one of my better OPs in a long time. When we started searching, I knew it had fallen into Gmail hell, and by 7:45 AM there was no way for me to pull it back together. I got so aggravated I told Marlin I was tired of writing and needed a “template”, and he promptly said he could make one.
Look, I'm old school. My typing sucks, and I hate AI talk-and-type because it takes out the human side of the message. So here I sit.
What did the ES do? It sold off on Globex down to 6694.25, traded 6708.25 on the 9:30 regular session open, chipped a bit, and then sold off down to 6693.75 at 10:36. It rallied up to 6713.75 at 11:00, sold off to a new low at 6693.00, then rallied up to 6718.88 at 12:21. From there, it sold off down to a higher low at 6694.25 at 1:24, then traded up to 6743.50 as the 3:50 imbalance showed $4.8 billion to buy, dropped to 6732.00, traded 6737.25 on the 4:00 cash close, and settled at 6738.75, up 25.75 points or +0.38% on the 5:00 futures close.
After the drop (there were many), the ES made a few higher lows and started to catch a bid. I'll be honest—my trading has sucked, but I think my directional calls are OK. The problem is I don’t follow what I write. I get so caught up that I start spinning when I should just be patient and wait for the larger drops or pullbacks. They say patience is a virtue—well, that’s something I don’t always have.
We all knew a couple of things going into yesterday's session:
The selling dried up last Thursday
Everyone got short, which is a big problem for the end-of-quarter rebalance because they sold early and bought late.
If you look at the 3-minute ES charts, there were tons of rallies and drops. To explain why, I posted this on Twitter:
There are hundreds of pension funds, mutual funds, and large institutional accounts, not just from the US but from around the world, and they all have rebalancing to do. That means they’re all going at the same time, but not all the order flow is the same, like yesterday, when the NQ was going up and the ES was higher but not really going for the ride, and then sold off. I'm not sure that fully describes how it works, but sometimes you’ll see spurts of buying and selling at the same time. After 3:00, we should see rebalancing get a little more aggressive, with the last 30–40 minutes of the day being the busiest portion of the trade. It’s also Week 4 options expiration, so we’ve got two candy stores in play at the same time. Write down the NYSE and ES volumes at 3:45, and then look at them at 4:01. NYSE volume will almost double.
I'm not bragging, but why do you think the PitBull used my desk? I know why—he got screwed when he didn’t, and he loved my feel for the SPU, especially when it was busy. Below are some late-day posts from my chat. I’m not kidding—please pull up your charts and check the times.
IMPRO : Dboy Chat Highlights
(10:16:58 AM): I think this stuff is in a big back and fill again and we are going to pop at some point today
(2:55:28 PM): hour of power
(3:09:31 PM): gonna trade 6734
(3:22:10 PM): this is all standard price action for what’s going down the pipe
(3:22:52 PM): sellem early in the week and then jam the money in
(3:45:31 PM): can't rule out a NHOTC (new highs on the close)
(3:45:58 PM): offering 2 es at 38.00
(3:46:05 PM): 4:00 rush
(3:46:23 PM): boom boom out go the lights for the sellers
(3:46:28 PM): seen this before
(3:46:51 PM): and 2 at 42
(3:47:16 PM): they didn’t spend all the $$$$$$$ to puke it
(3:47:26 PM): MIM big size to buy
(3:47:40 PM): that’s what this is saying
(3:48:22 PM): if they do smoke they will smoke again into 4:00
In the end, there was a very high level of up-and-down false starts until late in the day when the buy programs started to hit. In terms of the ES's overall tone, it was a buy-the-dips day, despite the high odds of a government shutdown. In terms of the ES's overall trade, volume was on the higher side at 1.52 million contracts traded.
On Tap
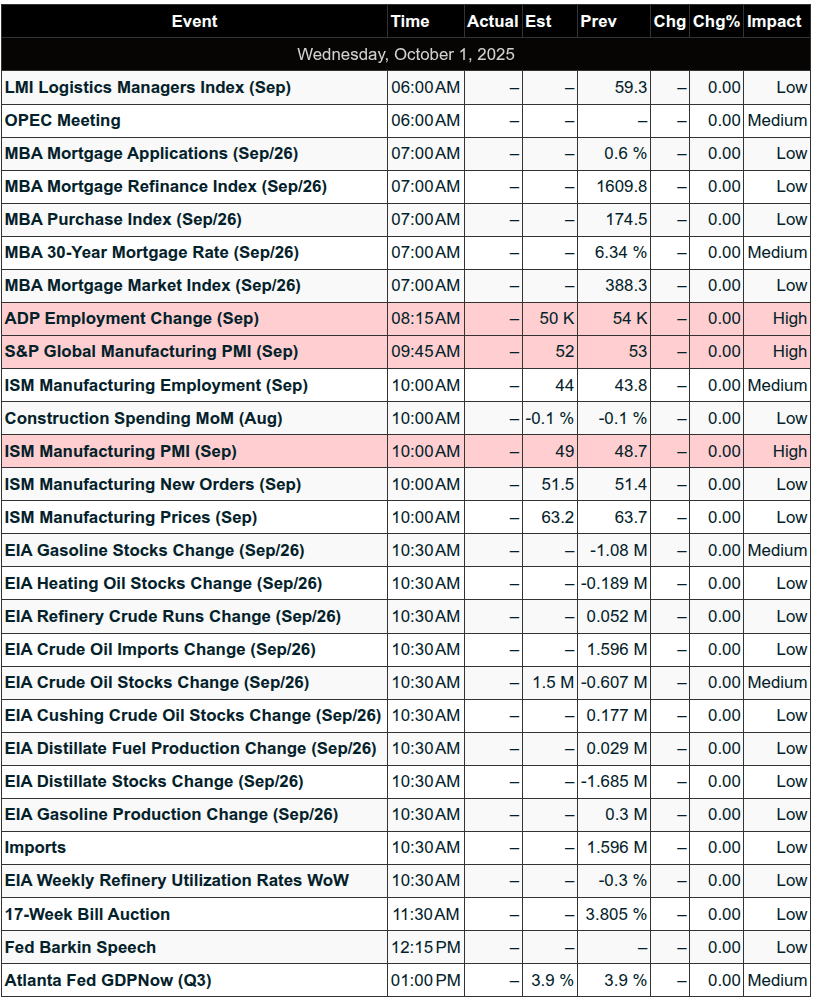
8:15 – ADP
9:45 – S&P Final U.S. Manufacturing PMI
10:00 – ISM, Construction Spending, and Auto Sales
Our View
The Federal budget shutdown started at 12:01 a.m. Futures were already offered, and the ES sold off down to 6680.00 going into 2:00 AM, then traded back up to 6705.50. The NQ traded down to 24,633.25 at the same time and bounced up to the 24,768 level.
Plain and simple: the federal government ran out of money after a Democratic-backed spending bill that would have extended health care subsidies under the Affordable Care Act and reversed cuts to Medicaid failed. The GOP-backed stopgap funding measure, which would have funded the government for seven weeks, also failed.
In the 20 previous times this has happened, the size of the sell-off is generally dictated by the length of time the shutdown continues—and the stock market always rallies after the shutdown is resolved. So… now it’s a waiting game.
Our Lean — Danny’s Trade (Premium only)

Guest Posts — Polaris Trading Group

S&P 500 (ES)
Prior Session was Cycle Day 2: This session was a textbook example of consolidation throughout the majority of the session, finding responsive buyers at the CD1 Low 6696 level, then staging an end of month “window dressing” rally fulfilling the 6743 Cycle Day 2 target.
For greater detail of how this day unfolded, click on the Trading Room RECAP 9.30.25 link.
Range was 50 handles on 1.425M contracts exchanged.
…Transition from Cycle Day 2 to Cycle Day 3
Transition into Cycle Day 3: Price is currently safely above the CD1 Low (6696.25) which if held, will satisfy the 91.33% historical Positive 3-Day Cycle Statistics.
Today also begins “Rocktober” and it is sure to offer a plethora of trading opportunities in the wake of a very strong bullish September.
Review this past month’s performance and set your course for excellence in discipline, execution and consistency for the remainder of 2025 and beyond. There are no “do-overs”…no reverse…So pick yourself up by the bootstraps and LET’S GET TO WORK TOGETHER!
Of course, nothing changes for PTG…Simply follow your plan. Take only Triple A setups and manage the $risk. ALWAYS HAVE HARD STOP-LOSSES in-place on the exchange.
PTG’s Primary Directive (PD) is to ALWAYS STAY IN ALIGNMENT with the DOMINANT FORCE.
As such, scenarios to consider for today’s trading.
Bull Scenario: Price sustains a bid above 6725+-, initially targets 6735 – 6740 zone.
Bear Scenario: Price sustains an offer below 6725+-, initially targets 6715 – 6710 zone.
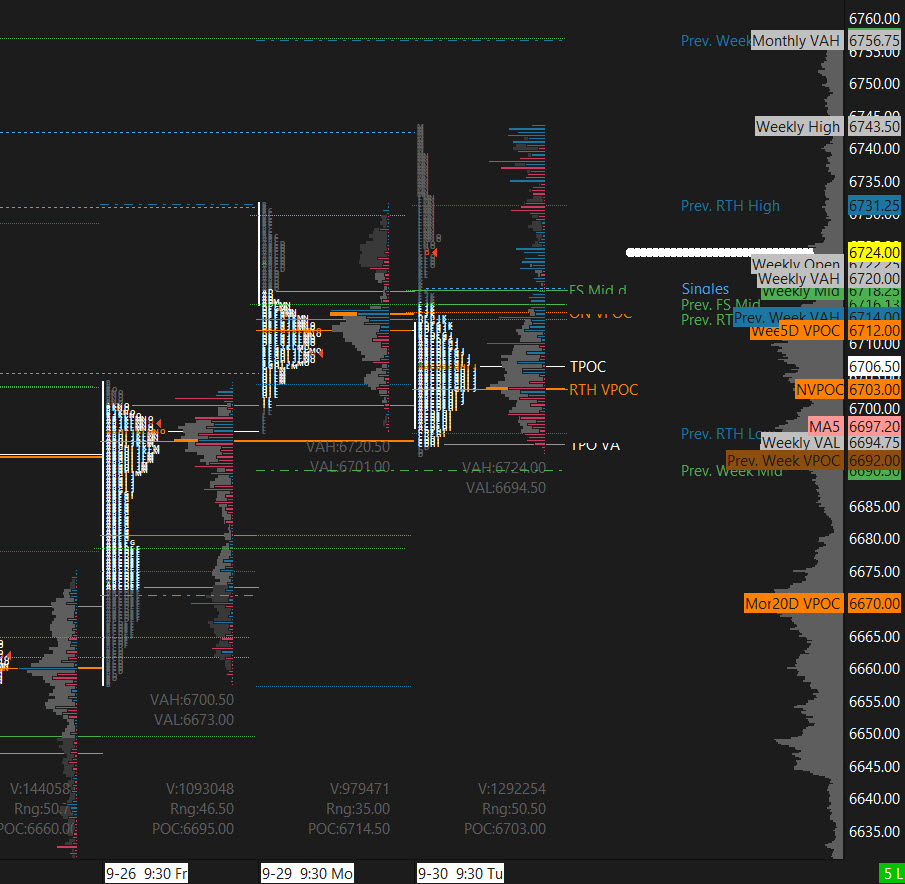
PVA High Edge = 6719 PVA Low Edge = 6694 Prior POC = 6704
ESZ
Thanks for reading, PTGDavid
MiM and Daily Recap
Intraday Recap
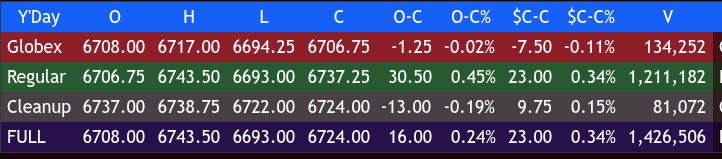
The overnight Globex session opened at 6708.00 and traded within a narrow early range before establishing direction. The first notable move came with a dip to 6706.75 at 20:00, which quickly recovered to a high of 6715.50 at 20:50. Buyers extended the push to 6717.00 at 23:40, the overnight high. From there, the market softened, pulling back to 6707.50 by 01:00. Another bounce lifted ES to 6715.75 at 02:30, but sellers pressed back, driving prices down to the Globex low of 6694.25 at 03:40. A modest recovery carried futures to 6705.50 at 05:00 before slipping again to 6695.75 at 06:30. Globex settled at 6706.75, down 1.25 points or -0.02% from its open and off 7.50 points (-0.11%) from the prior cash close.
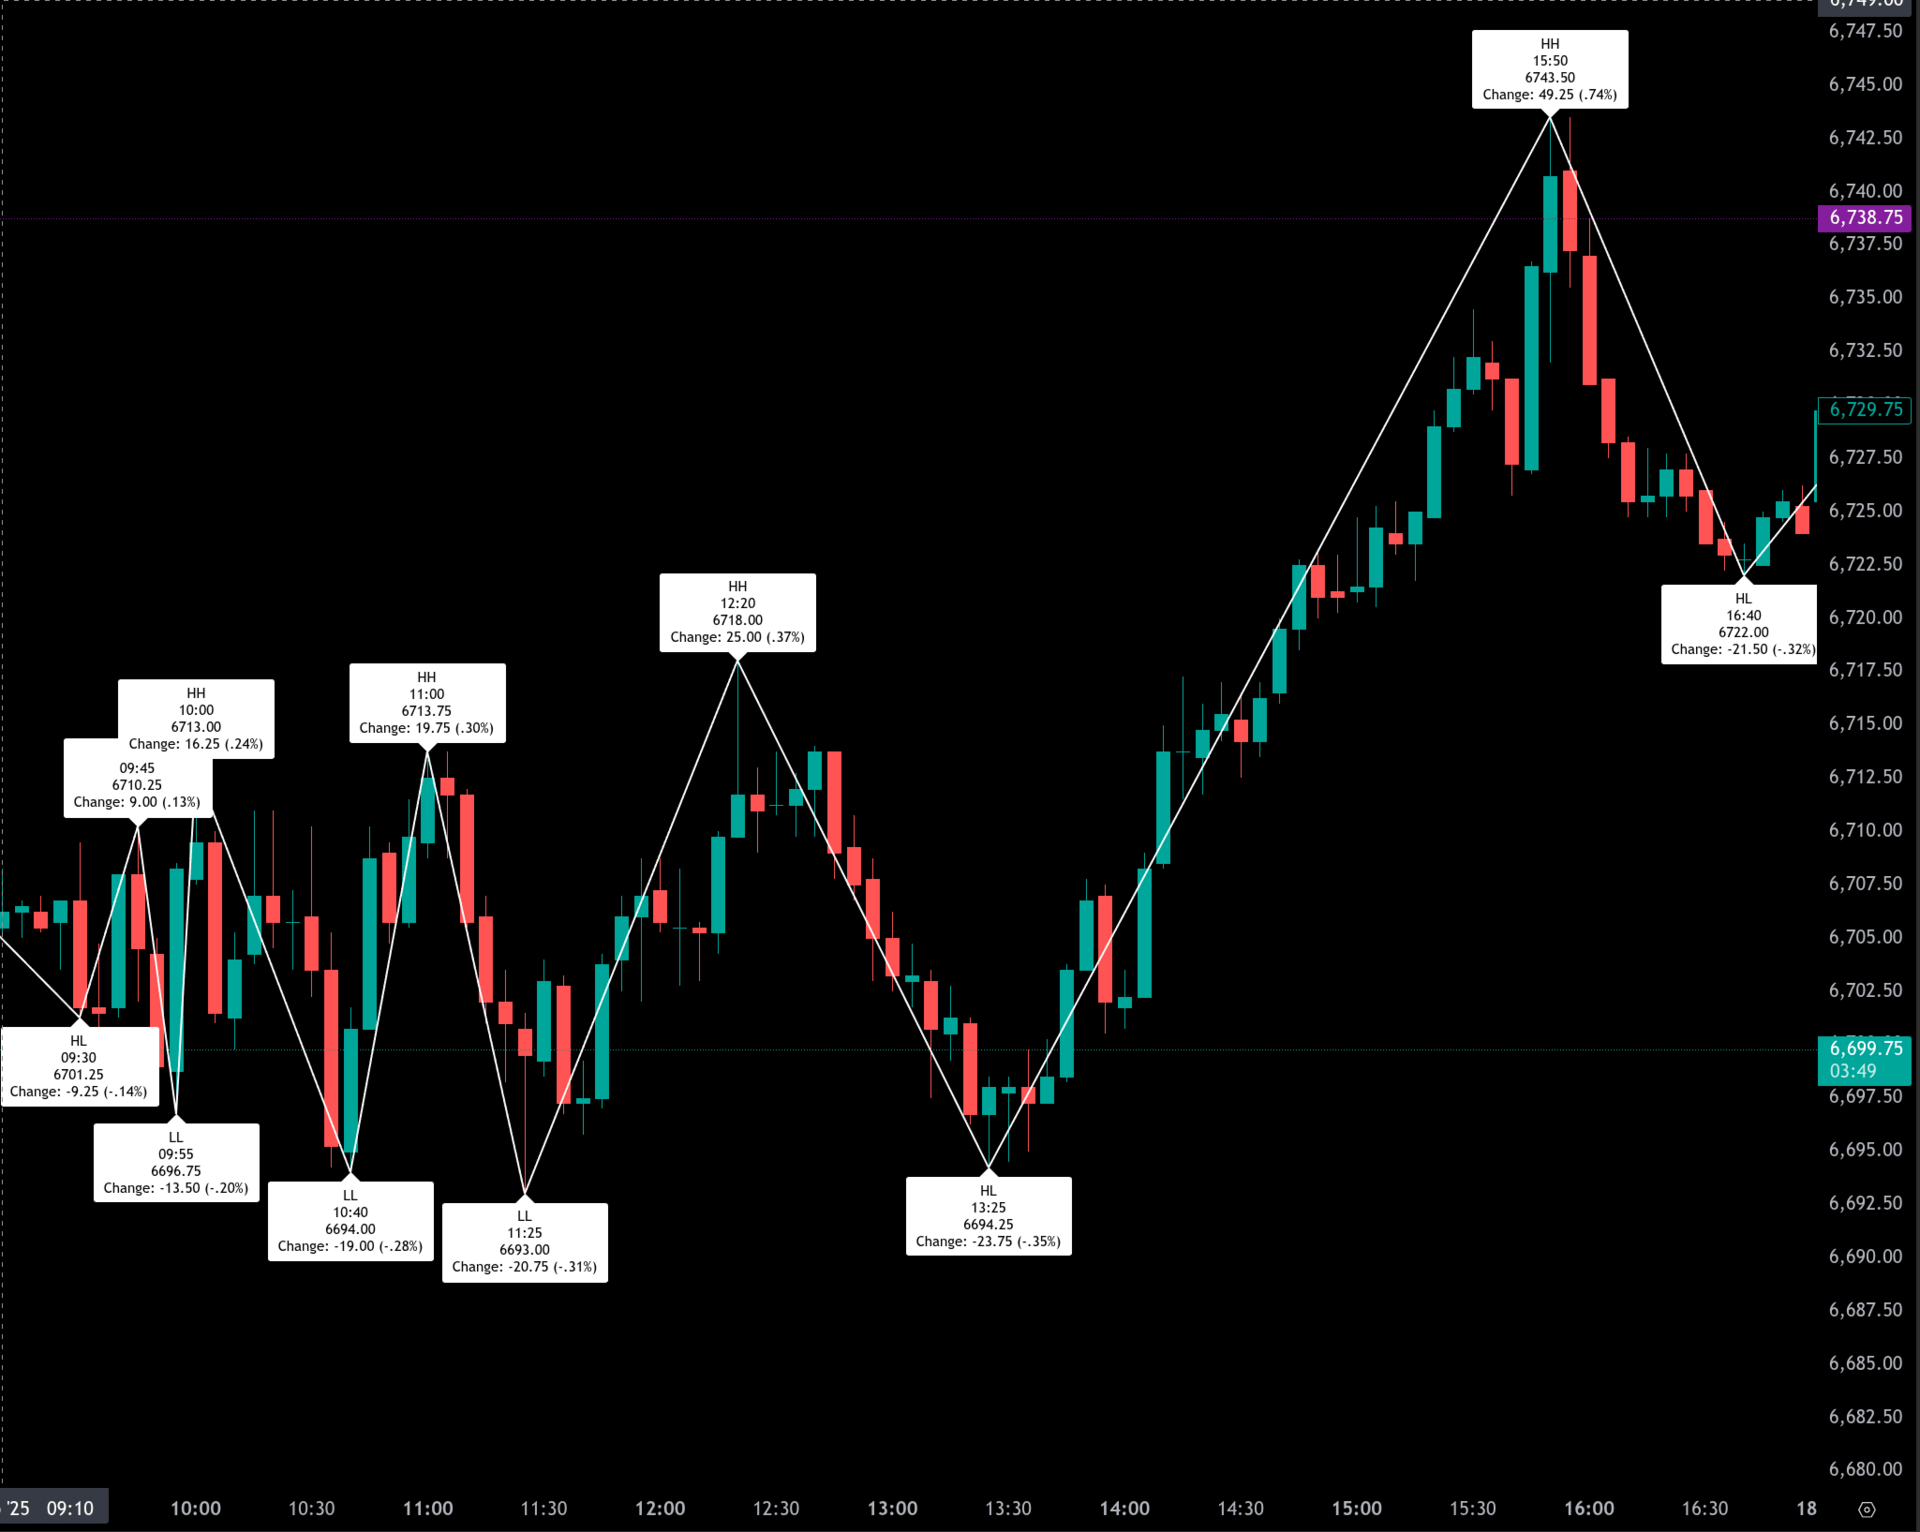
The regular session began at 6706.75 and initially climbed, reaching 6713.00 by 10:00. A quick reversal sent futures down to 6694.00 at 10:40 and a lower low at 6689.00 by 11:25, marking the morning’s weakest point. Buyers reasserted control midday, pushing ES to 6718.00 at 12:20, and momentum accelerated into the afternoon. The rally peaked at 6743.50 at 15:50, a 54.50-point rebound from the late-morning trough. A fade into the close brought futures to 6737.25, finishing the day session up 30.50 points or +0.45% from the open and 23.00 points (+0.34%) above the prior close.
The cleanup session saw some retracement, with futures sliding to 6722.00 before settling at 6724.00, down 13.00 points (-0.19%) from its open. On a full-session basis, ES advanced 16.00 points or +0.24% from the combined open and ended 23.00 points higher than the previous day’s settlement.
Market Tone & Notable Factors
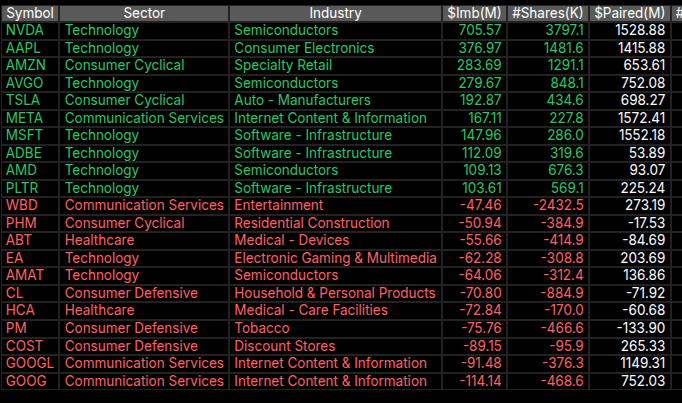
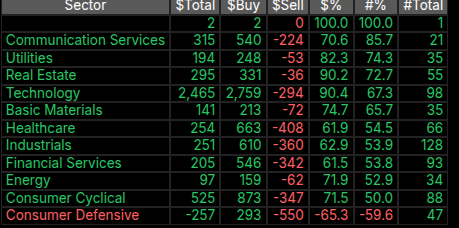
The overall tone leaned bullish, with the regular session rally erasing overnight weakness and propelling futures to their highest levels of the day into the late afternoon. The key driver was steady buying interest in technology and growth names, reflected in sector-level imbalance data. Technology led all groups with $2.46B in buy imbalances and a 90% buy skew. Nvidia (+705M), Apple (+377M), and Amazon (+283M) topped the buy list, while selling concentrated in defensive and communication names such as Google (-114M), COST (-90M), and PM (-75M).
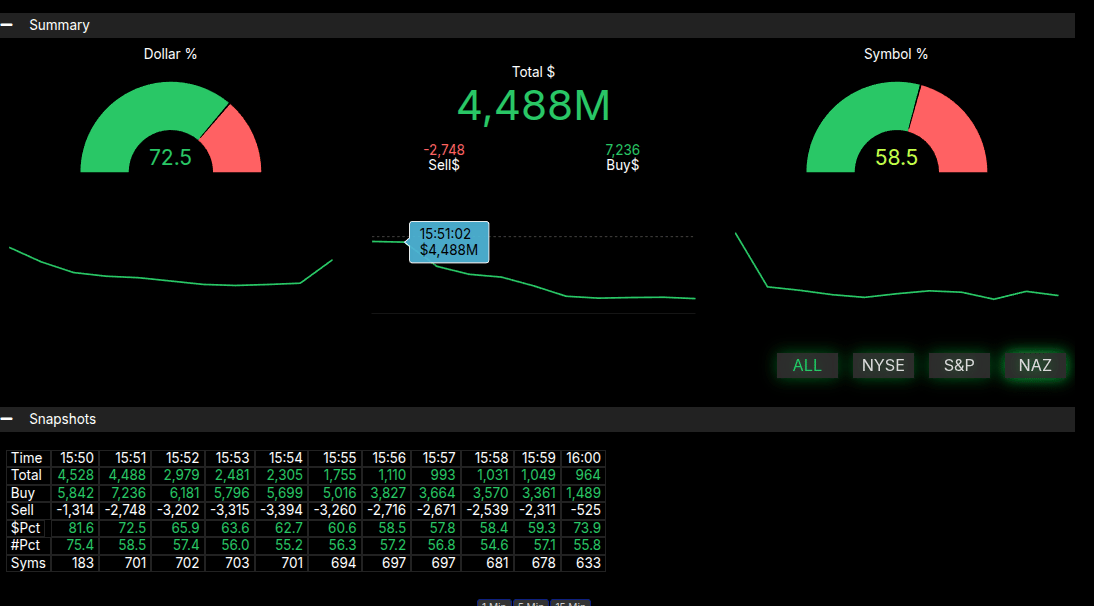
The Market-on-Close imbalance data reinforced the bullish bias. Dollar flow registered 72.5% to buy, well above the 66% threshold, signaling strong end-of-day demand. Symbol participation was more balanced at 58.5% buy, but the heavy dollar bias lifted futures into the final minutes and helped secure the positive close.
In sum, despite early volatility, buyers dominated the session, carrying ES higher and closing above the prior day’s settlement. With technology leadership and supportive MOC flows, the market displayed resilience, setting a constructive tone for the next session.
Technical Edge
Fair Values for October 1, 2025:
SP: 51.67
NQ: 2
Dow: 361.43
Daily Market Recap 📊
For Tuesday, September 30, 2025
NYSE Breadth: 50% Upside Volume
Nasdaq Breadth: 51% Upside Volume
Total Breadth: 50% Upside Volume
NYSE Advance/Decline: 53% Advance
Nasdaq Advance/Decline: 49% Advance
Total Advance/Decline: 54% Advance
NYSE New Highs/New Lows: 123 / 45
Nasdaq New Highs/New Lows: 187 / 103
NYSE TRIN: 1.17
Nasdaq TRIN: 0.88
Weekly Market 📈
For the week ending Friday, September 26, 2025
NYSE Breadth: 50% Upside Volume
Nasdaq Breadth: 54% Upside Volume
Total Breadth: 52% Upside Volume
NYSE Advance/Decline: 39% Advance
Nasdaq Advance/Decline: 40% Advance
Total Advance/Decline: 37% Advance
NYSE New Highs/New Lows: 312 / 107
Nasdaq New Highs/New Lows: 692 / 209
NYSE TRIN: 0.61
Nasdaq TRIN: 0.56
ES & NQ Futures trading levels (Premium only)

Calendars
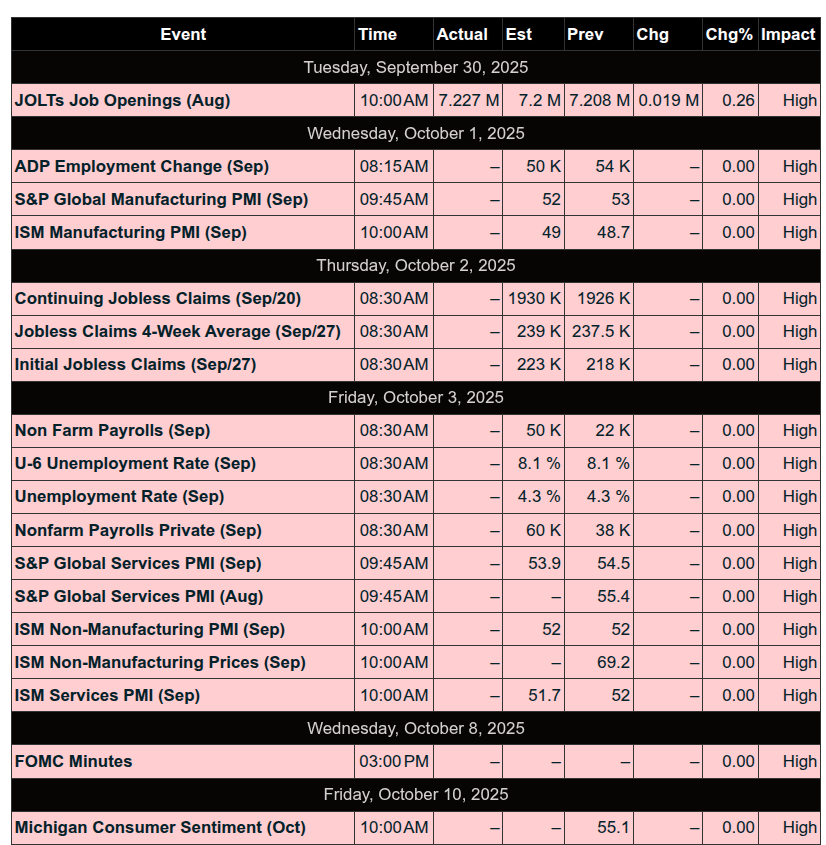
Economic
Today
Important Upcoming / Recent
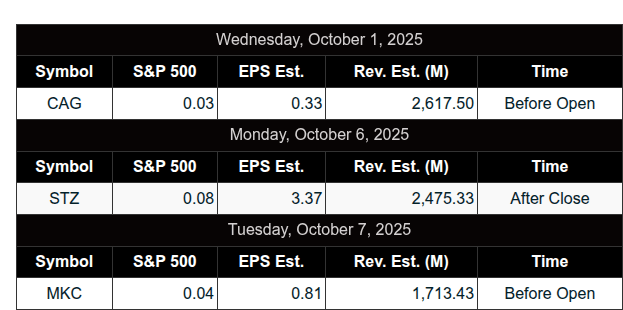
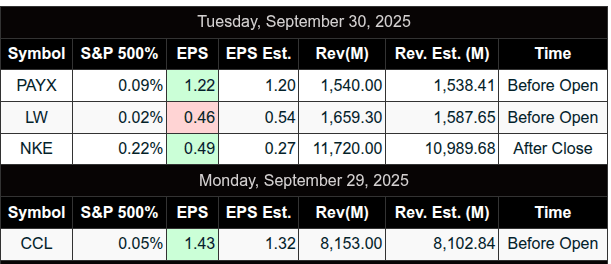
Earnings
Upcoming
Recent
Trading Room Summaries
Polaris Trading Group Summary - Tuesday, September 30, 2025
Overview:
Tuesday's trading session unfolded as a textbook Cycle Day 2 (CD2) — defined by strong, rotational price action that provided clear edges, well-timed pivots, and multiple high-probability opportunities for both long and short traders. The day emphasized patience, timing, and reading market structure in alignment with time cycles, order flow, and price levels outlined in the Daily Trade Strategy (DTS).
Key Wins & Trade Highlights:
1. Early Game Plan Set the Tone:
Manny outlined three scenarios: Continuation Long, Reclaim Long, and Breakdown Short, with clear trigger levels, order flow confirmations, and targets.
Most notably, Continuation Long above ES 6707 was eyed, but never triggered early, keeping traders cautious and disciplined.
2. Spot-On AM Read (Big Win):
At 9:43 AM, Manny predicted:
“If SPX 6650 / ES 6702 fails we will see ES 6650.”
Price action followed the script, dropping precisely to that area, giving traders a high-conviction short early in the day.
3. Strategic Short Into 10:30 High:
Manny sold into the 10:30 AM expected high, guided by cycle timing and resistance zones. This move emphasized trading with the tempo of the day.
Strong reaction to economic data (Chicago PMI, Consumer Confidence) helped validate trade direction.
4. Precision Use of Intraday Clock:
The AM high, Mid-AM low, and Lunch high all aligned beautifully with timing windows.
Manny’s long from 6701 into the Lunch High at 6718 was textbook clock-based execution:
“+3, +5, runner b/e stop... LONG into the lunch high.”
5. Afternoon Pivot Long - Boom Trade:
Around the 2:30 PM low window, Manny and David shifted bias from short to long based on unfolding conditions.
The long from that window delivered a ripper move into the close, with price ripping past targets:
6725, 6730, 6736, and finally 6743 CD2 Rally Target — all fulfilled.
6. DTS Levels Hit to the Tick:
PTGDavid highlighted that DTS levels and CD2 rhythm were “spot on,” with buyers in control above 6710.
The day’s action validated the power of preparedness and structured trade planning, not hindsight.
7. Closing Push – EOM Window Dressing:
A massive $4.8B MOC buy imbalance fueled the final push, capping the month with strength.
The final rally tagged all DTS targets, ending September on a bullish note and kicking off “ROCKTOBER.”
Lessons Learned:
Patience Pays: The early continuation long never triggered — many traders avoided a potential loss by respecting the plan and not forcing trades.
Clock Timing is Powerful: Pivots occurred nearly to the minute — proving the S4H timing model’s value.
Plans Must Flex: Manny adjusted his afternoon trade plan when market structure changed — flexibility with discipline is key.
Preparation Beats Prediction: DTS and trade levels guided the room consistently — the big wins were prepped hours ahead, not guessed in real time.
Key Levels (from DTS and Price Action):
Support/Buy Zone: ES 6695–6700, 6677.50
Resistance: ES 6710, 6725, 6730, 6736, 6743
Line in the Sand: ES 6710 — pivotal level for both sides
Target Fulfilled: ES 6743 (CD2 Rally Target)
Final Notes:
Textbook Cycle Day 2 — well-structured and highly tradable
Multiple opportunities for both longs and shorts with clean setups
End-of-month strength capped off September with bullish conviction
Manny and David's prep + live adjustments = consistent edge
Next up: ROCKTOBER begins today. Expect continuation if bulls remain in control.
Stay prepped, stay flexible, and trust the levels.
Discovery Trading Group Room Preview – Wednesday, October 1, 2025
Government Shutdown Begins: The U.S. government has officially shut down after the Senate failed to reach a compromise. Trump’s comments hinting at potential mass firings add uncertainty, despite no such plans in official agency guidance. Roughly 400,000 federal employees are furloughed; essential services like TSA, Medicare, Social Security, USPS, and the Fed remain operational.
Market Impact: While markets typically discount shutdowns, the current backdrop—Fed rate cut cycle, market highs, and sharper political conflict—suggests greater potential implications. The immediate concern is how long the shutdown might last.
Tariffs In Effect: New tariffs hit today: 100% on pharmaceuticals (with carve-outs like Pfizer's 3-year grace deal) and 25% on heavy-duty trucks. Additional tariffs on timber and furniture begin October 14.
Commodities & Earnings: Gold continues its breakout, nearing $4,000/oz. Premarket earnings include Acuity (AYI) and RPM International (RPM).
Key Data & Events Today:
ADP Jobs Report (8:15am ET)
S&P Global and ISM Manufacturing PMIs, Construction Spending (10:00am ET)
Crude Inventories (10:30am ET)
Fed’s Barkin speaks at 12:15pm ET
Market Technicals:
Volatility steady; ES 5-day ADR at 54.50 points.
Whale bias is short heading into the U.S. open.
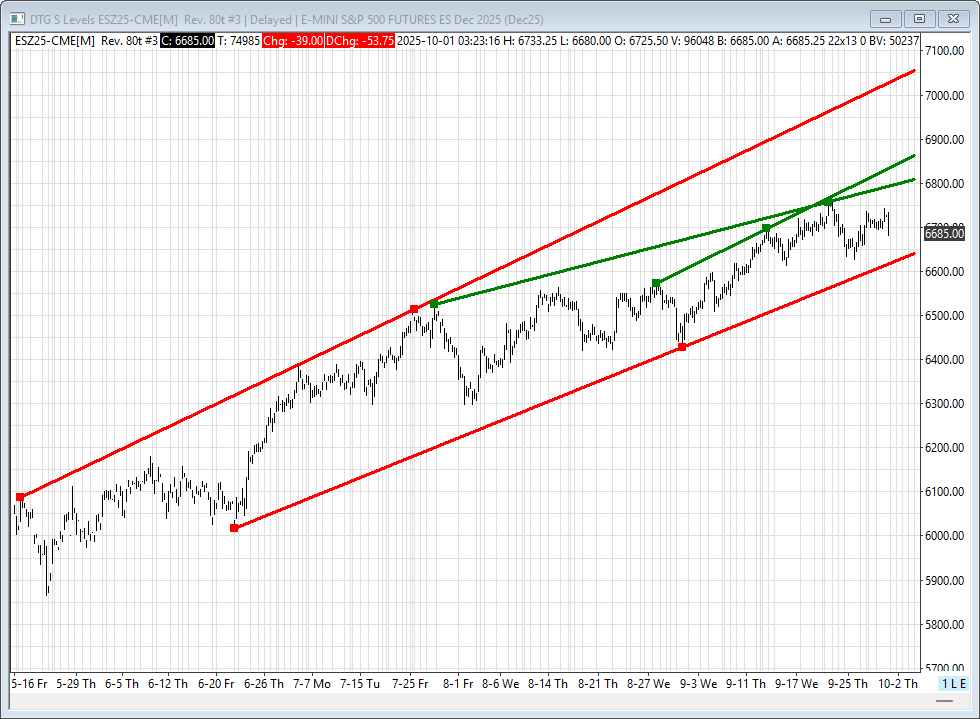
ES remains within its short-term uptrend; key trendline levels:
Resistance: 6799/04, 6858/63, 7058/63
Support: 6618/23