- The Opening Print
- Posts
- How Well Do Politics and Markets Mix?
Follow @MrTopStep on Twitter and please share if you find our work valuable.
Today is Fry-Day, which means it’s a free-read for everyone. If you’d like to consider upgrading to our premium membership, do so with a free 7-day trial.
Our View
I have always said we live in an ever-changing world and today was a great example.
Trump was found guilty of all 34 counts. They say politics and the markets don't mix, but they sure seem to in this election. Do I think the news had anything to do with the late selloff? Maybe a little, but the ES and NQ were already going down.
According to Ed Yardeni, founder of Yardeni Research, “The stock market has a history of tuning out domestic political turmoil, however, the political climate is clearly going to be even more volatile after the Trump verdict, which could increase volatility in the stock market.”
It may in the short run, but I don’t think it has anything to do with the current selloff. Will Trump face jail time? No, prison time is rare for people convicted in New York state of felony falsification of business records.
Our Lean
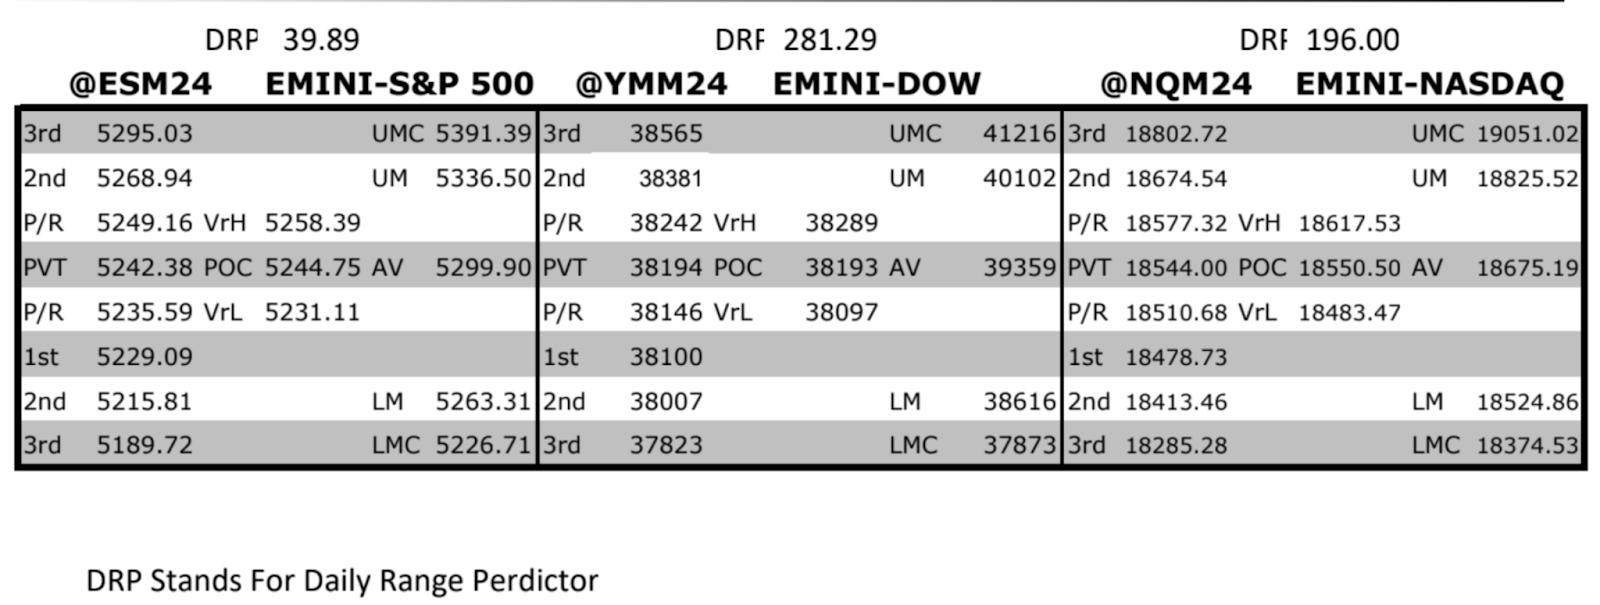
We gave out support at 5250 and yesterday's early low was 5250 before the ES traded down to 5234.50 at 8:45. We see support at 5220 as key, followed by 5210 and 5201. However, if we start breaking down though, we could see a further breakdown to the 5190 level and then the 5180 level.
What we do know is the ES is now down 3 out of the last 5 sessions for a total of ~92 points. This morning we will get a look at the Fed's preferred inflation gauge, the PCE report for April.
According to the Dow Jones, estimated inflation is expected to come in at 2.7% for April, still above the central bank’s 2% target. If the number comes in higher I expect an early selloff then a bounce. PitBull was right about this week.
MrTopStep Levels:
MiM and Daily Recap
ES recap
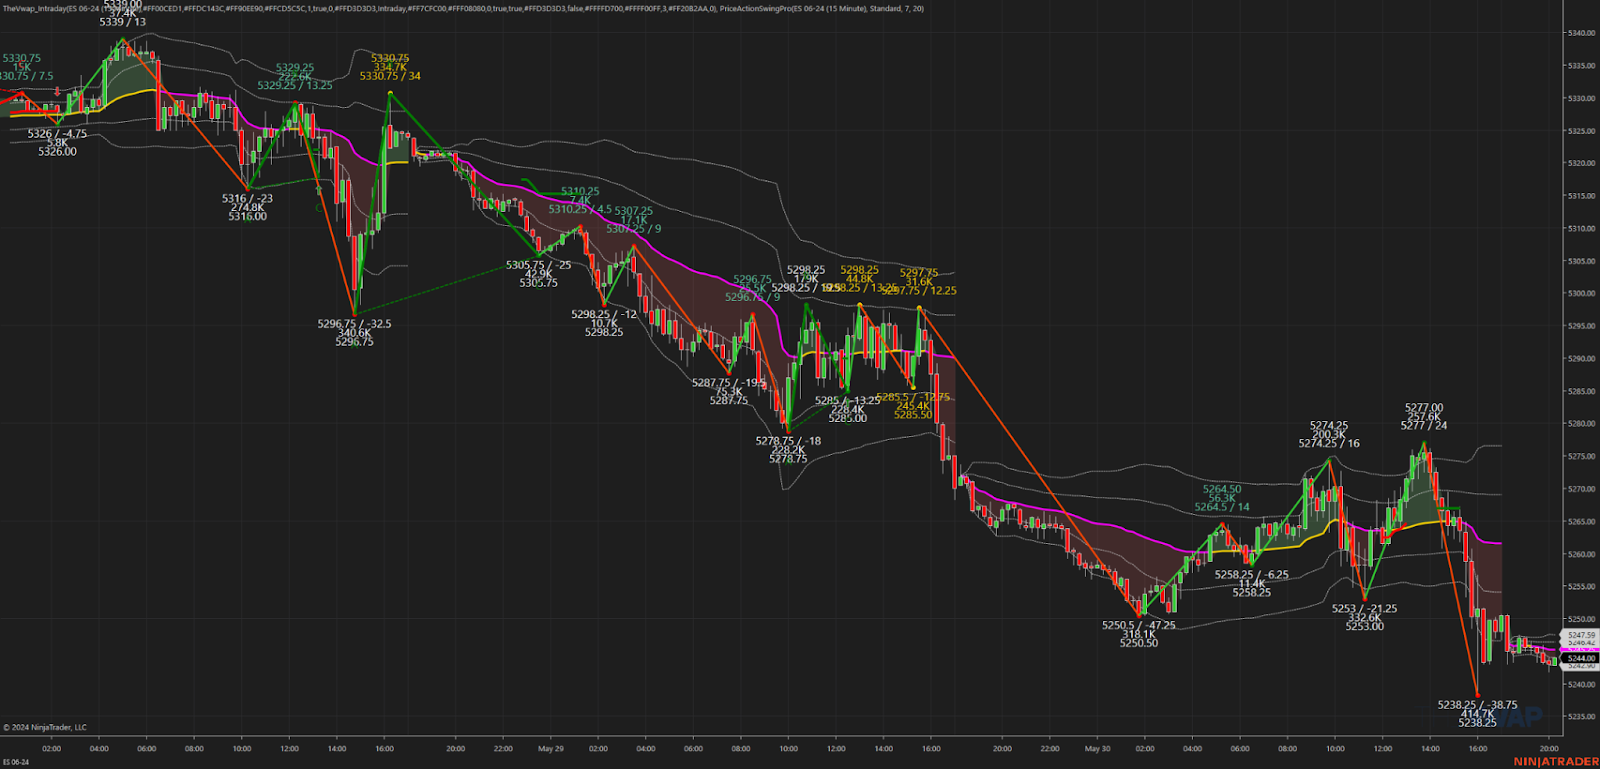
The ES traded down to 5250.50 on Globex and opened Thursday's regular session at 5269.75. After the open, the ES rallied up to 5274.25 at 9:35, traded down to 5263.25 at 9:40, traded back up to a lower high at 5272.75 at 10:10, and then dropped down to a new low at 5267.00. From there, it rallied back up to 5367.25 at 10:30, sold back down to 5253.00 at 11:00 as NVDA made a lower low.
The bottom line: Everything has turned into a slow grind.
After the low, the ES traded back up to 5362.00, pulled back to 5260.25 and then rallied up to 5268.00, pulled back to the 5261.50 level and that's when several small buy programs pushed the ES up to 5277.00 at 1:45. After the high, the ES sold off down to 5260.75 at 2:20, rallied back up to 5269.25 at 2:35, sold off down to 5253.25 at 3:25 as NVDA started getting hit on headlines like this one: “US reigning in chip sales to Middle East.”
The ES popped back up 5258.75 and then dumped down to 5248.50 at 3:40, traded 5241.00 as the 3:50 cash imbalance showed $1.9 billion to sell, sold off down to the low at 5238.25 and traded back up to 5251.50 at 3:55 as the imbalance went down to $1.3 billion to sell and traded 5252.00 on the 4:00 cash close. After 4:00 the ES chopped in a narrow range and settled at 5250.50, down 40.75 points or 0.77%. the NQ settled at 18,606, down 196 points or 1.04%, the yield on the 10-year note settled at 4.553%, down from 4.623% Tuesday.
In the end yesterday's trade was identical to Wednesday's trade: gap down, pull back a little then rally and then fail late in the day. In terms of the ES's overall tone, the NQ (and CRM) were the weak links dragging down the YM over 290 points and is down 2.5% for the week. In terms of the ES's overall trade, volume was higher: 227K ES traded on Globex and 1.186 million traded on the day session for a total of 1.413 million contracts traded.
The 5-day average volume is 1.108 million, the 20-day average volume is 1.181 million and the 50-day average volume is 1.443 million. So after a 3-week stretch of historically low volume we are starting to see a pick up.
Technical Edge
NYSE Breadth: 66% Upside Volume
Nasdaq Breadth: 66% Upside Volume
Advance/Decline: 75% Advance
VIX: ~14.25
Guest Post — Spot Gamma
SpotGamma is one the the shining stars of the options markets. If you have never heard of them or already know of them and have never signed up for their options flow products or the SG Academy, I fully suggest you check them out and add them to your trader’s toolbox.
Here’s a snippet from them:
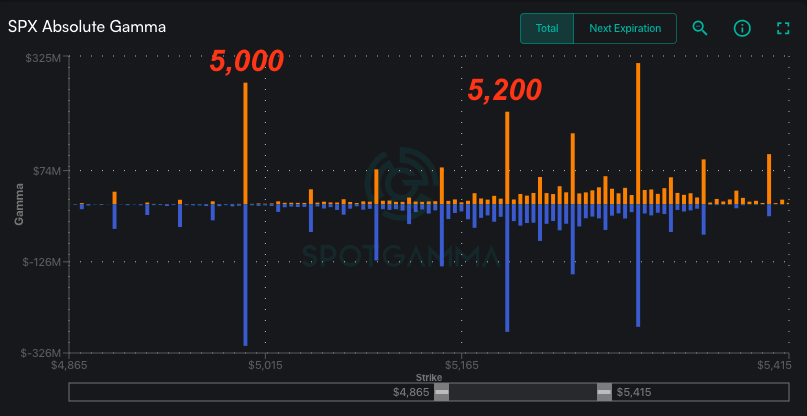
What we need for some decent market movement and for long vol to perk up is a break from the large, supporting gamma that has been smothering volatility. We've highlighted 5,250 as our "risk off" line, as it implied a test of 5,200 would come quickly. Futures are now implying an open near 5,230 ahead of PCE, with large 5,200 support easily in reach.
Should we break <5,200 you can see that the size of SPX gamma positions decreases meaningfully, all the way down to the very large 5,000 strike. This implies to us that volatility, both realized and implied, should increase meaningfully if 5,200 is broken. The addition of long downside puts would add negative gamma, which should fuel more volatility. In the April drawdown we saw the VIX sniff 20, and that is they type of move we'd expect <5,200 this time as well.
Economic Calendar
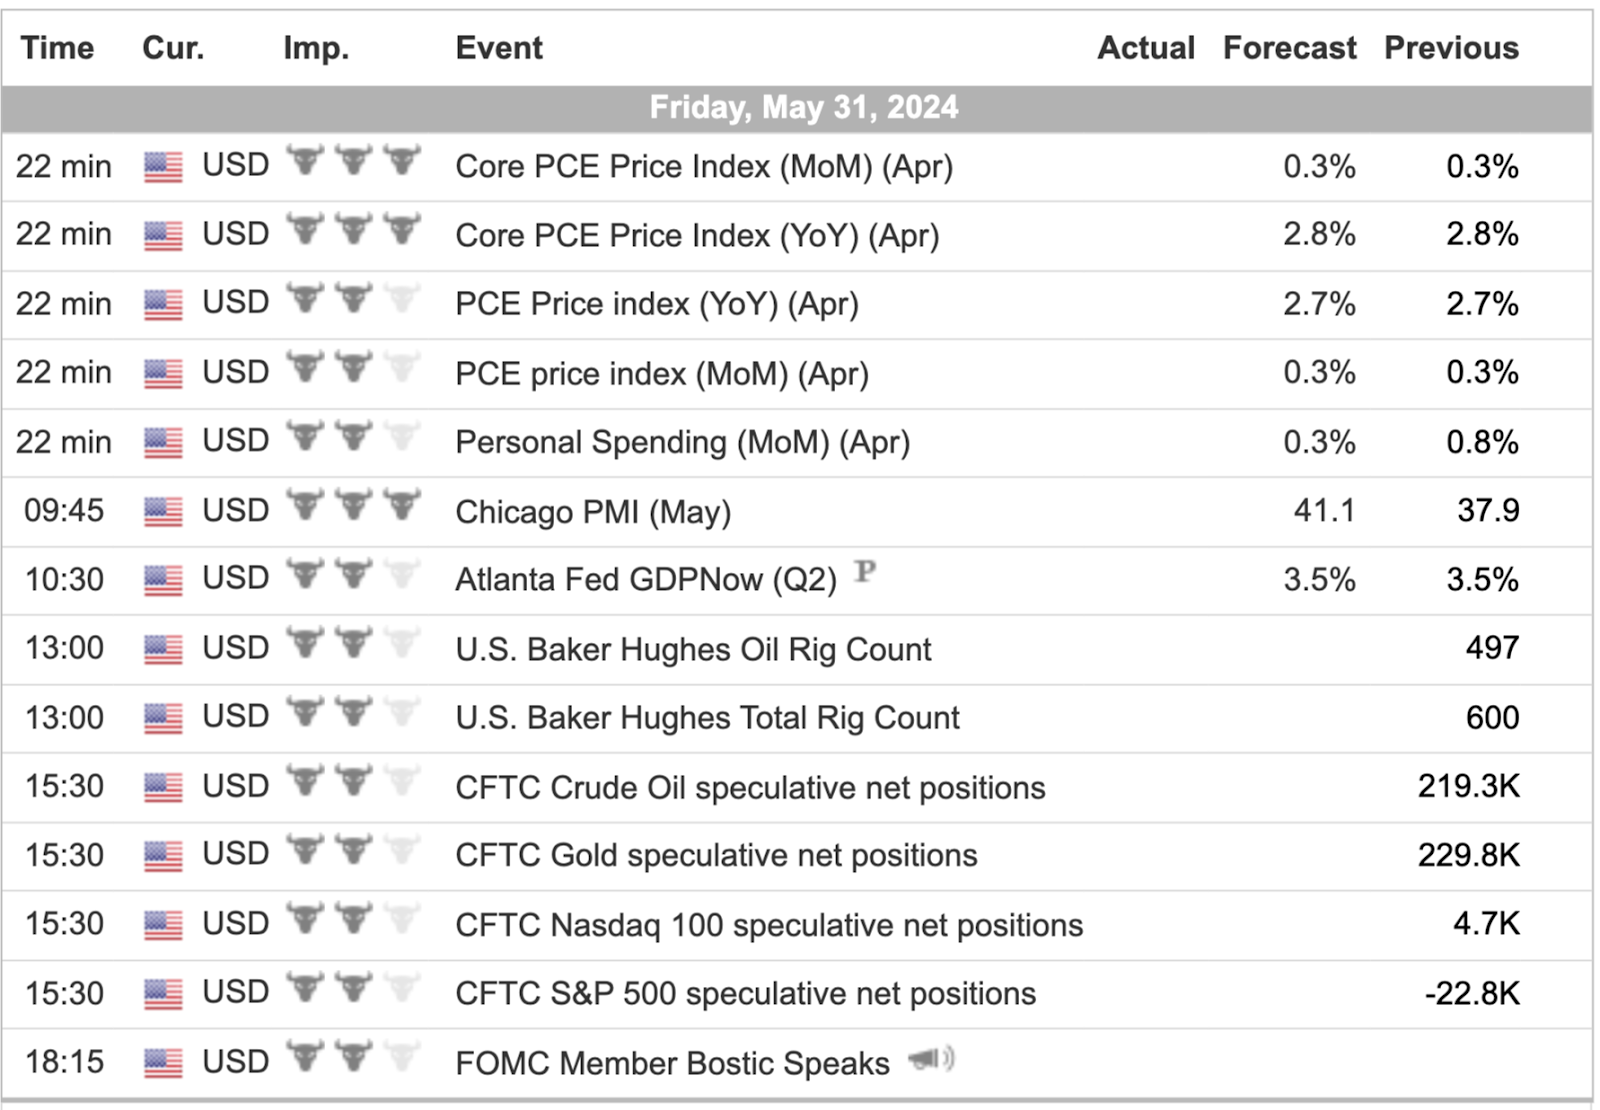
For a more complete Economic Calendar see: https://mrtopstep.com/economic-calendar/