- The Opening Print
- Posts
- Week One Says Buy the Dip and Mind Your Stops
Week One Says Buy the Dip and Mind Your Stops
Danny Riley
January 02, 2026
Follow @MrTopStep on Twitter and please share if you find our work valuable!
Our View
I have to start this out by saying my revised upside estimate that I changed higher after the April lows at 6950 was not far off — the ESZ25 7014.25 contract high. I had a long discussion with Rich from @HandelStats, where I said I did think we could see a new high, but I resisted the idea of ES 7100 or higher over the last few weeks, even after the 5-day rally.
It just all looked too easy to me. And while I did think Santa would show, I also thought there was a change in the ES and NQ’s overall price action that started on Monday. I even went as far as saying that Tuesday’s close was not good and could lead to lower prices. I also put out a warning about the end-of-December rebalancing.
All in all, it was a very good year for the stock market.
2025 Performance Summary for Major U.S. Stock Index Futures
Futures Contract | Symbol | Underlying Index | 2025 Full-Year Net Change | Gain from April 2025 Low to Year-End |
|---|---|---|---|---|
E-mini S&P 500 | ES | S&P 500 | +16.4% | +37.4% |
E-mini Nasdaq-100 | NQ | Nasdaq-100 | +20.4% | +45.2% |
E-mini Russell 2000 | RTY | Russell 2000 | +11.3% | +38.6% |
E-mini Dow Jones ($5) | YM | Dow Jones Industrial Average | +13.0% | +32.8% |
Our Lean
The first trading day of 2026 is bullish, and it's also January week one, FRYday expiration.
From last night on X:
MrTopStep @MrTopStep
$ES is it Sunday night …lol
IMPRO : Dboy : (6:27:41 PM) : Weak close up on Globex and tomorrow
IMPRO : Dboy : (6:28:38 PM) : if es gaps lower with
IMPRO : Dboy : (6:29:03 PM) : which I don’t think it will, it’s a big fat buy
Our lean: Buy the pullbacks, look for higher prices, and use stops.

Guest Posts:
SPX 2025: From Panic to Persistence
Rich Miller - Handelstats.com

SPX
The S&P 500’s 2025 path is a textbook example of why time, structure, and reference levels matter more than headlines.
After opening the year with a sharp drawdown, the SPX fell over 21% from the February high to the April year-low, marking one of the more violent first-quarter resets in recent years. From the 2024 close to that April low, the index was down nearly 20%, testing investor conviction early.
But markets don’t move on emotion alone — they move on repair.
The Turn: April Was the Inflection
April marked the low and the beginning of a steady, structurally sound recovery. From that point forward, the market transitioned into a persistent, trend-driven advance, reclaiming level after level with minimal backtracking.
By year-end:
The SPX closed +16.39% from the 2024 close
From the April low to the December close, the advance exceeded 40%
The year closed at 6845.50, just off the late-December highs
(returns do not include dividends)
Quarter-by-Quarter Perspective
Q1 2025: −4.59%
Volatility, liquidation, and forced repricingQ2 2025: +10.57%
Strong rebound off the April lowQ3 2025: +7.79%
Trend continuation with improving breadthQ4 2025: +2.35%
Compression, digestion, and consolidation near highs
This was not a one-month wonder — it was a time-validated trend.
Why the Gaps Matter
The yellow zones on the chart highlight unfilled opening gaps, many of which formed during the summer and early-fall advance. These gaps are not predictions — they are references.
Unfilled gaps often act as:
Support during pullbacks
Magnet levels during corrective phases
Risk-definition zones for swing and position traders
Notably, the market respected these structures throughout the second half of the year, reinforcing the idea that price acceptance over time is what confirms trend strength.
The Big Takeaway
2025 reminds us that:
Violent declines reset expectations
Time confirms direction
Structure tells the truth long after the news cycle fades
Markets that survive sharp first-quarter damage and still close near the highs are not weak markets — they are repaired markets.
As we move into 2026, these monthly and quarterly closes, along with the unfilled gap structure, remain critical reference points for risk, opportunity, and expectation.
—
HandelStats
Quantifying markets. Respecting time.
$SPX return by Quarter
5611.85 | 5881.63 | -269.78 | -4.59% | Q1 2025 |
6204.95 | 5611.85 | 593.10 | 10.57% | Q2 2025 |
6688.46 | 6204.95 | 483.51 | 7.79% | Q3 2025 |
6845.50 | 6688.46 | 157.04 | 2.35% | Q4 2025 |
$SPX return by Month
6040.53 | 5881.63 | 158.90 | 2.70% | 25-Jan |
5954.50 | 6040.53 | -86.03 | -1.42% | 25-Feb |
5611.85 | 5954.50 | -342.65 | -5.75% | 25-Mar |
5569.06 | 5611.85 | -42.79 | -0.76% | Apr-25 |
5911.69 | 5569.06 | 342.63 | 6.15% | May-25 |
6204.95 | 5911.69 | 293.26 | 4.96% | Jun-25 |
6339.39 | 6204.95 | 134.44 | 2.17% | Jul-25 |
6460.26 | 6339.39 | 120.87 | 1.91% | Aug-25 |
6688.46 | 6460.26 | 228.20 | 3.53% | Sep-25 |
6840.20 | 6688.46 | 151.74 | 2.27% | Oct-25 |
6849.09 | 6840.20 | 8.89 | 0.13% | Nov-25 |
6845.50 | 6849.09 | -3.59 | -0.05% | Dec-25 |
** Does not include dividends.
Market Recap
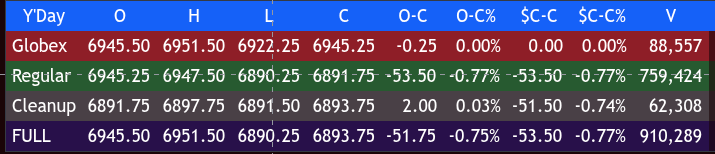
The ES traded down to 6923.00 on Globex and opened Wednesday’s final trading session of the year at 6945.25. After the open, the ES traded 6947.50 and sold off down to 6925.25 at 9:45, rallied up to 6937.50, and then sold off down to a new low at 6721.50 at 10:15. It traded up to 6929.00 at 10:30 and then sold off down to 6913.75 at 10:55.
It rallied back up to 6927.00 at 12:00, pulled back to a higher low at 6918.50 at 12:10, back-and-filled in a 5- to 6-point range, rallied up to 6935.25 at 2:00, and then sold off down to the 12/23 low at 6913.25 at 2:30. A short-covering rally took the ES up to 6920.75, followed by another selloff to a new low at 6901.25 at 3:10.
It then rallied up to 6907.50, sold off down to 6897.50 at 3:30, popped up to 6909.25 at 3:35, and traded 6900.75 as the 3:50 imbalance showed $2.2 billion to sell. It then sold off down to 6890.00 at 3:55 and traded 6891.55 on the 4:00 cash close. After the close, the ES rallied up to 6897.75 at 4:14, and settled at 6892.50, down 51.75 points or -0.75%.
The NQ settled at 25,456.75, down 218.50 points or -0.85%, with both indices down four sessions in a row.
In the end, Wednesday’s selloff had very little to do with Santa — it was about the year-end rebalance and the JPMorgan collar.
In terms of the ES and NQ’s overall tone, every rally was sold into the 4:00 cash close. In terms of the ES’s overall trade, volume was higher at 910k, versus Tuesday’s 773k.
During a holiday-shortened week — with many global markets closed or lightly traded around New Year’s — the session reflected a mix of key details:
Subdued volumes.
U.S. jobless claims dropped to 199,000.
China’s December PMIs expanded to 50.1 (manufacturing) and 50.2 (non-manufacturing).
Seasonal S&P bullishness.
Low Fed rate cut odds (around 11–18% for a 25 bp cut in late January).
Mixed overseas closes.
The 10-year Treasury yield rose to 4.16%.
Gold fell $45 or 1.02% to a 2.5-week low.
Silver plunged 9%.
Bitcoin fell 375 points to 88,280.
Crude futures closed down $0.52 at $57.22.
Today’s lone economic release is the S&P U.S. Manufacturing Index
MiM
Market-On-Close Recap
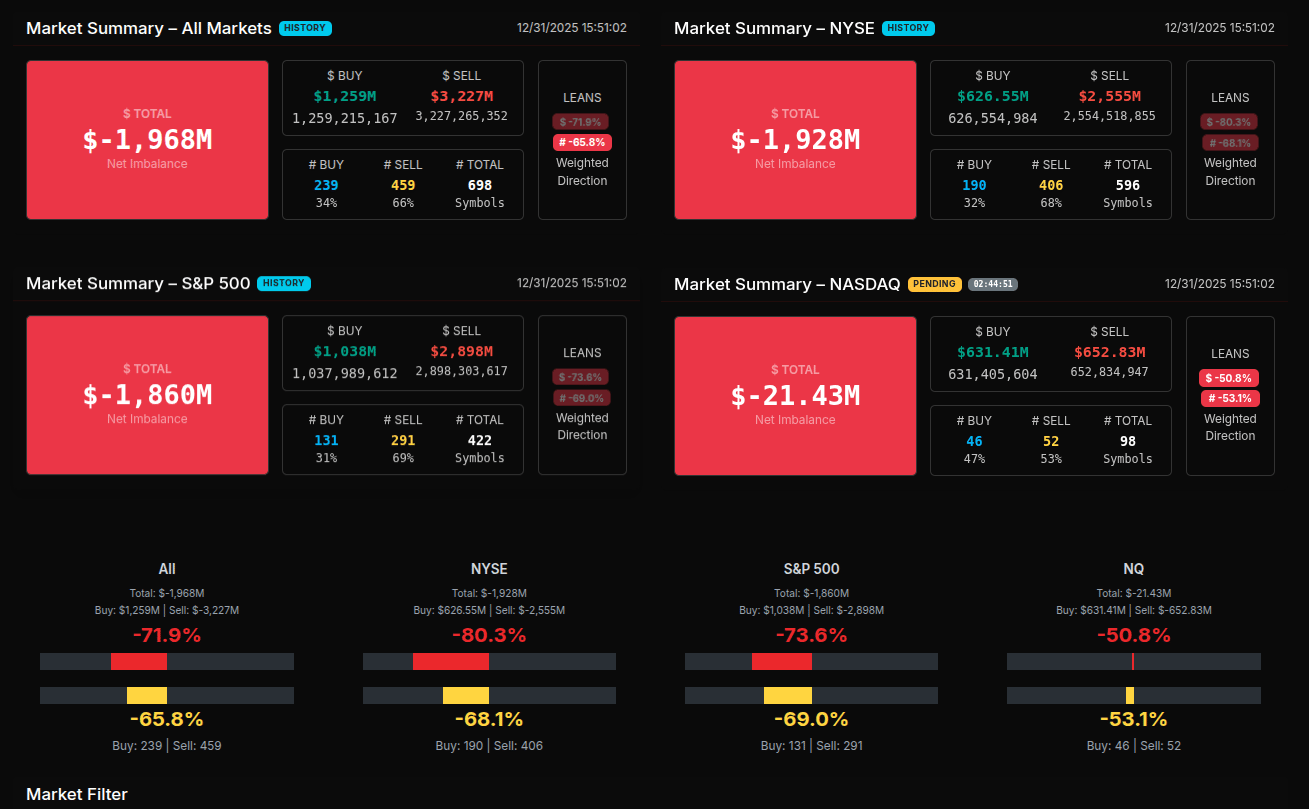
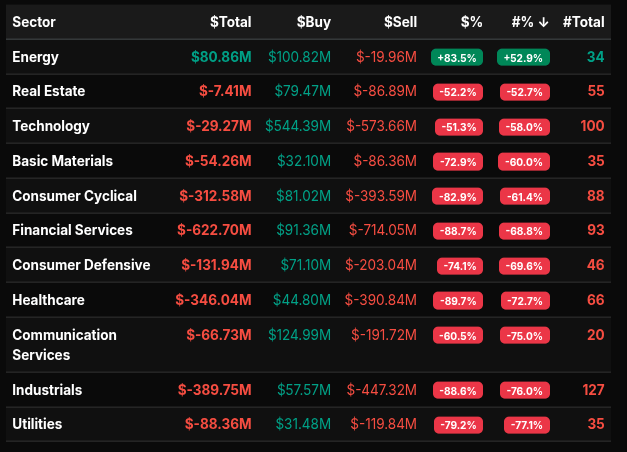
The market-on-close auction finished the final trading session of the year with a clear and persistent sell imbalance that never meaningfully stabilized. From the opening of the MOC window, sell-side pressure dominated and accelerated into the heart of the auction, reflecting broad institutional de-risking rather than tactical rebalancing.
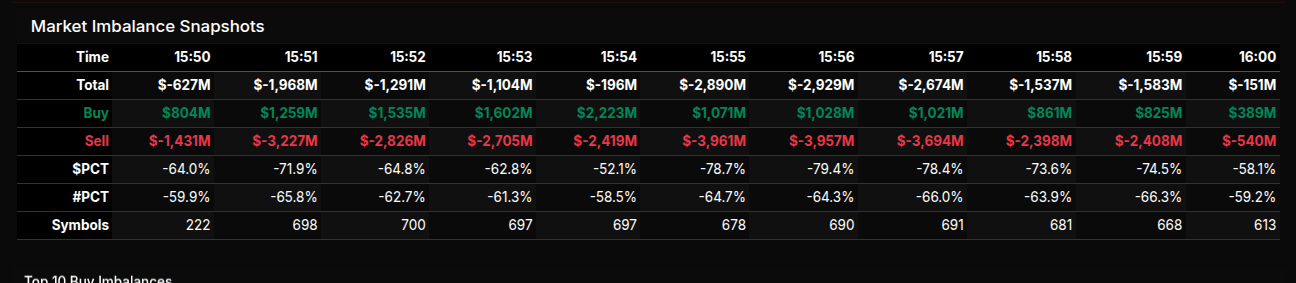
Early snapshots around 15:50 already showed a sizable net sell imbalance near $627M. As participation ramped up between 15:51 and 15:56, the imbalance deepened sharply, reaching a peak near $2.9B to the sell side. Dollar-weighted sell percentages consistently pushed beyond -70%, with several prints nearing -80%, signaling wholesale selling rather than rotation. Although buy dollars briefly increased mid-auction, they failed to offset the magnitude of sell programs. The final print moderated to roughly $151M net sell, but this was more a function of late matching than a shift in intent.
Sector data reinforced the risk-off tone. Financial Services, Healthcare, Industrials, and Consumer Cyclical all posted extreme negative leans well beyond -66%, marking them as institutional sell targets. Financials led the downside with over $620M net sold and a -88% lean, while Consumer Cyclical and Healthcare followed closely. Basic Materials and Utilities also showed heavy selling, adding to the defensive posture. Energy was the lone standout, posting a strong positive imbalance with an +83% lean, suggesting selective accumulation rather than broad sector strength.
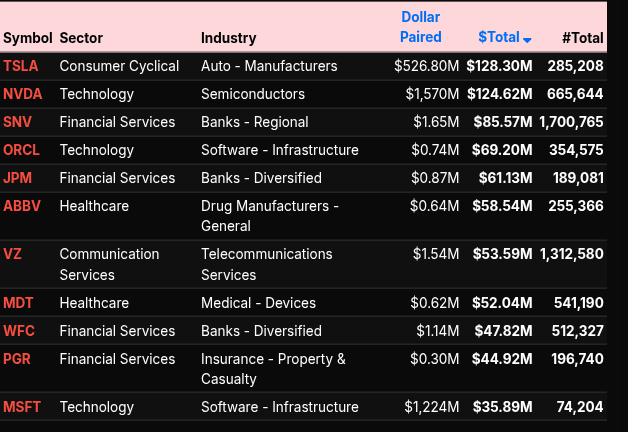
On the symbol level, large-cap and mega-cap names dominated activity. Selling pressure was evident across banks, industrials, and healthcare leaders, while technology flow was mixed, skewing more rotational than outright accumulation. Notably, symbols with leans closer to -50% reflected internal rotation within tech rather than aggressive liquidation.
Overall, the MOC painted a picture of year-end positioning and risk reduction. The sustained negative leans, sector-wide selling, and heavy dollar imbalance confirm that institutions used the close to reduce exposure rather than rebalance selectively, setting a cautious tone heading into the new year.


BTS Trading Levels - (Premium Only)

ES Levels
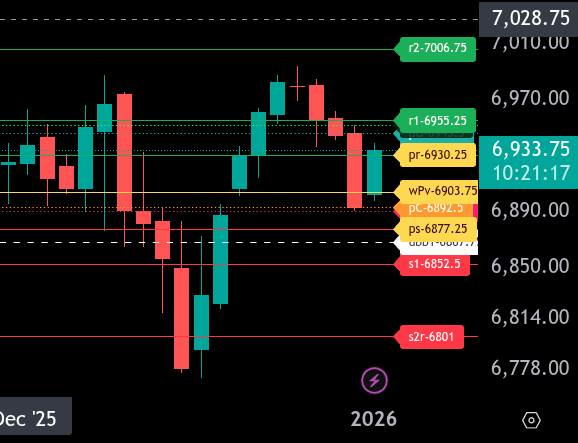
The bull/bear line for the ES is at 6903.75. This is the key pivot for today’s session. Acceptance above this level keeps buyers in control, while sustained trade below it favors sellers.
ES is currently trading around 6933.25, holding above the bull/bear line. As long as price remains above 6903.75, look for continuation higher toward 6945.50 and 6951.50. The upper intraday range target sits at 6930.25, and we are already trading above that pre-market. A clean push through that level would open the door for stronger upside momentum, but expect responsive sellers on the first test.
If ES fails to hold above 6903.75, downside pressure increases quickly. Initial support is at 6892.50, followed by the lower range target at 6877.25. A break below 6877.25 exposes 6852.50, with deeper downside risk toward 6801.00 if liquidation accelerates.
Overall, the bias remains bullish above 6903.75 and defensive below it. Trade location around the bull/bear line should dictate direction and risk today.
NQ Levels

The bull/bear line for the NQ is at 25,503.25, marked by wPv. This is the key pivot for today’s session. Acceptance above this level keeps the market in a repair-to-bullish posture, while failure below it puts pressure to the downside.
NQ is currently trading near 25,725.00, well above the bull/bear line after a sharp rebound. Immediate resistance sits at 25,716.75, followed by the upper range target at 25,754. A sustained hold above 25,716.75 opens the door for a push into 25,754, where sellers are likely to respond.
On the downside, first support is at 25,632.50. Below that, expect responsive buyers near 25,574. A break back below the bull/bear line at 25,503.25 shifts control back to sellers, targeting 25,456.75 and then 25,429. A deeper liquidation could extend toward 25,374, and the lower range target at 25,252.50.
Overall, ES remains constructive above 25,503.25, but upside progress depends on holding above 25,632.50 and reclaiming 25,716.75 with acceptance. Failure back below the bull/bear line would negate the rebound and reintroduce downside risk.
Technical Edge
Fair Values for January 2, 2026
SP: 43.89
NQ: 189.2
Dow: 246.63
Daily Breadth Data 📊
For Wednesday, December 31, 2025
• NYSE Breadth: 16.75% Upside Volume
• Nasdaq Breadth: 38.74% Upside Volume
• Total Breadth: 35.71% Upside Volume
• NYSE Advance/Decline: 25.60% Advance
• Nasdaq Advance/Decline: 32.67% Advance
• Total Advance/Decline: 30.08% Advance
• NYSE New Highs/New Lows: 34 / 40
• Nasdaq New Highs/New Lows: 53 / 278
• NYSE TRIN: 1.56
• Nasdaq TRIN: 0.75
Weekly Breadth Data 📈
Week Ending Friday, December 26, 2025
• NYSE Breadth: 58.04% Upside Volume
• Nasdaq Breadth: 50.29% Upside Volume
• Total Breadth: 52.98% Upside Volume
• NYSE Advance/Decline: 59.23% Advance
• Nasdaq Advance/Decline: 52.42% Advance
• Total Advance/Decline: 54.91% Advance
• NYSE New Highs/New Lows: 232 / 82
• Nasdaq New Highs/New Lows: 350 / 413
• NYSE TRIN: 1.00
• Nasdaq TRIN: 1.05
Calendars
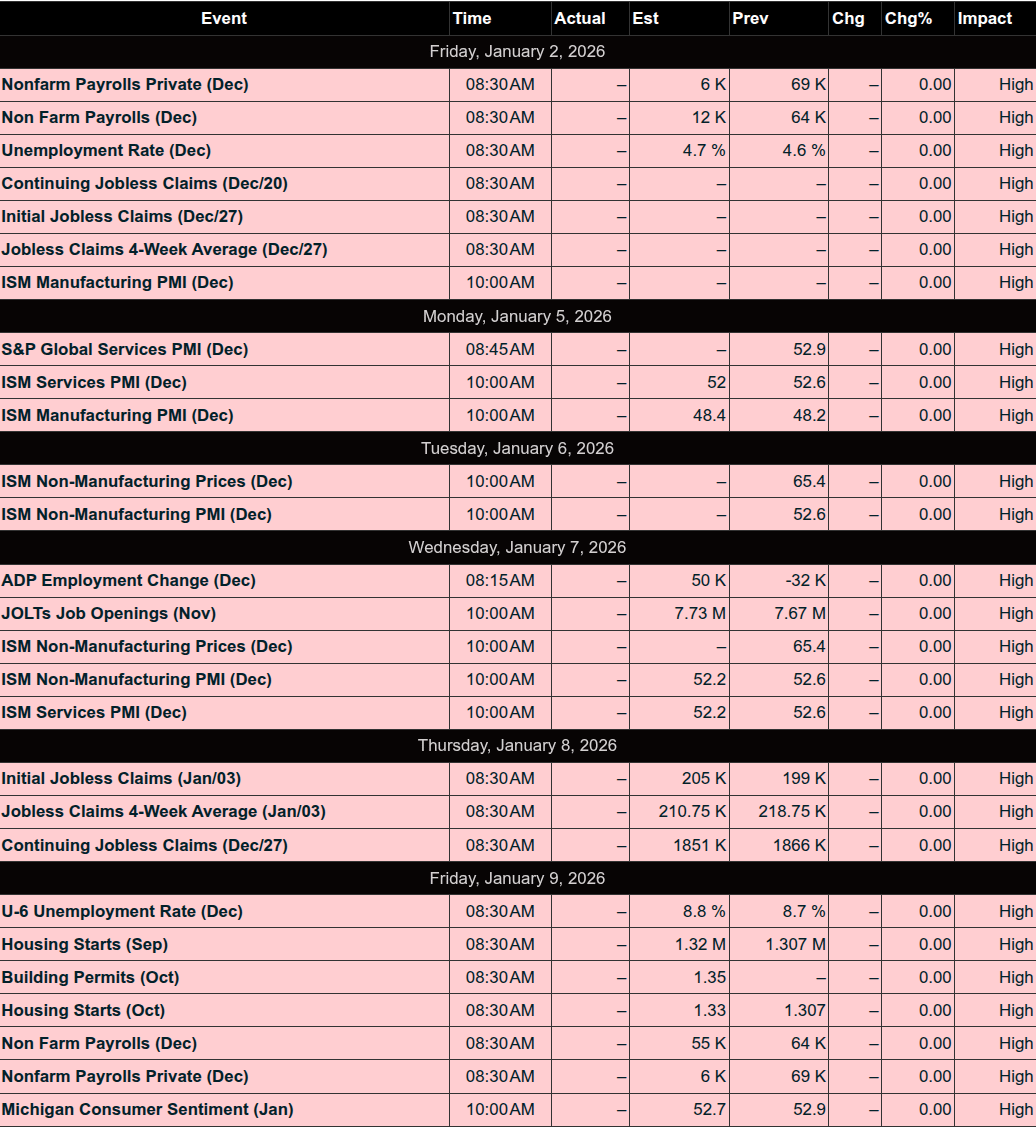
Economic Calendar Today

This Week’s High Importance
S&P 500 Earnings:
Upcoming:
None
Recent:
None
Trading Room News:
DTG Room Preview – Friday, January 2, 2026
Global Markets: Quiet start to the year with many global exchanges (including Japan and China) still closed for holidays.
2025 Recap:
S&P 500 finished 2025 up 16%
Nasdaq closed up over 20%
Early 2026 Themes:
Passive fund rebalancing may pressure 2025 high-flyers in the coming weeks
Santa Claus rally currently down 1% — two sessions remain to reverse the trend
Precious Metals:
Continued yo-yo volatility expected
Silver futures volume has shifted to SLV ETF options due to raised margin requirements
Earnings: No significant corporate earnings scheduled this week
Economic Data:
Light calendar today
Watch for S&P Global Manufacturing PMI at 9:45am ET
Market Conditions:
Last session of 2025 saw increased volatility on light volume
Expect continued light volume today, which may support volatility
Volume likely picks up next Monday
Whale Activity: No notable large trader positioning overnight
ES Technicals:
Holding within short-term uptrend channel
Channel resistance: 7098/03
Channel support: 6838/43
Loose support: 50-day MA at 6879
Additional TL levels:
Resistance: 7098/03, 7520/25
Support: 6838/43, 6630/25, 6320/15
5-day average daily range (ADR): 38.25 pts


Affiliate Disclosure: This newsletter may contain affiliate links, which means we may earn a commission if you click through and make a purchase. This comes at no additional cost to you and helps us continue providing valuable content. We only recommend products or services we genuinely believe in. Thank you for your support!
Disclaimer: Charts and analysis are for discussion and education purposes only. I am not a financial advisor, do not give financial advice and am not recommending the buying or selling of any security.
Remember: Not all setups will trigger. Not all setups will be profitable. Not all setups should be taken. These are simply the setups that I have put together for years on my own and what I watch as part of my own “game plan” coming into each day. Good luck!!
Follow @MrTopStep on Twitter and please share if you find our work valuable!