- The Opening Print
- Posts
- Two-Way Chop, Hot Rhetoric, and a Market That Wants Answers Before New Highs
Two-Way Chop, Hot Rhetoric, and a Market That Wants Answers Before New Highs
Follow @MrTopStep on Twitter and please share if you find our work valuable!
Our View
The clock is ticking on Trump’s pledge to intervene as Iran cracks down on protests over the protesters’ deaths. Iran has shut down all of its airspace. Lufthansa has instructed all staff to exit Israel and is cancelling all flights to and from the country starting today. Just about every country has issued simultaneous statements urging immediate evacuation from Iran.
The U.S. military is evacuating some troops and personnel from key Middle East bases, including Al-Udeid Air Base in Qatar, which hosts 10,000 troops. This is a precautionary move amid escalating tensions with Iran and the potential for strikes. Qatar has confirmed the repositioning, and the UK is also reducing its presence, echoing earlier actions, but limited to repositioning, while Trump weighs options.
Meanwhile, Russia's state-owned company Roszarubezhneft (which manages Russian oil assets in Venezuela) has said it will not leave the country, despite U.S. President Donald Trump claiming the U.S. will take control of Venezuela’s oil exports.
Our View
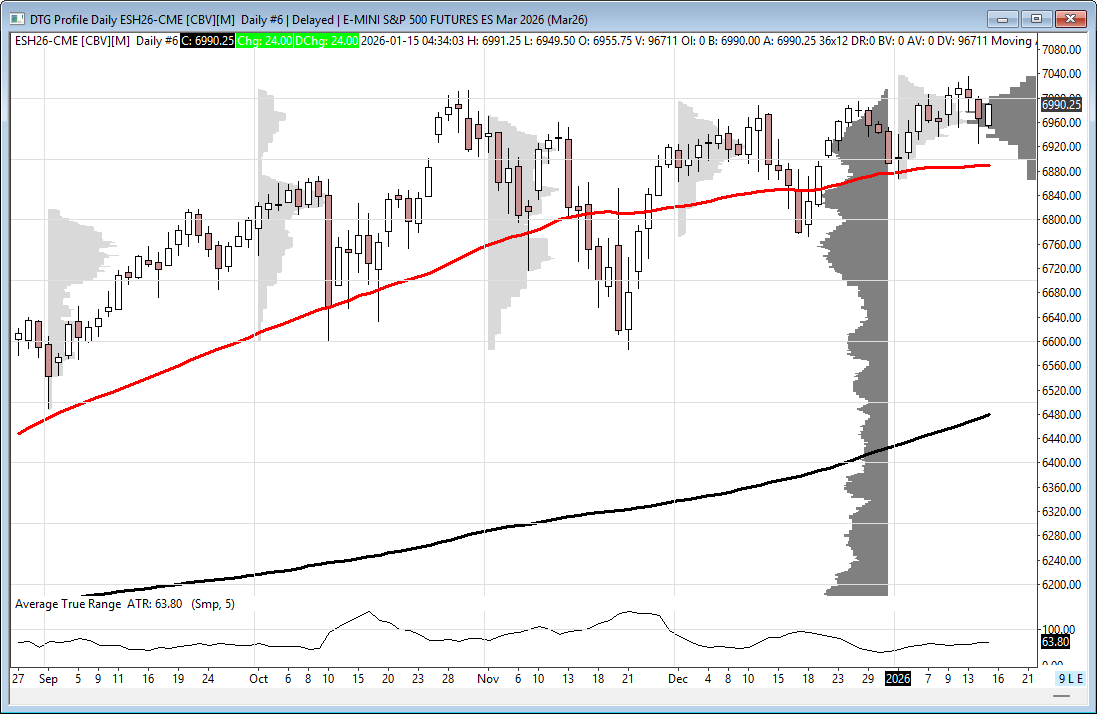
The ES and NQ did sell off and have yet to test the 6900 level. All I can say is that the tension surrounding the stock markets is the highest I’ve seen in quite a long time. I was asked by a former CME trader what I thought, and I told him the markets have to get past the uncertainties before moving up to new highs.
Other than that, I don’t have much else to say. It's a waiting game, and no one knows what the outcome will be.
Our Lean
Guest Posts:
DLC RISK MANAGEMENT January 2026 Newsletter
General Comments: It’s 2026 now…I hope everyone had a good holiday season. Global events don’t seem to be taking any time off. The situation in Venezuela, US military has captured Venezuelan President Maduro, and 5 sanctioned oil tankers have been seized by the US Special Forces. The US is filing warrants to seize dozens more Venezuela-linked oil tankers.. read more

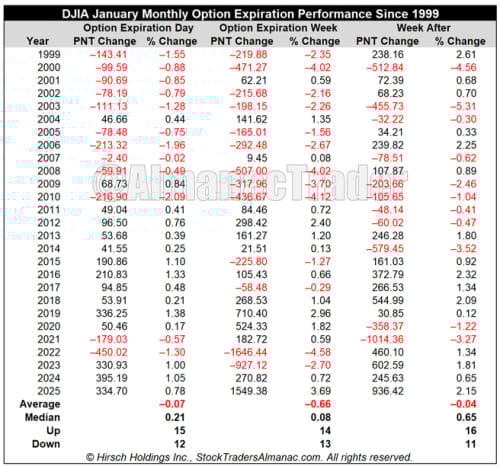
January Monthly OpEX Week Is Improving, Nasdaq Up 11 of Last 14

Over the past 27 years, since 1999, S&P 500’s performance during January’s option expiration week has been mixed. Friday has been up 15 and down 12, and the entire week has been down 16 times with an average weekly loss of 0.51%. DJIA’s record on Friday and the week after is similar to S&P 500. DJIA has performed modestly better during expiration week with 14 advances, but its average loss is larger at 0.66%. NASDAQ’s record matches DJIA, but average performance on Friday, during the full week and the week after is softer.
However, since 2011 or 2012, depending on index, full-week performance has improved. S&P 500 has advanced 9 times during the last 14 January option expiration weeks, with an average gain of 0.59%. DJIA has been up 11 times in the last 15 years, average gain of 0.47% and NASDAQ has been up 11 of the last 14 with an average 0.86% advance. Monthly OpEx Friday has also notably improved.


Market Recap:
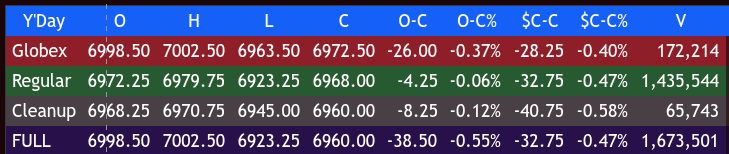
The ES traded down to 6963.50 on Globex and opened Wednesday's regular session at 6972.25, down 28.5 points or -0.41%. After the open, the ES traded up to 6979.50, then sold off to 6936.00 at 10:00. It rallied to a lower high at 6970.75 at 10:15, then sold off again to 6926.75 at 10:50.
The ES attempted another rally up to a lower high at 6957.00 at 11:30, then sold off to a new low at 6923.00 at 11:55. It bounced up to 6935.50, sold off to 6923.75 at 12:15, rallied to 6936.75 at 12:45, and dropped back to 6923.75 at 12:50.
From there, it rallied to 6940.50 at 1:30, then dropped to 6924.50 at 1:35, and climbed to 6959.75 at 3:05. It then sold off to 6944.50 at 3:15, before rallying to 6967.75 at 3:37.
The market then dumped down to 6949.50 at 3:49 when I posted this in the room:
IMPRO:Dboy:[3:49:36 PM]: bounce time
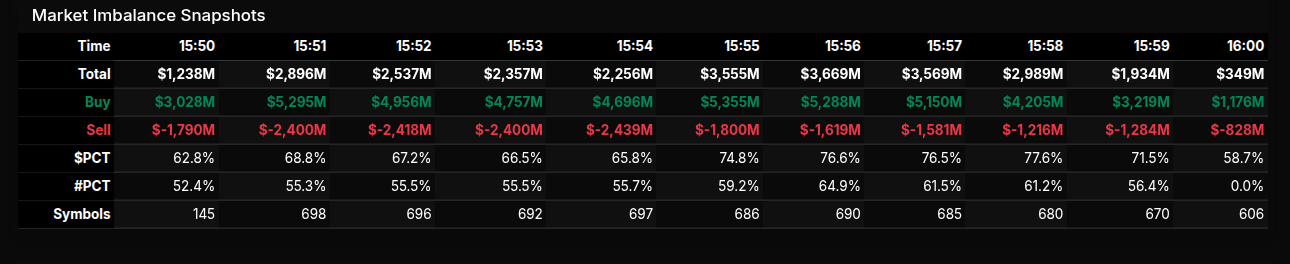
The ES traded 6950.00 as the 3:50 cash imbalance showed $3.4 billion to buy. It traded up to 6965.75 at 3:58 and hit 6968.00 on the 4:00 cash close.
After 4:00, the ES traded up to 6970.75, sold off to 6958.25 at 4:35, and then dropped to 6945.00 at 4:50 following a tweet reporting explosions in the Iranian capital, Tehran.
The ES settled at 6960.00, down 41.75 points or -0.60%. The NQ settled at 25,612.00, down 294 points or -1.31%. The YM settled at 49,304.00, down -0.21%, and the RTY settled at 2,660.60, up 12.8 points or +0.48% on the day.
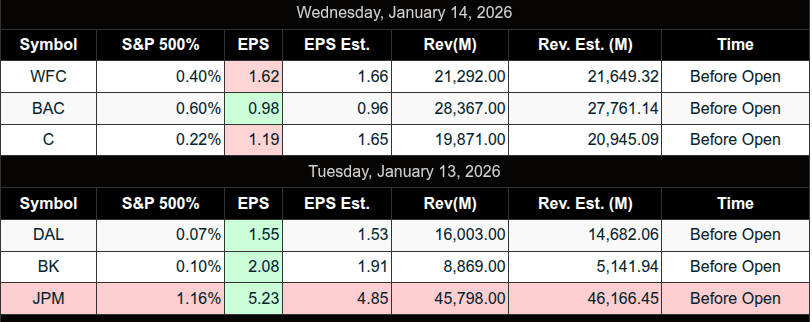
Adding to the selling pressure were bank earnings:
Bank of America (BAC) beat with EPS of $0.98 (vs. $0.96 expected) and revenue of $28.53B (vs. $27.94B), highlighting record results, but shares fell 3.8% to $52.48 on cautious 2026 NII guidance (5–7% growth) and expense concerns.
Citigroup (C) beat profit estimates, but shares closed down 3.4–4%
Wells Fargo (WFC) missed due to offsetting pressures, with shares dropping 4.6% amid a sector-wide sell-off and policy risk concerns.
In the end, early headlines pressured the ES and NQ lower, but both rallied late. In terms of the ES’s overall tone, it was weak but firmed up into the close. In terms of the ES’s overall trade, volume was higher at 1.67 million contracts traded—its largest jump since 12/18’s 2.17 million.
On Tap
8:30 AM – Initial Jobless Claims, Empire State Manufacturing Survey, Philadelphia Fed Manufacturing Survey
8:35 AM – Atlanta Fed President Raphael Bostic speaks
9:15 AM – Richmond Fed President Tom Barkin speaks
1:30 PM – Kansas City Fed President Jeff Schmid speaks
MiM
The market-on-close auction opened with a clear buy-side bias that strengthened quickly as institutional flow built across NYSE and S&P components. By 15:50 ET, net imbalance was already positive and expanded sharply into the 15:51–15:56 window, where total buy dollars consistently outpaced sell programs. The peak occurred around 15:56–15:57, with total imbalances north of $3.6B before moderating into the final minutes and collapsing to a small residual print at 16:00, a typical fade once paired volume cleared.
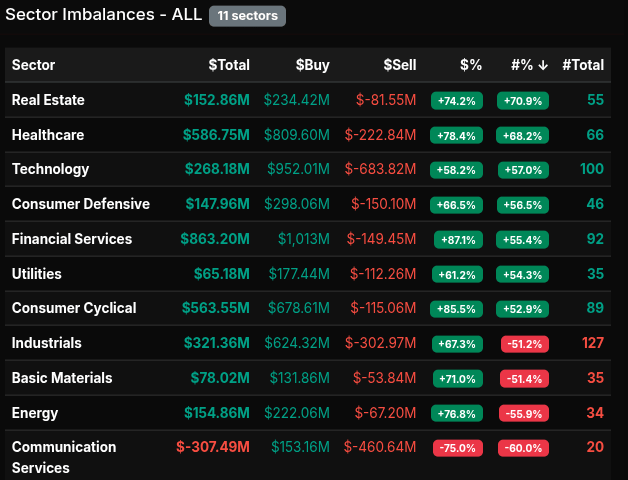
Sector participation was broad and decisive. Financial Services led in dollar terms with $863M net, showing an 87% buy skew—well above the 66% threshold that signals wholesale accumulation rather than rotation. Healthcare followed with $587M net and a 78% buy lean, reinforced by strong participation in large-cap names tied to devices, plans, and medical supplies. Technology added $268M net with a 58% buy skew, more rotational in character but still supportive, driven by heavy flows in mega-cap software and platforms.
Real Estate stood out with a 74% buy skew and a +71% symbol lean, signaling aggressive end-of-day positioning rather than index noise. Consumer Cyclical and Utilities both posted buy skews above 60%, confirming risk appetite remained intact into the close. In contrast, Communication Services was the lone pocket of meaningful pressure, finishing with a -75% sell skew and a -60% symbol lean, reflecting concentrated selling in internet and media names.
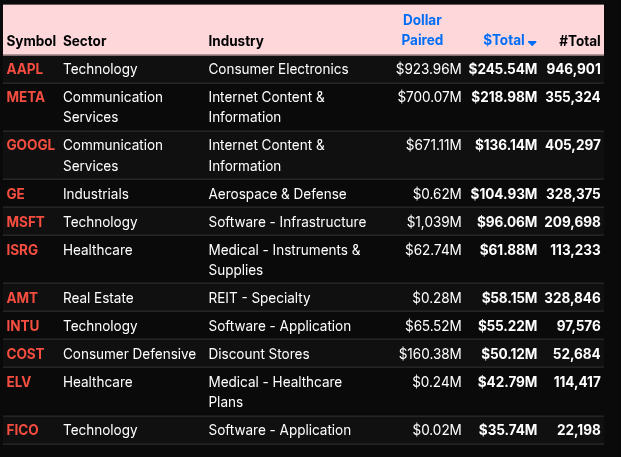
At the single-stock level, the auction was dominated by AAPL, META, GOOGL, MSFT, and JPM, all printing large paired dollar totals and anchoring sector strength. Industrials saw notable two-way action, with GE and CAT attracting size but leaning rotational near the 50% threshold.
Overall, the MOC profile reflected institutional accumulation rather than late-day hedging. The dominance of >66% buy skews across key sectors suggests conviction buying into the close, with only selective distribution in communication services tempering an otherwise constructive tape.


Technical Edge
Fair Values for January 15, 2026
S&P: 36.88
NQ: 157.76
Dow: 201.39
Daily Breadth Data 📊
For Wednesday, January 15, 2026
• NYSE Breadth: 63.8% Upside Volume
• Nasdaq Breadth: 69.6% Upside Volume
• Total Breadth: 69.0% Upside Volume
• NYSE Advance/Decline: 64.6% Advance
• Nasdaq Advance/Decline: 56.9% Advance
• Total Advance/Decline: 59.7% Advance
• NYSE New Highs/New Lows: 210 / 30
• Nasdaq New Highs/New Lows: 279 / 121
• NYSE TRIN: 1.03
• Nasdaq TRIN: 0.56
Weekly Breadth Data 📈
For the Week Ending Friday, January 9, 2026
• NYSE Breadth: 58.8% Upside Volume
• Nasdaq Breadth: 57.6% Upside Volume
• Total Breadth: 58.1% Upside Volume
• NYSE Advance/Decline: 73.6% Advance
• Nasdaq Advance/Decline: 71.6% Advance
• Total Advance/Decline: 72.3% Advance
• NYSE New Highs/New Lows: 414 / 89
• Nasdaq New Highs/New Lows: 701 / 246
• NYSE TRIN: 1.90
• Nasdaq TRIN: 1.81
S&P 500/NQ 100 BTS Trading Levels (Premium Only)
BTS are daily generated levels created using a combination of proprietary calculations and AI to define an upper range target and a lower range target, split by a bull/bear line. You receive daily charts along with clear descriptions of each level to help guide your trading.
Take a Free Premium Trial to see them in action.

Economic Calendar Today

This Week’s High Importance

Earnings:
Recent
Trading Room News:
PTG Room Summary – Wednesday, January 14, 2026
Yesterday’s trading session was a textbook example of disciplined execution and adherence to the plan laid out in the morning briefing. The market followed a strong bearish trajectory early on, fulfilling key downside targets with precision before finding support at major reversal zones. PTGDavid guided the room through both the downtrend and the bounce, with clear commentary and chart support throughout the session. While traders were on alert for a potential Supreme Court ruling on tariffs, it ultimately did not occur.
Market Action & Trade Highlights
Pre-Market Setup:
Manny and Chief shared early trade plans, charts, and economic context, including odds on a SCOTUS tariff decision and CPI/PPI data.
PTGDavid posted the Cycle Day 1 (CD1) outlook, clearly outlining:
Bear Case: Below 6975 with targets at 6965 → 6955 → 6950
Bull Case: Above 7000 with targets at 7010 → 7015 → 7020
Traders were cautioned to stay alert for the 10:00 AM Supreme Court ruling, which was anticipated to be a market-moving event—but no decision was released.
Execution & Results:
By 9:46 AM, the 6955 target had been tagged.
At 10:00 AM, all Bear Case targets were fulfilled, as price hit 6950—showcasing precise execution of the Daily Trade Strategy.
After the downside targets were met, price action reversed from the Dynamic D-Level (DLMB) zones, which offered a solid long opportunity.
By mid-morning, the market reached the CD1 Low Violation Target at 6924.51, marking a significant extension of the down move.
The DLMB zones then acted as effective support, and price reversed upward as called out by PTGDavid.
A mid-day rally attempt from the D-DLMB zone was well-anticipated, and the Upper DLMB Stop and Reversal zone was hit “perfectly,” as described by David.
By 1:30 PM, the Cycle Day 1 low projection targets were fully realized, confirming the power of the levels.
Wins & Lessons
Wins:
Bear Case targets fulfilled with precision—those who followed the plan saw strong results.
DLMB zones provided reliable trade setups, catching both the downside exhaustion and reversal.
PTGDavid’s real-time commentary and charts kept the room in sync with key market turns.
Lessons:
Trust the process: The trade plan and levels worked exactly as outlined in the DTS Briefing.
Stay ready for reversals: Even on directional days, the Dynamic Levels offered high-probability counter-trend setups.
News can be a wildcard: Despite high anticipation, the SCOTUS decision did not arrive. Traders were reminded to trade the chart, not the headline.
Room Sentiment & Collaboration
The room was active and supportive throughout the session.
Traders asked questions about tools, alerts, and technical setups (e.g., Fib tools, NinjaTrader features).
PTGDavid maintained strong communication, even walking through tech issues like audio setup.
Members highlighted unusual activity in VIX and the sharp afternoon decline in crude oil, contributing to broader market awareness.
Closing Bell:
The day wrapped with PTGDavid signaling the end at 4:00 PM. It was a highly productive trading day—targets were met, reversals were caught, and key levels held strong. The team stayed sharp, focused, and aligned with the strategy.
DTG Room Preview – Thursday, January 15, 2026
AI & Market Focus
Focus remains on the AI trade, corporate earnings, and economic data (Jobless Claims, Philly Fed, Empire State).
Supreme Court delayed ruling on Trump’s tariffs; key global trade decision remains pending.
AI Momentum
TSM beat estimates: $16B revenue, +35% YoY profit.
Plans to raise 2026 capex ~40% to $52–$56B for AI chip demand.
$165B pledged for U.S. plants; TSMC makes chips for NVDA & AAPL.
CEO confident in AI demand; NVDA, AAPL, MSFT, GOOGL all above $4T market cap.
Oil & Energy
Oil snapped 6-day, 11% rally after Trump said U.S. won’t intervene in Iran protests.
U.S. crude inventories up 3.4M barrels—biggest since early Nov.
~71 Venezuelan “dark fleet” tankers revealing positions post-Maduro capture.
Policy & Banks
Trump’s 10% credit card interest cap proposal opposed by JPM, C, BAC, WFC.
Banks warn caps could restrict credit and hurt low-income consumers.
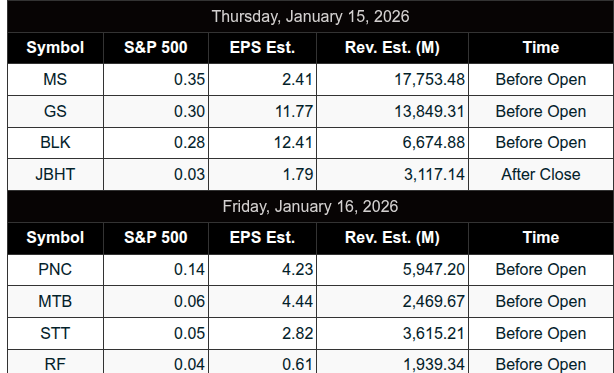
Earnings Watch
Premarket: INFY, BLK, MS, TSM, GS
After Close: JBHT
Friday AM: MTB, RF, STT, PNC, WIT
Economic Data & Fed Speakers
8:30 ET: Jobless Claims, Philly Fed, Empire State, Import Prices
Fed speakers: Bostic (8:35a), Barr (9:15a), Barkin (12:40p), Schmid (1:30p)
Volatility & Technicals
Vol expanded on Wednesday’s selloff and bounce.
ES 5-day avg daily range now 64 pts.
ES held 6903/09s (short-term uptrend); 7045/48s is resistance.
Key TLs:
Resistance: 7045/48s, 7159/64s, 7590/955s
Support: 6903/08s, 6495/90s, 6250/45s