- The Opening Print
- Posts
- Trump’s Iran Deal Shuffle Keeps the Tape Slippery. Non-Directional.
Trump’s Iran Deal Shuffle Keeps the Tape Slippery. Non-Directional.
Danny Riley
May 21, 2026
Follow @MrTopStep on Twitter and please share if you find our work valuable!

First off, despite the astonishing NVDA earnings beating expectations, it was a nothing-burger release, and I said I was worried that it would be a sell-the-news event. After the 5:00 close, the futures sold off, and after the 6:00 ET Globex open, the ES sold off down to 7407.50.
The other not-so-good part was that while Trump said the US and Iran were nearing a deal, a late headline hit saying that Trump and Netanyahu held a phone call and that Israel was worried a bad deal could derail strikes to further degrade the regime. Israel also expressed skepticism that Iran would abide by any agreement to dismantle its nuclear work and refrain from attacks on regional nations.
Netanyahu reiterated those points, and Trump is now “vowing” to attack Iran if they don’t come to an agreement fast. Bottom line: Trump is still doing the same thing he’s been doing for the last 7 weeks, saying there is a deal when there is no deal. This on-again, off-again BS is very destabilizing, but that said, I really believe Trump needs to get a deal done.


Our Lean is a premium feature available only to paid subscribers. It provides a daily pre-market look at how Danny is leaning into the trading day.
Take a Free Premium Trial to see this section in action.

Dan @ GTC Traders
Multi-Strats Assist in an Environment That is As Hard as It Gets
As the title of this article suggests? This environment is as difficult as it gets.
It is our belief that Interest Rates are in firm control of markets. As we have long outlined, we have arrived at that part of the cycle where interest rates have to adjust for the obvious higher inflation prints. One of which has already occurred, and more that are coming.
Equities markets are rallying on financial conditions … again … as we have long outlined … that are far too loose from a monetary policy standpoint.
The crack spread continues to run higher.
Again … as we have long outlined.
And we see that TED spreads are showing increasing credit stress …
AA Corporate Yield – Declared Overnight SOFR Yield
2020 to Present

At the same time, we are in asset bubble with valuations that are extremely stretched to the high side.
Again … as we …
Ok, I’ll spare you any more the vainglorious ‘as we have long outlined’ comments
We have a political narrative that seems to change every 12 hours.
Again, this environment? Nearly as tough as it gets.
The only way we are successfully navigating the macro landscape as of late is via our multi-strat portfolio.
An account that is dedicated to continually hold long positions, that we will beta weight the deltas of those assets to the SPY and hedge up at the first sign of trouble.

And on the other side of the spectrum? A separate account that … at least at the moment … is wholly dedicated to shorting the market at key times of stress, using a hybrid barbell strategy.

This is the advantage of running a multi-strat, where the very thesis of the strategies employed are non-correlated to one another. As long as we get our periodicity ‘shift’ right and execute well maintaining positive expectancy in both strategies … having an account dedicated to long positions, and a separate account dedicated to finding shorts positions?
That’s it. That’s the secret. That’s how we are printing as linear returns as we have been.
In addition … in an environment that is as difficult as it gets?
It’s allowing us to sleep very well at night. Anything can happen in the time that it takes for us to execute. But at the same time we don’t have to step away from the markets worrying about having one binary, directional position.
Until next time, stay safe, and trade well ...


I want to point out something: this is a 1-hour ES chart showing all the closes above 7400.00. While the ES did make new highs and we did sell off from last Friday to Tuesday, the ES has closed above 7400 on 7 of the last 10 sessions. I call that “back and fill.”

In other words, the ES really hasn’t gone anywhere...
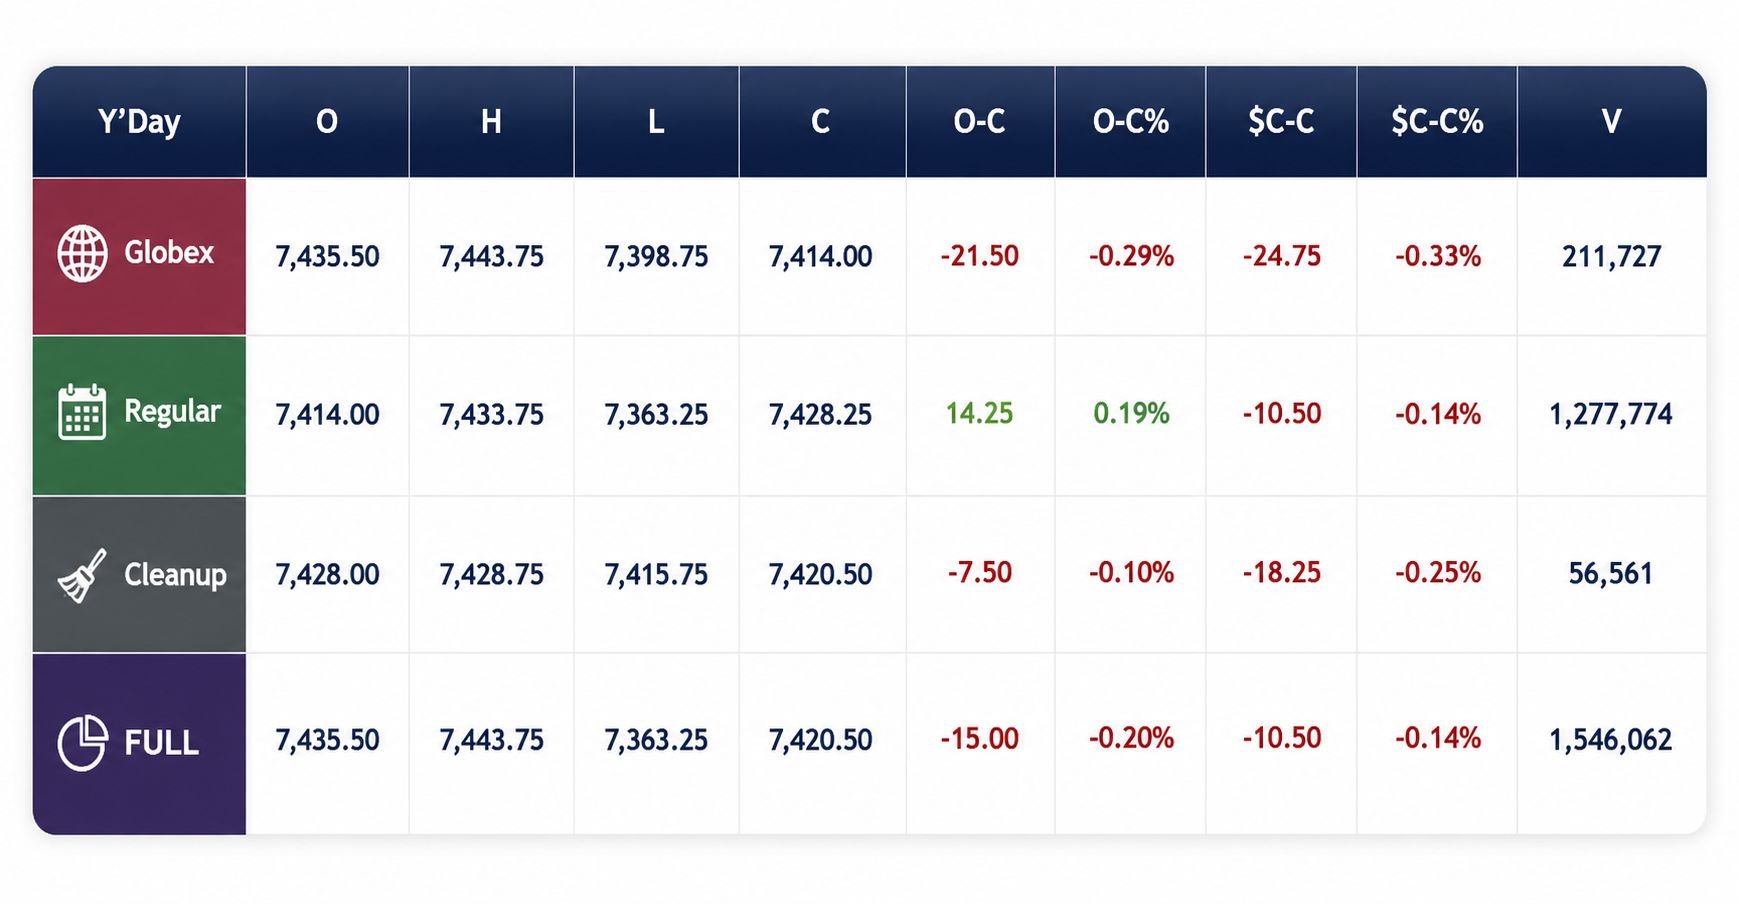
The ES had a 7363.75 low and a 7416.25 high with 230k contracts traded on Tuesday night’s Globex session and opened Wednesday at 7395.00, up 17.50 points or +0.24%.
After the open, the ES traded 7399.00, sold off 18.25 points down to 7380.75 at 9:35, rallied to 7410.50 at 9:45, and then sold off 33.75 points down to 7376.75 at 10:10. It then rallied 47.00 points up to a new high at 7423.75 at 10:15, sold off 20.50 points down to 7403.25 at 10:25, and rallied 25.50 points up to a new high at 7428.75 at 10:30.
After that, the ES pulled back to 7412.50 at 10:35, rallied 21.50 points up to 7434.00 at 11:00, pulled back 10 points down to 7424.50 at 11:05, and then rallied 33.50 points up to 7458.00 after this headline hit: TRUMP SAYS US IN “FINAL STAGES” OF TALKS WITH IRAN: POOL REPORT.
The ES then pulled back to 7430.00, rallied back up to 7448.50, sold off 24.75 points down to 7423.75 at 12:35, rallied up to 7439.00 at 12:45, pulled back to 7425.50, rallied 20.50 points up to 7446.00, pulled back to 7432.00 at 2:00, and then rallied up to 7447.25 at 2:35. It dropped 12.00 points down to 7435.25 at 2:46, slowly rallied back up to 7455.00 at 3:40, pulled back to 7448.75 at 3:48, and traded 7449.75 as the 3:50 cash imbalance showed $1.1 billion to sell. The ES traded 7444.50 and traded 7451.50 on the 4:00 cash close.
After 4:00, the ES traded up to 7452.00 and then sold off down to 7428.75 after NVIDIA beat earnings estimates: NVIDIA 1Q REV. $81.62B, EST. $79.19B, NVIDIA 1Q ADJ EPS $1.87, NVIDIA SEES 2Q REV. $89.18B. The ES then rallied back up to 7453.75, sold off down to 7428.50 at 3:20, rallied back up to a 7453.75 double top, and settled at 7451.75, up 73.75 points or +1.00%.
The NQ settled at 29,390.50, up 466.25 points or +1.66%. The YM settled at 50,094, up 635 points or +1.28%. The RTY, the big winner, settled at 2,821.00, up 67.80 points or +2.46% on the day.
In the end, I think yesterday’s Lean was right in that the ES and NQ would see higher prices, and the Trump headline was the kicker. In terms of the ES’s overall tone, all the dips were bought. In terms of the ES’s overall trade, volume was steady but not high: 230k traded on Globex and 1.3 million traded on the day session for a total of 1.53 million contracts traded.
If you are looking for a perfect newsletter to read, this probably isn’t for you. The PitBull pays “thousands of dollars” a month for over 8 newsletters, and I can assure you, those are far from perfect. One, a few months ago when the ES fell over 100 points, was warning of an imminent “meltdown.” Another called it a “flash crash,” and by the end of the day, the ES was 15 points higher.
When I wrote the LEAN Tuesday night, I said I thought the ES and NQ could go higher. Did I read that in some newsletter or some news headline? No. I based it on the number of down days the ES and NQ get when they pull back or sell off. We don’t see many 2-day sell-offs, and while there are a few 3-day pullbacks, 4- and 5-day pullbacks are few and far between.
I also thought the bonds could bounce and wrote that I thought that the US/Trump administration was looking for a way out and was considering unlocking some Iranian funds in foreign banks.

MiM

The May 20th MOC session developed into a sharp late-day sell imbalance before stabilizing into the close, with heavy institutional rotation underneath the surface. At 15:51, the market showed a steep $1.07B sell imbalance, driven by $3.72B for sale against $2.65B to buy. The opening pressure leaned heavily bearish with a dollar lean of -58.4%, while symbol breadth still favored buyers at +53.5%, signaling a split tape where many names were bid, but larger institutional money was concentrated on the sell side.
The imbalance trajectory improved materially after 15:53. By 15:54, the market flipped to a strong $1.29B buy imbalance as buy programs accelerated to $3.77B versus $2.47B for sale. Momentum remained constructive through 15:57, peaking near $1.69B to buy before fading into the bell. The final print settled around a modest $360M buy imbalance at 16:01, showing meaningful recovery from the earlier sell-side pressure.
Sector flows revealed aggressive defensive accumulation alongside cyclical liquidation. Consumer Staples posted one of the strongest buy-side leans at +77.5%, while Real Estate followed closely at +76.2%. Health Care also attracted major institutional demand with +66.9%, right on the threshold of wholesale-style buying. These readings suggest managers rotated capital into lower-beta defensive exposure late in the session.
On the sell side, Communication Services collapsed to a -90.0% lean, an extremely one-sided institutional sell program. Industrials also experienced heavy liquidation at -80.7%, while Utilities surprisingly leaned -68.8% despite broad defensive buying elsewhere. Consumer Discretionary printed -67.0%, indicating notable risk-off rotation from growth and consumer exposure.
Single stock activity highlighted intense two-way institutional flows. AMD led buyers with $328.27M, followed by GOOGL at $286.62M and CAT at $135.44M. Additional accumulation appeared in TSLA, META, MU, and JPM. Meanwhile, AAPL drew $208.79M on the sell side alongside INTC, LLY, MSFT, and UNH. The semiconductor space showed particularly rotational behavior, with AMD and MU heavily bid while NVDA and INTC experienced offsetting pressure, keeping Information Technology near neutral overall at +50.1%, a classic rotational reading rather than outright accumulation.


Live today at 9AM:


Fair Values for May 21, 2026
S&P: 19.88
NQ: 91.24
Dow: 78.81
Daily Breadth Data 📊
For Wednesday, May 20, 2026
• NYSE Breadth: 72% Upside Volume
• Nasdaq Breadth: 74% Upside Volume
• Total Breadth: 74% Upside Volume
• NYSE Advance/Decline: 76% Advance
• Nasdaq Advance/Decline: 75% Advance
• Total Advance/Decline: 75% Advance
• NYSE New Highs/New Lows: 89 / 73
• Nasdaq New Highs/New Lows: 160 / 172
• NYSE TRIN: 1.24
• Nasdaq TRIN: 1.05
Weekly Breadth Data 📈
For the Week Ending Friday, May 15, 2026
• NYSE Breadth: 43% Upside Volume
• Nasdaq Breadth: 51% Upside Volume
• Total Breadth: 48% Upside Volume
• NYSE Advance/Decline: 26% Advance
• Nasdaq Advance/Decline: 31% Advance
• Total Advance/Decline: 30% Advance
• NYSE New Highs/New Lows: 285 / 214
• Nasdaq New Highs/New Lows: 745 / 521
• NYSE TRIN: 0.47
• Nasdaq TRIN: 0.45
S&P 500/NQ 100 BTS Trading Levels (Premium Only)
BTS are daily generated levels created using a combination of proprietary calculations and AI to define an upper range target and a lower range target, split by a bull/bear line. You receive daily charts along with clear descriptions of each level to help guide your trading.

Take a Free Premium Trial to see them in action.


Today’s Economic Calendar

Earnings:


PTG Room Summary – For Wednesday, May 20, 2026
Wednesday’s PTG session was a constructive bullish day, with David emphasizing that DTS levels were respected early and Cycle Day 1 structure favored upside continuation.
Trade Plan
Overnight price fulfilled both upside and downside DTS objectives.
David noted the initial Cycle Day 1 bias was bullish after prior downside objectives had already been tested.
Market Focus
Nvidia earnings after the close were a major catalyst to watch.
Tech leadership and post-close volatility remained key themes.
Positive Trade Highlights
David identified upside targets, including the prior high near 7440.
A D-Level triggered later in the morning, and the first target was fulfilled.
Closing Action
Price held above prior highs into the close and pushed toward the 7455 Cycle Day 1 penetration target.
A $1.1B MOC sell imbalance was quickly absorbed, showing underlying strength.
Lessons Learned
Trust the DTS levels.
Respect Cycle Day structure.
Watch how price reacts to order-flow events instead of reacting emotionally.
DTG Room Preview – Thursday, May 21, 2026
Macro Focus
Futures are softer across the board, pointing to a cautious open.
VIX is flat near 17.44, showing elevated but controlled volatility.
Oil is rebounding on geopolitical risk, while gold is lower.
Geopolitical Update
Iran’s retaliation threat is keeping Middle East risk elevated.
Crude strength may support early rotation into energy and defense-linked names.
AI / Tech Drivers
NVDA remains the key market driver after earnings reinforced the AI capex cycle.
Alphabet’s $15B data center investment and Samsung’s labor deal support the semi and AI hardware outlook.
SpaceX’s S-1 filing is boosting aerospace, satellite, and AI-adjacent sentiment.
Today’s Calendar
8:30 AM ET: Philly Fed, Jobless Claims, Building Permits, Housing Starts.
9:45 AM ET: Flash Manufacturing & Services PMIs.
12:20 PM ET: Richmond Fed President Barkin speaks.
Earnings: DE, NIO, NTES, RL, WMT premarket; ROST, DECK, TTWO, WDAY, ZM after close.
ES Outlook
ES is testing the lower end of its short-term uptrend channel near 7360/65.
Bulls need to defend this zone to keep the short-term uptrend intact.
A break below could shift short-term momentum bearish.
Upside trendline resistance sits near 7513/18.
Key Levels
Resistance: 7513/18, 7780/85.
Support: 7360/65, 7253/58.

