- The Opening Print
- Posts
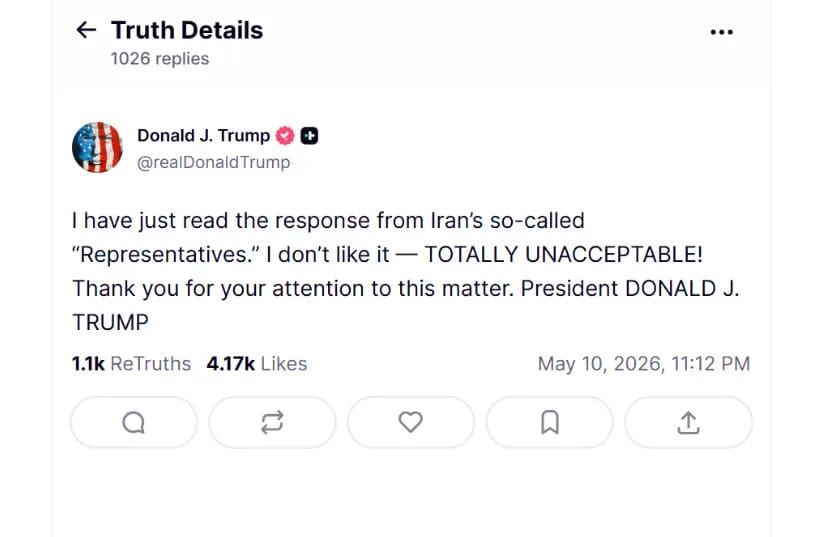
- Trump Heads to China, Powell Heads Out the Door — And the ES Keeps Getting Bought
Trump Heads to China, Powell Heads Out the Door — And the ES Keeps Getting Bought
Danny Riley
May 11, 2026
Follow @MrTopStep on Twitter and please share if you find our work valuable!

You better get your game face on because the week ahead is filled with potential landmines. I’m not sure I have ever seen a week this loaded up.
THE WEEK AHEAD | MAY 11–15, 2026
TOP MARKET DRIVERS
• Inflation & War: Tuesday’s CPI report may reveal early Iran conflict inflation impacts.
• U.S.–China Summit: Trump heads to Beijing Thursday for talks with Xi Jinping on tariffs and stability.
• Fed Transition: Jerome Powell’s term ends Friday; Kevin Warsh expected to succeed him.
━━━━━━━━━━━━━━━━━━
MONDAY • MAY 11
• Existing Home Sales, China CPI
• Constellation Energy, Fox Corp, Circle, Hims & Hers, Simon Property, iHeartMedia
TUESDAY • MAY 12
• CPI — 8:30 AM ET
• JBS, Under Armour, Vodafone, Aramark, Franco-Nevada
• Austan Goolsbee speaks
WEDNESDAY • MAY 13
• PPI Inflation Report
• Alibaba, Cisco, StubHub, USA Rare Earth, Nebius, Birkenstock
• Neel Kashkari, Lorie Logan speak
THURSDAY • MAY 14
• Trump arrives in Beijing; Israel–Lebanon talks resume
• Musk vs. OpenAI closing arguments begin
• Cerebras IPO (CBRS)
• Retail Sales, Jobless Claims, U.K. GDP
FRIDAY • MAY 15
• Powell officially exits as Fed Chair
• Industrial Production, Capacity Utilization
• Mizuho Financial, Mitsubishi UFJ Financial
MARKET FOCUS
• CPI & PPI inflation data
• U.S.–China summit headlines
• Fed leadership transition
• Retail Sales strength
• AI IPO momentum (CBRS)
I continue to ask myself: when was the last time the markets rallied this much? The current stock market rally is one of the strongest short-term advances in modern history, drawing comparisons to major rebounds seen in April 2009, after the Global Financial Crisis, and March–April 2020, following the COVID crash.
The Nasdaq has posted its biggest six-week gain since 2009, while the S&P 500 surged more than 10% in just 11 trading sessions — a rare momentum burst that has occurred only a small number of times since the 1960s. Analysts are describing the move as one of the fastest V-shaped recoveries since 2020, fueled by a combination of AI-driven enthusiasm, easing geopolitical fears, expectations for Fed policy shifts, and aggressive short covering.
Unlike broader historical bull market rallies, much of the current advance has been concentrated in semiconductors, AI infrastructure, and mega-cap technology stocks, giving the market a momentum profile similar to periods seen during the 1999 dot-com boom and the 2020 AI and cloud-computing surge.
As I have always said, we live in an ever-changing world, and the week ahead will definitely be part of it!
Things That Go “BOOM”
Jamie Dimon and Gary Shilling both foresee a 20%–30% crash due to overvaluation and a weak consumer base. Paul Tudor Jones compares the current climate to the 1999 bubble, warning that a major bear market is imminent, and Michael Burry remains skeptical of speculative AI hype, maintaining the same caution that signaled the 2008 crisis.
Can they all be wrong? So far they are, and as I have always said, picking a top is one of the hardest trades to make.
As I said above, this week is loaded up, and I think the big one is Trump in China. I doubt China is going to roll out the welcome mat after he blockaded the Strait of Hormuz and the administration escalated economic pressure on China by targeting key military and energy links.
The administration is also placing sanctions on 11 entities and three individuals for providing satellite imagery and missile components to foreign procurement networks. Furthermore, five Chinese petrochemical companies were added to the SDN List for their involvement in Iranian oil transactions, further tightening restrictions on China’s international trade. It’s going to be a head-banger.
It’s going to be headline hell this week. I still think the markets can go higher, but after 6 weeks of gains and no 1% pullbacks, and with retail investors buying $2.6 trillion in S&P call options on Wednesday, I think there is reason to be concerned. But I also want to point out that the MrTopStep imbalance meter bought $4.4 billion on Friday, and nearly $10 billion was bought in the last week.
10 weeks into the war, and what we know is that Trump is always saying there is a deal or one’s coming. The other thing we know is that both the U.S. and Iran agree to disagree.
Our View
The Iranians are emboldened and know Trump will be in China this week. My own opinion is that China is not happy with Trump and will continue to support Iran.
Trump told the French news outlet Agence France-Presse last week that he believed China played a part in encouraging Iran to agree to this week’s temporary truce. We know Trump will seek China’s help in ending the war and AI, and creating a new Board of Trade to keep their countries talking on economic issues, as well as talking up key industries like energy, aerospace, and agriculture, but he could get a chilly reception.
The PitBull said he can’t believe that with crude up $4.00 and the ES isn’t down more, but I think this goes with how Globex drops work; they get bought.

Israeli Prime Minister Benjamin Netanyahu said the Iran war is “not over” in an interview that aired on Sunday. With an overload of economic reports, Fed speak, and earnings, plus Trump’s China trade, I think we could see a pickup in volatility, with the VIX down to 17.72 on Friday, and a big lack of pullbacks.
Our lean: This week, I think we could see some larger two-way trade, especially if crude oil starts trading back above $100.00.
Claude ES Market Profile Levels:
Resistance Levels Above 7,419.00
• 7,515.67 — [3-Day] Fibonacci Projection: VAH + 1.618 extension of the Value Area range.
• 7,510.25 — [2-Week] Measured Move: VAH + 100% of the Value Area width.
• 7,504.38 — [Weekly] Extension: VAH + 0.5x Value Area width.
• 7,496.25 — [Session] Range Extension: VAH + 1.5x Value Area width.
• 7,476.00 — [3-Day] VAH + 1.0x VA Width: Major structural breakout target.
• 7,464.25 — [Session] VAH + 1.0x VA Width.
• 7,440.25 — IB Extension 2x: Twice the initial balance range; often an exhaustion point.
• 7,432.25 — [Session] VAH + 0.5x VA Width.
• 7,427.75 — [Weekly] VAH: The primary ceiling for the current trend.
Support Levels Below 7,419.00
• 7,410.50 — [3-Day] VAH: Immediate support floor.
• 7,400.25 — [Session] VAH: Friday's high-value boundary and opening range.
• 7,393.00 — [Monthly] VAH: Long-term value ceiling turned support.
• 7,377.75 — [3-Day] VA Midpoint: Center of recent fair value.
• 7,370.62 — Major HVN, High Volume Node: Confluence of 3-Day, Weekly, and 2-Week ranges.
• 7,360.00 — IB Extension High, 1xIB: First-hour range expansion.
• 7,351.12 — [Weekly] VA Midpoint.
• 7,345.50 — [3-Day] POC / VPOC: Significant magnet; the “fairest” price of the last three days.
• 7,336.25 — Session Low: Buying excess tail.
• 7,300.00 — Psychological Floor: Base of the current breakout move.

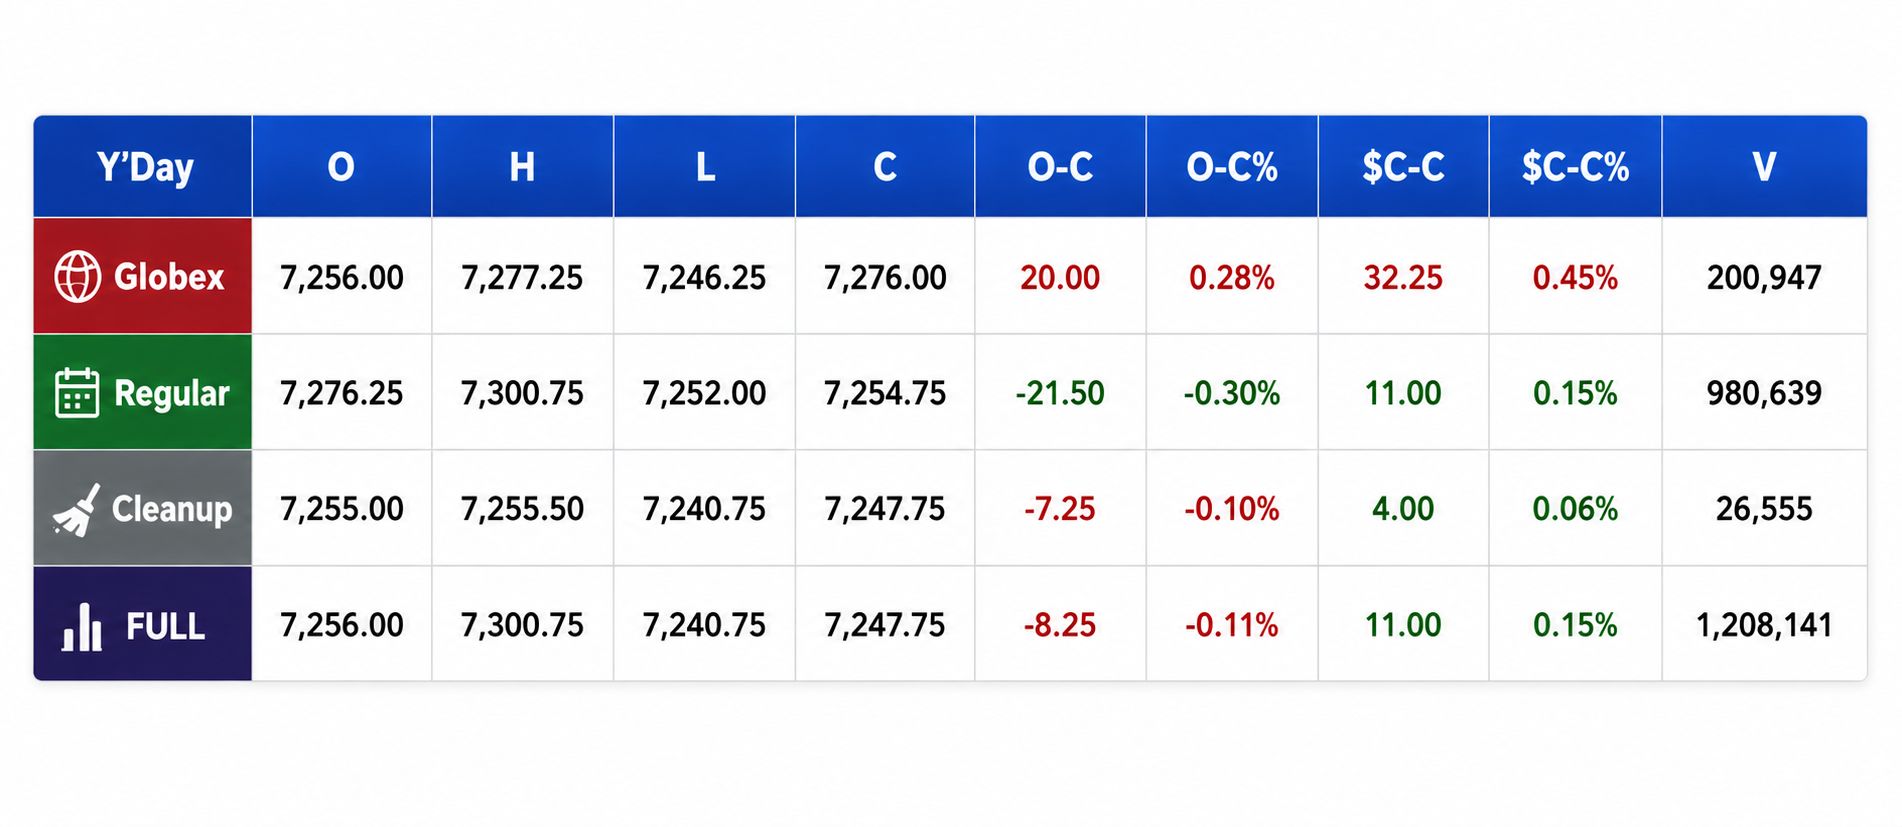
Another day and another high! The ES made a low of 7336.25 on Globex, rallied up to 7421.50, and opened Friday's regular session at 7400.00, up 31.50 points, or +0.43%.
After the open, the ES traded 7391.75 and then made 9 higher highs up to 7427.75 at 10:26, pulled back to 7408.25 at 10:35, traded back up to 7422.00, and then pulled back to 7407.25 at 11:15. From there, the ES did a sideways-to-up back-and-fill up to 7424.25 at 12:25, pulled back to 7414.75, did another sideways-to-up back-and-fill, and traded up to a new high at 7426.00 at 1:35.
The ES pulled back to 7417.50 at 1:50, rallied up to another new high at 7427.75 at 2:00, pulled back, traded 7426.75, sold off 19.75 points down to the VWAP at 7408.00 at 2:55, and fell into another slow, sideways-to-up back-and-fill up to 7421.50 at 3:45. The ES traded 7418.25 as the 3:50 cash imbalance showed $4.4 billion to buy and traded 7421.00 on the 4:00 cash close. After 4:00, the ES traded 7425.00 and flatlined in a 3- to 4-point range before settling at 7419.00, up 56 points, or +0.76%.
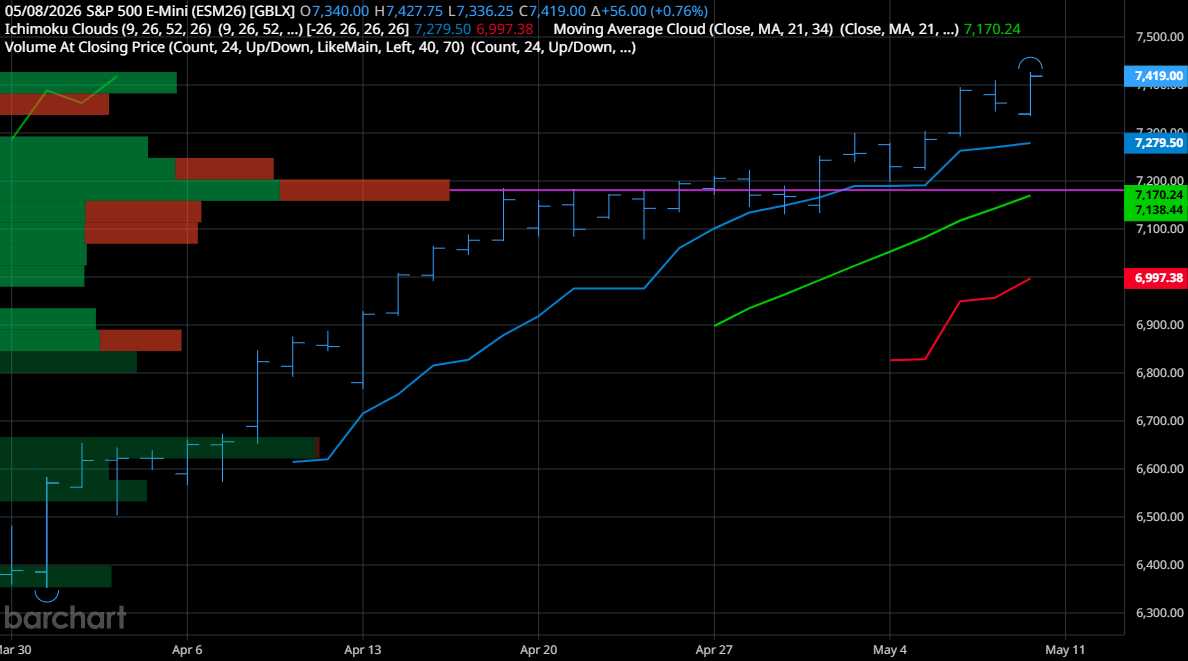
Since the 03/31/26 ES low at 6353.25, there have been 28 trading days: 19 up / 8 down / 1 unchanged, for a total gain of 848.25 points, or +12.91%.
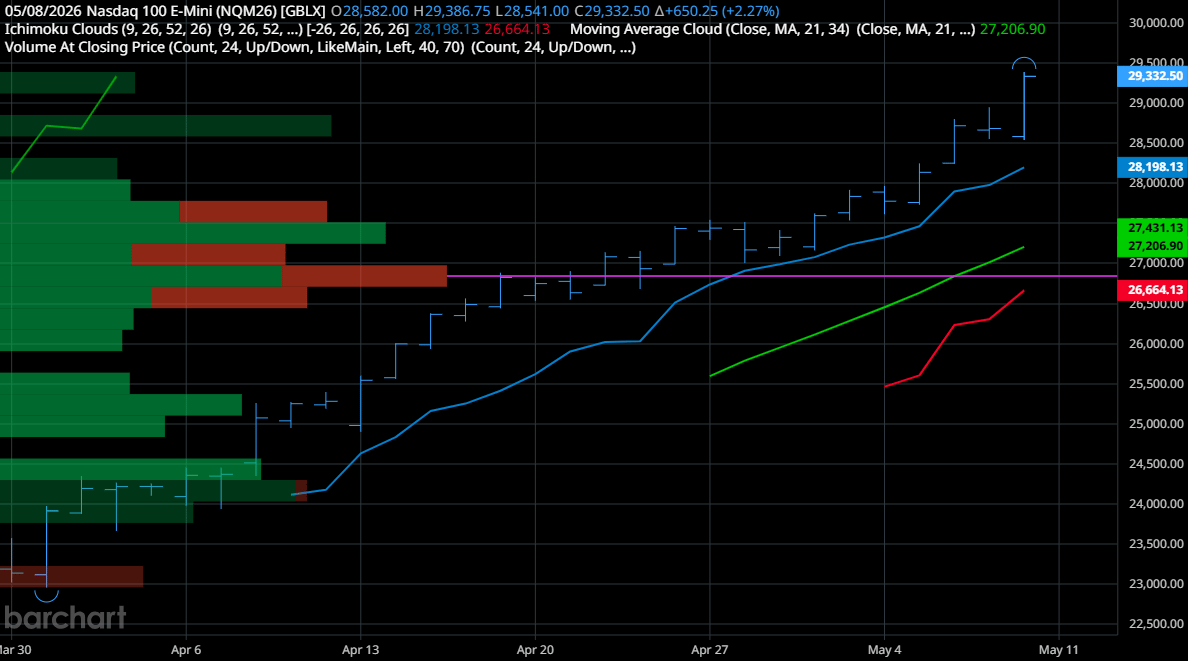
The NQM26 settled at 29,332.50, up 650.25 points, or +2.27%. Since its 03/31/26 low, there have been a total of 28 trading days: up 20 / down 7 / 1 unchanged, for a total gain of 5,417.50 points, or +22.65%.
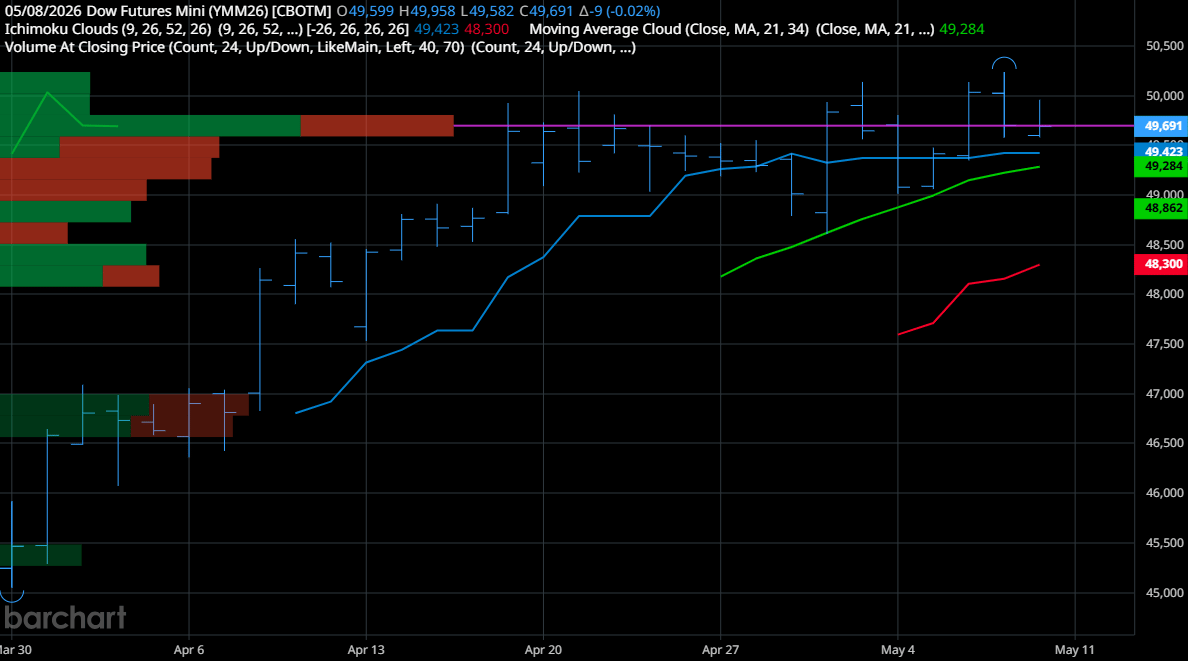
YMM26 settled at 49,691, down 9 points, or -0.02%. Since its 03/31/26 45,287 low, there have been a total of 28 trading days: up 12 / down 15 / 1 unchanged, for a gain of 3,109 points, or +6.67%.
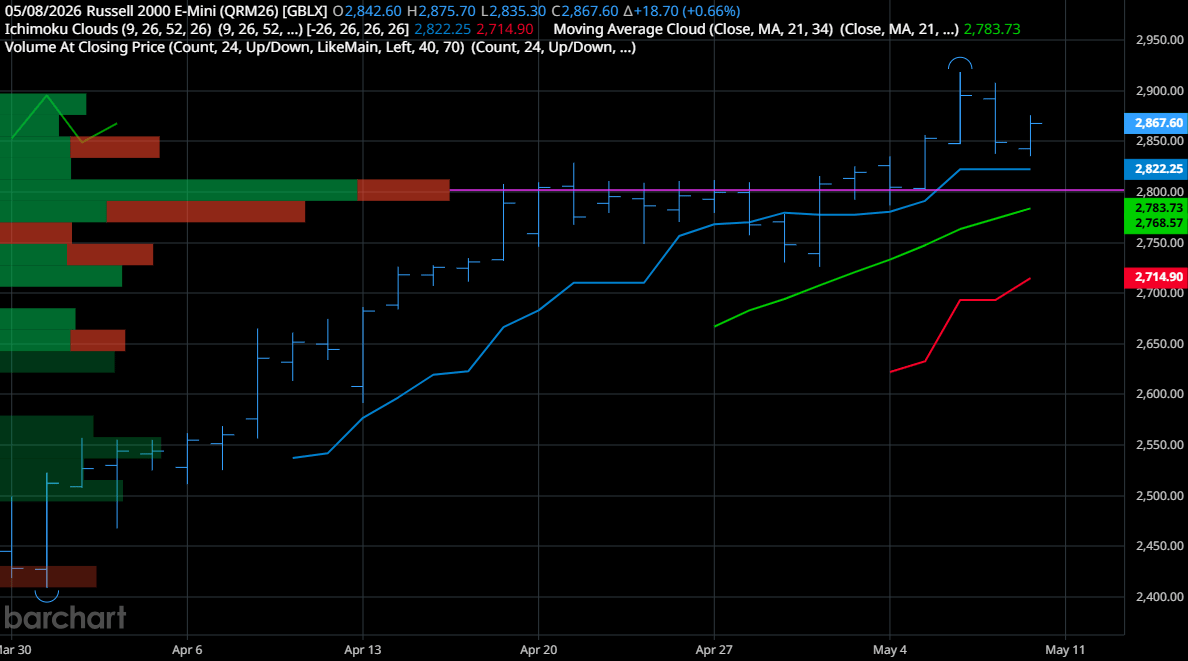
RTYM26 settled at 2,867.60, up 18.70 points, or +0.66%. Since its 03/31/26 low at 2,409.40, there have been 28 sessions: up 19 / down 8 / 1 unchanged, for a total gain of 355.40 points, or +14.15%.
In the end, it was another up day on a list of many, with the NQ leading the ES higher. In terms of the ES's overall tone, it was firm all day. In terms of the ES's overall trade, volume was higher at 1.753 million contracts traded, the highest in 11 sessions.
It was a one-two punch for the markets: a higher jobs number and INTL surging 15% after the chip maker struck a deal with Apple to make some chips that power its devices. The Nasdaq closed up 1.7% to a new record close and set its 11th new high in 2026, up 4.5% on the week. The S&P gained 0.8% and closed at a new record high, up 2.3% on the week, with both indexes continuing their record run, up 6 weeks in a row.


Goldman Sachs

Market history suggests that US equities will make more record highs in the months ahead, says Brian Garrett, head of equity execution on the Cross Asset Sales desk in Global Banking & Markets.
After a massive rebound in the past six weeks—which saw the S&P 500 recoup all of its March losses and then some—a key question is whether US stocks are likely to cool off.
Garrett says these concerns are reasonable. He points out that “investor sentiment has gone from quite negative to extremely positive” in a short length of time—which could suggest that there is now a lack of potential buyers.
Indeed, after the S&P 500 makes new all-time highs, returns over the next month do tend to be below average.
Manny - @manny_trends
Sell in May?
Before we begin, all levels referenced below are SPX cash levels, not ES futures.
“Sell in May and go away.”
Most years it’s just a cliché traders throw around when the market gets extended.
This year?
It might deserve a closer look.
The Setup Under the Surface
Here’s what has my attention right now:
DIX = 43%
GEX = $21B
That combination tells me the market is entering a pretty dangerous setup.
Why?
Because dealers are not fully participating in this move.
This rally has been driven more by:
• Gamma squeeze dynamics
• CTA repositioning
• Delta neutralization
Than true aggressive accumulation.
That matters.
Because squeezes can keep going much longer than people expect… until suddenly they don’t.
The Market Keeps Squeezing Higher
The book this week actually looks very similar to last week.
Which means another push higher is still possible.
Especially if the market can:
• Hold above SPX 7400
• Break through SPX 7420
If that happens, the squeeze likely continues.
And in this environment, once dealers start chasing deltas, price can move quickly.
But the other side of the trade matters just as much.
Because if SPX 7400 rejects, the downside opens fast.
And that likely brings SPX 7320 into play, which is where the real decision gets made.
The Strange Part of This Rally
Normally when markets rally…
Volatility falls.
That’s not what we’re seeing.
Right now we have a setup where:
The market is moving higher while volatility remains in demand.
That’s not healthy trend behavior.
That’s gamma squeeze behavior.
Premium continues getting bid for downside protection, while upside premium is becoming increasingly limited.
Calls are expensive.
And unless the market starts moving toward SPX 7500+, particularly the 8000 strike region, there’s simply not much premium left in the upside calls.
That tells you this move is becoming stretched.
Distribution Is Still Showing Up
This is the part traders need to respect.
Flow still suggests distribution.
And remember:
Markets are not driven by news.
News comes after positioning shifts.
Dealers know first.
Headlines show up later.
That’s why I keep saying this month’s focus is simple:
Sell high.
Not because the market can’t squeeze further…
But because the structure underneath the move continues to suggest liquidity is being used to distribute, not accumulate.
The DIX Divergence
One thing that stood out was the discrepancy between DIX and SPX movement.
DIX moved nearly 2% higher.
That’s significant.
Why?
Because CTAs holding negative delta exposure were forced to neutralize.
That created additional upside gamma pressure.
In simple terms:
The squeeze fed on itself.
That’s why price action has felt so relentless despite growing concerns underneath the surface.
The Bigger Picture
This is the kind of market that frustrates everyone.
Bears get squeezed.
Late longs chase highs.
Volatility stays elevated.
And price keeps moving in ways that feel irrational.
But there is logic underneath it.
Flow.
Positioning.
Gamma.
That’s the real driver right now.
Not headlines.
Not narratives.
The Bottom Line
This market still has fuel for another squeeze.
But the setup is becoming increasingly unstable.
Above SPX 7420, momentum can continue.
Below SPX 7400, things can unravel quickly.
And with volatility still being aggressively bid, traders need to stay aware that this environment can change fast.
So stay tactical.
Because this is no longer a clean trend market.
This is a positioning market.
And positioning cuts both ways.
If this bigger picture is the map, my daily setups are the execution plan. I post them each morning on my X feed, @manny_trends, where I share the levels and structure I am watching for the day ahead.
Manny Payano
@manny_trends


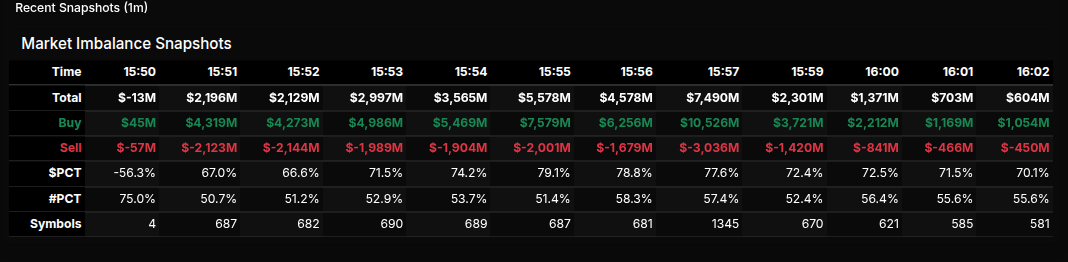
The MOC opened with a strong buy tone and never really gave sellers control. At 15:50, a $2.196B net buy imbalance was revealed. From there, the closing book expanded steadily, peaking at 15:55 with $5.578B net to buy, driven by $7.579B in buy demand against $2.001B for sale. After that peak, the imbalance began to unwind but stayed firmly buy-sided into the close, finishing near $1.371B at 16:00 and still above $600M by 16:02.
The key takeaway was wholesale buy demand. The all-market dollar lean finished at +67.0%, while the S&P 500 showed +67.7%, and Nasdaq was even stronger at +87.0%. Those readings above +66% are notable because they suggest broad institutional buy interest rather than simple rotation. Nasdaq was the standout, with $2.34B to buy versus only $351M to sell across 96 symbols. The S&P 500 also leaned heavily buy, with $3.928B to buy against $1.876B to sell.
Sector flows were led by Information Technology, which showed a massive $1.489B net buy imbalance and an +84.9% dollar lean. Health Care and Communication Services were also strong, both at +77.9%. Financials had a large positive dollar total of $247.49M and a +69.0% dollar lean, though its symbol count leaned sell, suggesting concentrated buying in larger names. On the sell side, Materials was notably weak at -81.9%, and Basic Materials showed a full -100% sell lean, though on only one symbol. Consumer Discretionary and Real Estate also leaned sell.
The largest buy symbols were NVDA, GOOGL, MSFT, AMD, LLY, TSLA, MU, AAPL, UNH, and MS. The largest sell names included HD, WELL, MCD, RTX, TXN, APH, LYV, ABBV, SLB, INTC, and CRH. Overall, the close was a buy-biased MOC led by mega-cap technology and Nasdaq strength.


Monday
9:00am - 11:30am, Manny & Tom
12:00pm - 1:30pm, Bo
2:00pm - 2:30pm, Tom
Technical Edge
Fair Values for May 11, 2026
SP: 22.9
NQ: 108.72
Dow: 82.66
Daily Breadth Data 📊
For Friday, May 8, 2026
• NYSE Breadth: 51% Upside Volume
• Nasdaq Breadth: 65% Upside Volume
• Total Breadth: 60% Upside Volume
• NYSE Advance/Decline: 58% Advance
• Nasdaq Advance/Decline: 56% Advance
• Total Advance/Decline: 57% Advance
• NYSE New Highs/New Lows: 110 / 64
• Nasdaq New Highs/New Lows: 373 / 150
• NYSE TRIN: 1.34
• Nasdaq TRIN: 0.69
Weekly Breadth Data 📈
For Week Ending May 8, 2026
• NYSE Breadth: 49% Upside Volume
• Nasdaq Breadth: 57% Upside Volume
• Total Breadth: 54% Upside Volume
• NYSE Advance/Decline: 55% Advance
• Nasdaq Advance/Decline: 58% Advance
• Total Advance/Decline: 57% Advance
• NYSE New Highs/New Lows: 370 / 128
• Nasdaq New Highs/New Lows: 854 / 357
• NYSE TRIN: 1.32
• Nasdaq TRIN: 1.03

BTS Levels - (Premium Only)


Polaris Trading Group Summary - Friday, May 8, 2026
Friday was treated as FRYday / Capital Preservation Day, and the room kept that tone throughout the session. The market had a bullish backdrop after stronger-than-expected jobs data, with price retesting prior highs and NQ pushing to new all-time highs. The main theme was staying aligned with momentum while avoiding poor-location entries and protecting weekly gains.
Pre-market tone was bullish: David noted the U.S. economy added 115K jobs, beating expectations, while unemployment stayed unchanged at 4.3%.
Capital preservation was emphasized early: David reminded everyone that Friday is Capital Preservation Day, setting a disciplined tone for trade selection.
Key level action mattered: Price was retesting the prior high area near 7410.50 pre-RTH, and the room tracked reactions around D-Levels and the upper sandbox area.
The market showed strong momentum: Ram observed that price hit a D-Level and reversed, later noting that NQ made a new all-time high.
Trade lesson — do not fight impulsive moves: John B pointed out that recent sessions have offered few pullbacks, with strong moves coming directly out of consolidation.
Trade lesson — location matters: Several traders recognized the desire to be long, but also the danger of entering at poor location near all-time highs.
Positive development — better chart reading: Members praised the value of clear, calm, objective chart reading and staying aligned with the dominant move.
Education focus — PTG 3-Day Cycle: Subhash asked about the Day 2 range-bound trade, and David shared the PTG 3-Day Cycle resource.
Pullback discussion was constructive: Dani noted that practicing long-side pullback entries in stocks helped build confidence for similar futures setups.
Room tone stayed positive: Members thanked David for the week, wished him well for his doctor’s visit, and wrapped up with appreciation for a strong trading week.
Closing note: David posted a MOC BUY imbalance of $4.4 billion, reinforcing the bullish tone into the close.
Bottom line: The day rewarded patience, alignment, and discipline. The best lesson was not simply to chase strength, but to respect momentum while waiting for proper location and preserving capital into the weekend.
DTG Room Preview – Monday, May 11, 2026
Market focus: U.S./Iran peace talks have stalled after Iran’s counter-proposal was rejected by President Trump as “totally unacceptable.”
Risk tone: U.S. stock futures, gold, and bitcoin are under pressure, while oil is up roughly 5%, increasing inflation concerns.
Macro backdrop: Friday’s stronger-than-expected jobs report helped push U.S. equities to new highs, but this week’s April CPI and PPI reports are now key.
Geopolitics: Trump is scheduled to meet Xi Jinping on May 13–15, with Iran, Taiwan, AI, trade, rare earths, and nuclear arms control expected to be on the agenda.
AI theme: Samsung joined Nvidia, TSMC, and Broadcom in the $1T market-cap club, highlighting continued demand for AI chips, memory, and infrastructure.
Volatility: ES 5-day average daily range rose to 85.25 points, up from 79.00 on Thursday.
Positioning: Whale bias is bullish into the U.S. open on light overnight large-trader volume.
ES technicals: ES remains between short-term channel resistance at 7453/56 and former channel support near 7355/58.
Key ES levels:
Resistance: 7453/56
Support: 7369/72, 7218/23, 7032/37
50-day MA: 6909.25
200-day MA: 6868.50

