- The Opening Print
- Posts
- Trump, Crude, and the Fast Money — This Is Information Warfare
Trump, Crude, and the Fast Money — This Is Information Warfare
Follow @MrTopStep on Twitter and please share if you find our work valuable!
Our View
The Historical Precedent: Martha Stewart (2004)
The Martha Stewart case serves as a reminder of how the DOJ treats individuals compared to systemic market moves.
The Action: Sold several thousand shares of ImClone the day before a negative FDA ruling caused the stock to crater.
The Charges: While the actual securities fraud charges were dismissed, the government pivoted to her testimony.
The Sentence: Convicted on four counts of obstruction of justice and lying to investigators.
Penalty: Served 5 months in prison and 5 months of house arrest.
The Reality Check: You're right to feel the disparity is hard to believe. Stewart wasn't actually convicted of insider trading—she was convicted for the cover-up. In 2026, the challenge for the SEC and CFTC is that many of these "front-run" trades are happening in decentralized or prediction markets, where the legal definitions of "insider" and "obstruction" are still being tested in court.
When I was on the floor, we knew there was some big bank desk front-running going on, and some high-profile investors and company insiders often gained an advantage by trading stocks based on firsthand data, company performance, and market knowledge. While not explicitly defined as "front-running" (a specific form of market manipulation), billionaires like Jeff Bezos and major investors such as Warren Buffett, Bill Gates, and Carl Icahn often engage in massive, legally disclosed stock acquisitions or sales.
It is striking to see the contrast between the rigid prosecution of the past and the "gray area" high-stakes trading of 2026. While Martha Stewart’s case remains the gold standard for federal "obstruction" consequences, the sheer scale of the recent oil and prediction market trades represents a new frontier for regulators.
High-Probability "Information" Trades (2026)
These instances represent the "front-running" of geopolitical events, often occurring minutes or hours before official announcements.
Date (2026) | Asset / Market | The Trade | Result / Payout | The "News" Event |
|---|---|---|---|---|
Feb 28 | Prediction (Poly) | 6 new wallets bet "Yes" on Iran strike | $1.2M profit | U.S.-Israel strike announced 71 mins later |
Mar 22 | Oil/ES Futures | $580M Oil Short / $1.5B S&P Long | Large Macro Gain | Correctly timed de-escalation "pivot" |
Mar 23 | Oil Futures | $500M Short position | 15% Price Drop | 15 mins later: Iran strike delay announced |
Apr 7 | Brent/WTI | 8,600 lots ($9.5B notional) | 15% Market Sell-off | 3 hours later: Ceasefire post on Truth Social |
Apr 17 | Brent Crude | 7,990 lots ($760M position) | — | — |
Our View
Needless to say, all these "bets" are tied to inside information and what I call the "pump and dump," or vice versa. As I have said in the past, we got information from a guy who cleared Bear Stearns that there was going to be an intra-market meeting rate hike, and the next day, the Fed raised rates.
Over the years, I have seen other suspicious, larger trades made through my S&P desk that came out of nowhere, and then a big headline comes out, and the market moves in the right direction; but since Trump took office for his second term, this has become so noticeable that it's hard to think it is just a coincidence.
There are no scheduled economic reports or Fed-speak today.
We have a busy week ahead; over 20% of the S&P reports earnings, with TSM, TSLA, and INTC topping the list, the Fed's two-day meeting, Retail Sales, GDP, PCE Index, and Michigan Sentiment, possible U.S./Iran negotiations, and endless headlines.
Our Lean
They say politics and the markets don't mix, but Trump doesn't see it that way. We are now 8 weeks into the war that has upset the global economies, pushing up oil and gas and causing inflation to rise and a high level of uncertainty.
I thought long and hard about this: Trump has played the markets like a fiddle. When it was going down, he played down the length of the war and pushed his false narratives to rally the stock market. He is set to do it again this week if and when the U.S. and Iran meet again. He ups the threats and then makes announcements claiming there is a deal to stop fighting, and the markets rally again.
It's 7:30 PM Sunday night, and the ES has traded down to 7085, down 76.50 points or 1.07%; oil is up $7.00, Bitcoin is down $3,500, and gold is down $111.00. The ES didn't act that great on Friday's close, and the headlines over the weekend were not great either.
Here are a few of them:
Trump says Iran talks are on, sparking a push to bridge a gaping divide, and warns Iran of further attacks if it fails to agree on a deal to end the war.
Trump says the U.S. seized an Iranian ship ahead of a new round of peace talks and says his team will be in Pakistan this week for talks; threatens to knock out all of Iran's power plants and bridges.
U.A.E. asks the U.S. about a wartime financial lifeline; Emirati officials speak with Treasury Secretary Scott Bessent about accessing dollars if the Middle East conflict drags on.
Our lean: I don't know what the probability is, but it's highly likely we see some type of rally/bounce on Globex. I think we all know the markets have gone up too fast, and we should see selling after such a big push and negative headlines, but as I said above, everything is geared for the next positive headline and another pop.
That said, if oil continues to rally and Iran refuses to meet in Islamabad, we could go lower. There should be good support at the 7055 - 7047, 7033, 7020, 7000, 6990, and the 6985-83 level, but again, don’t be surprised if we see another Trump Truth Socal post saying Iran wants a deal. You can sell the rips and buy the pullbacks, or just be patient and look for a good pullback to buy.
SUPPORT & RESISTANCE LEVELS │ 04/17/2026 │ Close: 7161.50
────────────────────────────────────────────────────────────────────────
ATR14: 106.71 ATR5: 94.95 VWAP20: 6715.43 BB Width: 864.87
────────────────────────────────────────────────────────────────────────
LEGEND
🟣 POC / Virgin POC 🔵 Value area boundary (VAH/VAL)
🟢 HVN / Moving average 🔴 LVN / resistance node
🟡 Pivot (Classic/Woodie/Cam/DeMark) 🟠 Fib / Gann
🔷 VWAP / ATR / Bollinger ⚫ IB / Swings / Prior session
────────────────────────────────────────────────────────────────────────
▲ RESISTANCE (above 7161.50)
────────────────────────────────────────────────────────────────────────
🟠 F162 — 7700.25 (+7.52%) → Fib 161.8% extension
🟠 F127 — 7412.25 (+3.50%) → Fib 127.2% extension
🟠 G+2 — 7375.00 (+2.98%) → Gann +2 ATR units
🔷 ATR+15 — 7321.50 (+2.23%) → 1.5x ATR14 above close
⚫ IB1R — 7296.25 (+1.88%) → IB +1x extension target
🟠 G+1 — 7268.25 (+1.49%) → Gann +1 ATR unit
⚫ IB.5R — 7241.00 (+1.11%) → IB +0.5x extension
🟠 G+4/8 — 7214.75 (+0.74%) → Gann 4/8 up (midpoint)
🟠 G+3/8 — 7201.50 (+0.56%) → Gann 3/8 up
🟠 G+2/8 — 7188.25 (+0.37%) → Gann 2/8 up
🔴 LVN3 — 7175.00 (+0.19%) → Low volume node — thin, fast-moving area
★ CURRENT PRICE: 7161.50
────────────────────────────────────────────────────────────────────────
▼ SUPPORT (below 7161.50)
────────────────────────────────────────────────────────────────────────
🔴 LVN2 — 7150.00 (-0.16%) → Low volume node — thin, fast-moving area
🟡 CR3 — 7137.75 (-0.33%) → Classic R3
🔴 LVN1 — 7125.00 (-0.51%) → Low volume node — thin, fast-moving area
🟡 CH5 — 7116.25 (-0.63%) → Camarilla H5 — extreme breakout
🟠 G-4/8 — 7108.25 (-0.74%) → Gann 4/8 down (midpoint)
🔵 M2VAH — 7100.00 (-0.86%) → Monthly VAH 04/16/2026
🟡 CH3 — 7089.75 (-1.00%) → Camarilla H3 — fade resistance
🟡 CH1 — 7079.25 (-1.15%) → Camarilla H1
🟡 CPP — 7070.75 (-1.27%) → Classic pivot point
⚫ PC2 — 7060.50 (-1.41%) → Prior session close 04/15/2026
🟡 CS1 — 7052.75 (-1.52%) → Classic S1
🟡 DS1 — 7040.50 (-1.69%) → DeMark S1
🟡 WS2 — 7030.00 (-1.84%) → Woodie S2
🔷 VWAP5 — 7021.75 (-1.95%) → 5-session VWAP
🟡 CS3 — 7010.25 (-2.11%) → Classic S3
🔷 ATR-15 — 7001.50 (-2.23%) → 1.5x ATR14 below close
⚫ PL2 — 6991.75 (-2.37%) → Prior session low 04/15/2026
🔵 D4VAH — 6975.00 (-2.60%) → Daily VAH 04/14/2026
⚫ IB1S — 6964.75 (-2.75%) → IB -1x extension target
🟠 G-2 — 6948.00 (-2.98%) → Gann -2 ATR units
⚫ PH4 — 6928.25 (-3.26%) → Prior session high 04/13/2026
⚫ PL3 — 6920.25 (-3.37%) → Prior session low 04/14/2026
🟢 MA10 — 6907.75 (-3.54%) → 10-period SMA
🔵 W2VAH — 6900.00 (-3.65%) → Weekly VAH 2026-04-06
⚫ PWkH — 6888.00 (-3.82%) → Prior week high
🔷 VWAP10 — 6877.00 (-3.97%) → 10-session VWAP
🟠 F382 — 6867.75 (-4.10%) → Fib 38.2% retracement (20-session)
⚫ PC5 — 6855.25 (-4.28%) → Prior session close 04/10/2026
⚫ PL5 — 6846.25 (-4.40%) → Prior session low 04/10/2026
🟢 MA50 — 6818.75 (-4.79%) → 50-period SMA
🟣 W6POC — 6800.00 (-5.05%) → Weekly POC 2026-03-09
🔵 W5VAH — 6775.00 (-5.40%) → Weekly VAH 2026-03-16
⚫ SL5 — 6767.00 (-5.51%) → 5-session swing low
🟢 MA20 — 6735.75 (-5.94%) → 20-period SMA
🔷 VWAP20 — 6715.50 (-6.23%) → 20-session VWAP
🔵 W6VAL — 6700.00 (-6.44%) → Weekly VAL 2026-03-09
🔵 W4VAH — 6675.00 (-6.79%) → Weekly VAH 2026-03-23
🟣 CPOC — 6650.00 (-7.14%) → Composite POC — all-session magnet
🟣 W4POC — 6625.00 (-7.49%) → Weekly POC 2026-03-23
⚫ PWkL — 6567.00 (-8.30%) → Prior week low
🟣 W3POC — 6550.00 (-8.54%) → Weekly POC 2026-03-30
🟠 F786 — 6531.50 (-8.80%) → Fib 78.6% retracement (20-session)
🔵 W3VAL — 6450.00 (-9.94%) → Weekly VAL 2026-03-30
⚫ SL20 — 6353.25 (-11.29%) → 20-session swing low
🔷 BB-2 — 6303.50 (-11.98%) → Bollinger lower band (-2σ)
🟡 DPP — 3532.50 (-50.67%) → DeMark pivot
KEY STATS
Composite POC: 6650.00 CVAH: 6875.00 CVAL: 6525.00
Week VAH: 7125.00 Week VAL: 6925.00 Week POC: 7075.00
Month VAH: 7150.00 Month VAL: 7075.00 Month POC: 7075.00
Camarilla H4: 7102.75 H3: 7089.75 L3: 7064.25 L4: 7051.25
BB Upper: 7168.26 BB Lower: 6303.39
MA10: 6907.65 MA20: 6735.82 MA50: 6818.65 EMA9: 7023.47 EMA21: 7015.25
Market Recap
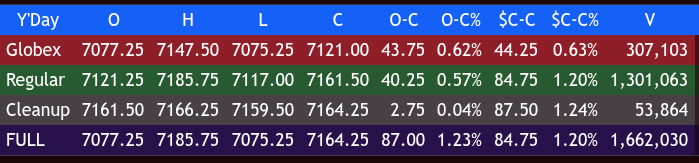
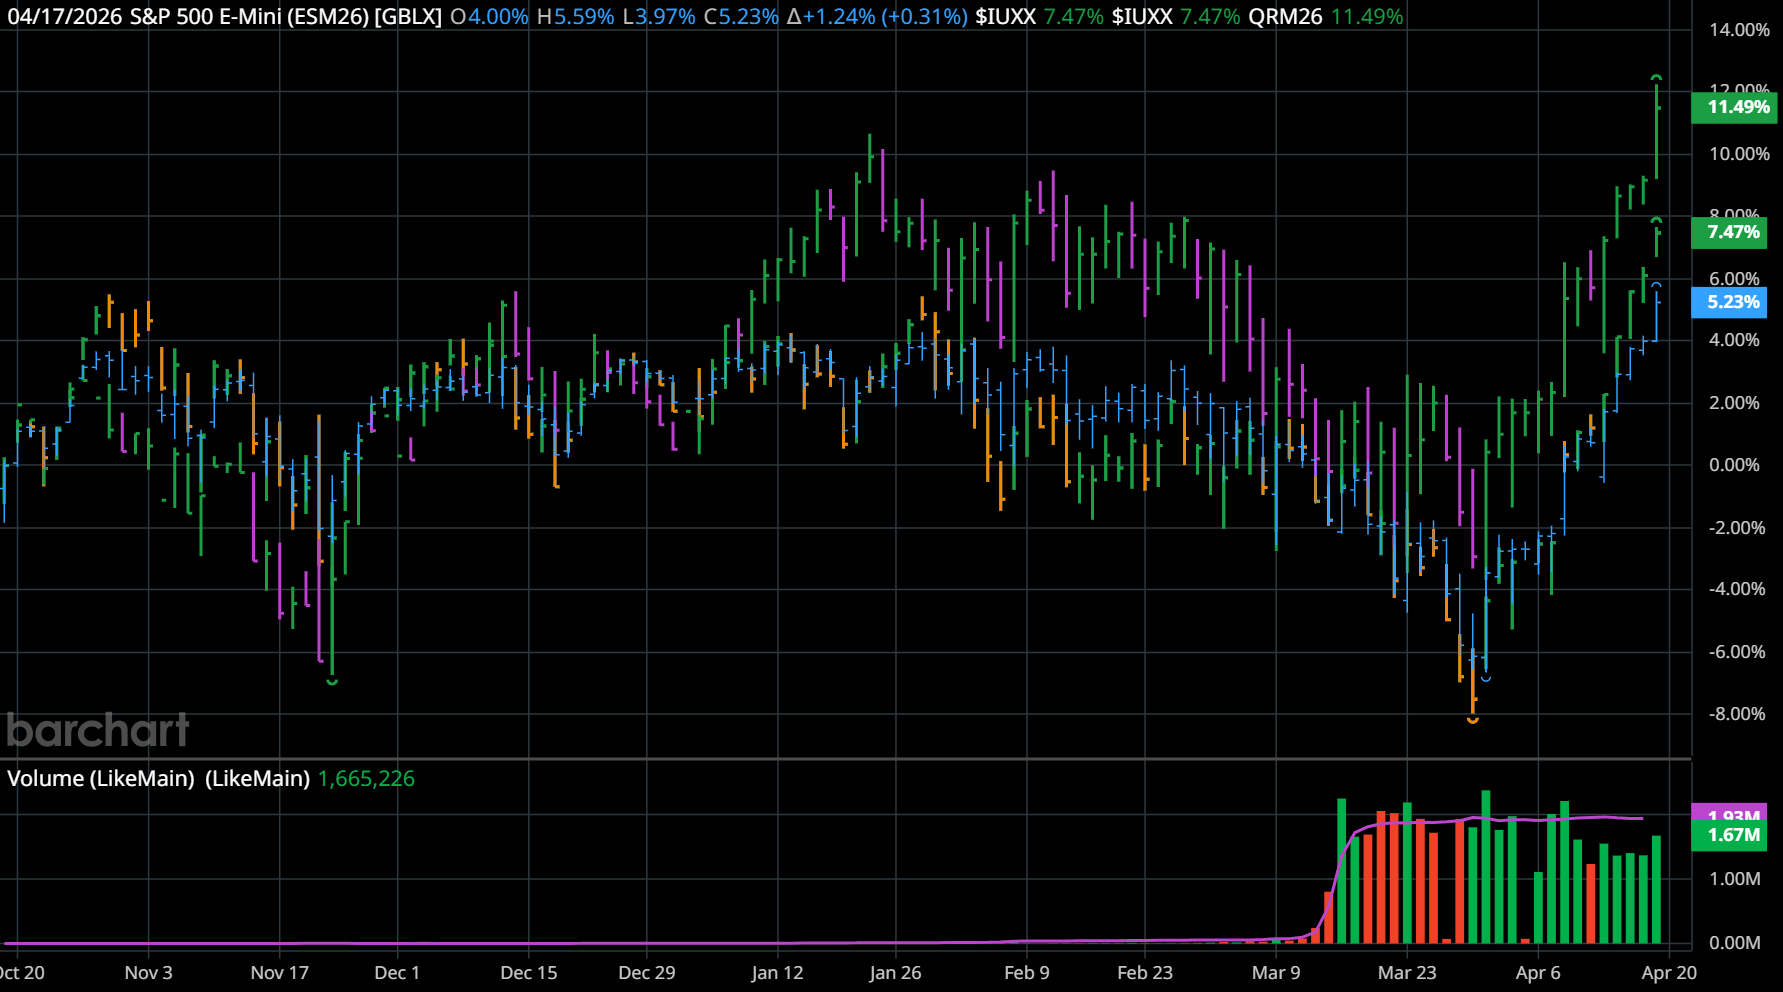
The ES made a low at 7075.25 and rallied up to 7121.00 on Globex, and opened Friday's regular session at 7121.25, up 44 points or +0.64%.
After the open, the ES traded 7119.25, rallied up to 7130.75, sold off down to 7117.00 at 9:45, and rallied 57.75 points up to 7174.75 at 10:50. It then sold off down to 7163.00 at 11:00, rallied up to a lower high at 7173.00, and sold off down to 7159.50 at 11:15. The ES rallied 26.25 points up to 7185.75 at 12:45, then sold off 34.25 points down to 7151.50 at 1:20.
It traded back up to 7169.00 at 1:45, sold back off down to 7152.75 at 2:20, rallied 12.75 points up to 7165.50, and sold back off down to 7151.00 at 3:14. The ES rolled back up to 7165.00 and traded 7160.00 as the 3:50 cash imbalance came out flat, and traded 7165.50 on the 4:00 cash close.
After 4:00, the ES traded up to 7166.25 and settled at 7164.25, up 84.50 points or +1.9%; the NQ settled at 26,825.50, up 388.25 points or +1.18%; the YM settled at 48,808, up 874 points or +1.79%; and the RTY, or QRM26, settled at 2,788.90, up 58.10 points or +2.13%. The YM is the only major index that didn't cross its all-time high; it settled at 49,410 on February 10.
In the end, and despite the ES and NQ closing higher, there was a big rotation into the YM and RTY. In terms of the ES's and NQ's overall tone, everything went from horrible to new contract highs. In terms of the ES's overall trade, volume was higher at 1.66 million contracts traded.
The YM is the only major index that didn't cross its all-time high; it settled at 49,410 on February 10, 2026.

Guest Posts
MiM
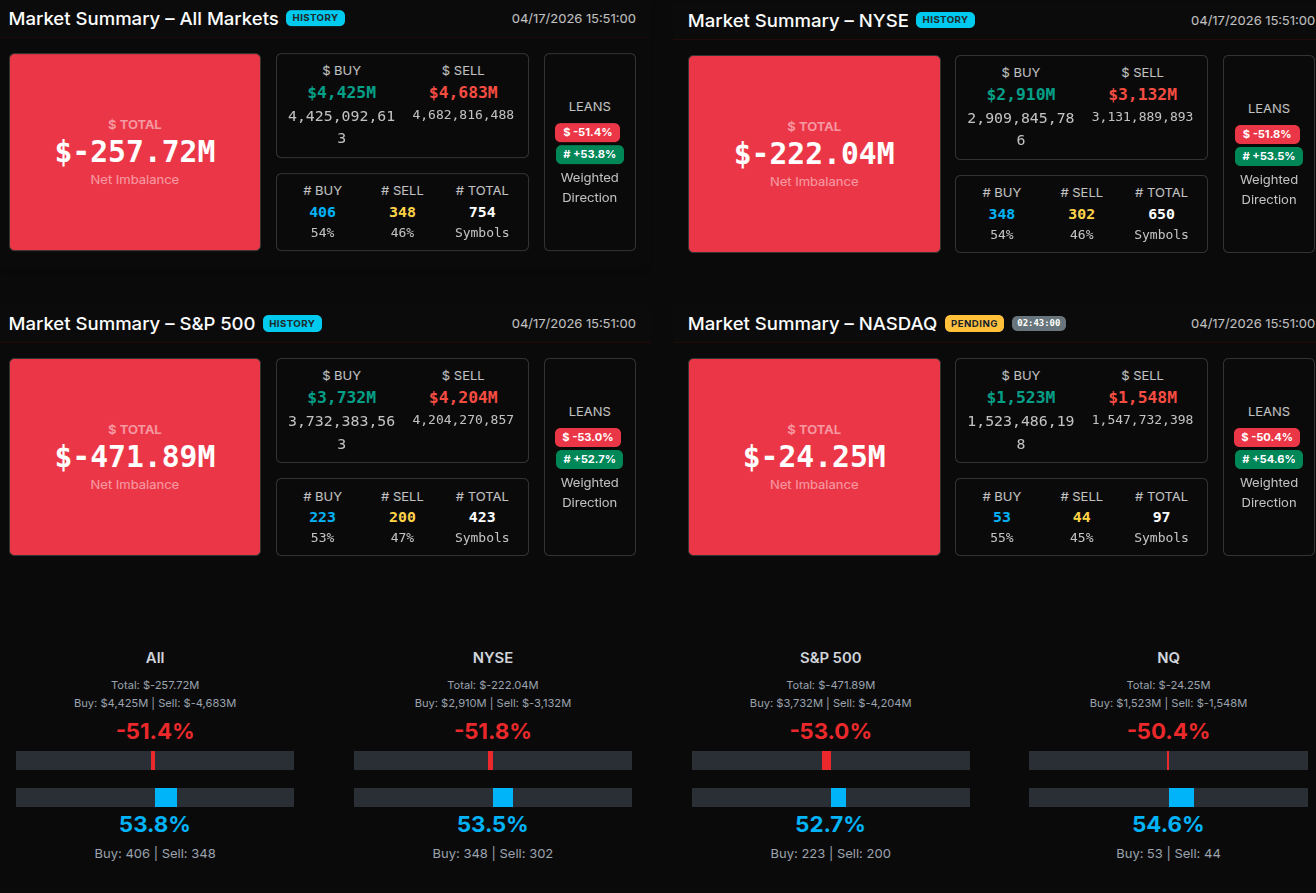
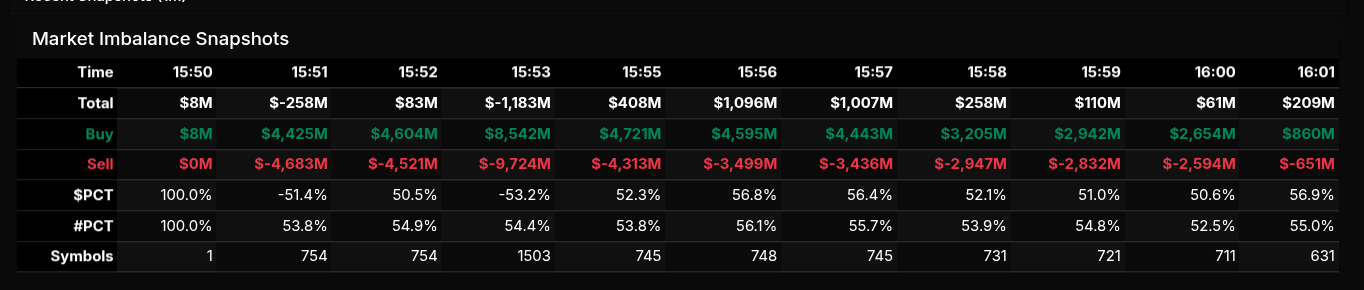
The MOC session opened with a clear sell-side bias at 2B (-51.4%). However, this was not sustained as a trend—rather, it set up a transition phase.
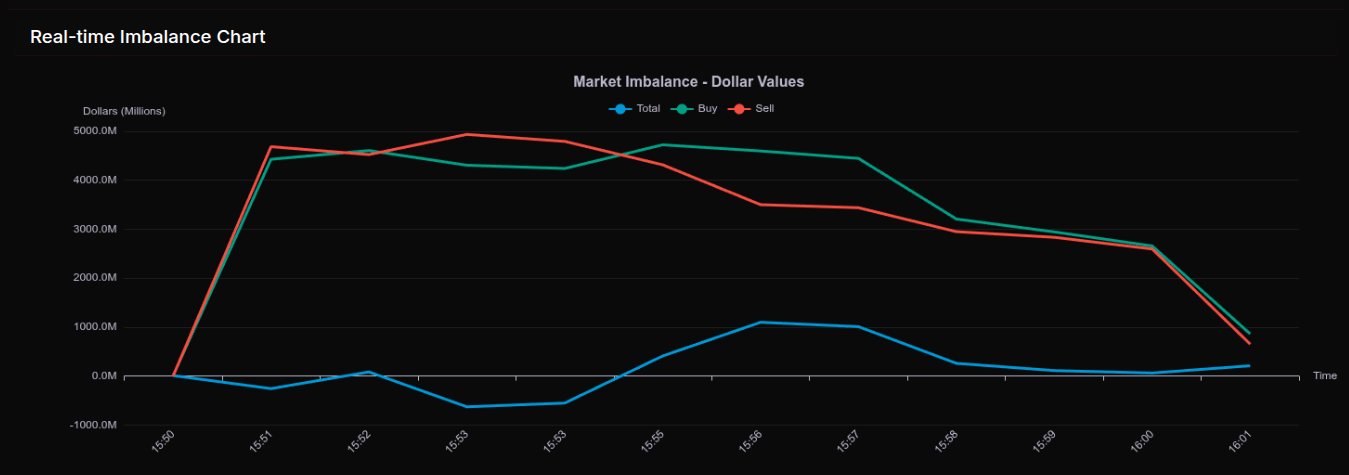
From 15:55 onward, the market began absorbing supply and rotating back toward the buy side. Imbalances flipped positive and built steadily, peaking around 15:56–15:57 with over $1B in buy-side pressure. Importantly, the percentage leans during this phase hovered in the low-to-mid 50% range, signaling rotational buying rather than a wholesale institutional sweep. The close itself maintained a modest buy skew, finishing near +56.9%, reinforcing that the late demand was controlled accumulation, not aggressive chasing.
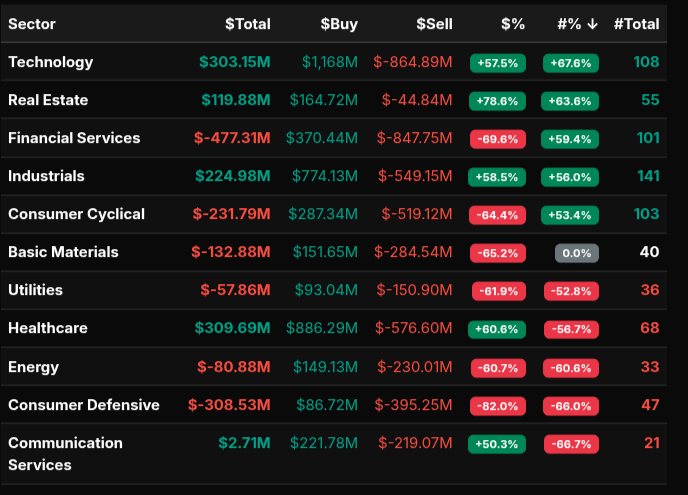
On a sector level, dispersion was significant. Technology (+57.5%) and Healthcare (+60.6%) showed strong buy-side participation, with Healthcare particularly notable given its negative breadth (-56.7%), indicating concentrated institutional buying in fewer names. Real Estate led all sectors at +78.6%, a clear wholesale buy signal. Industrials (+58.5%) also contributed meaningfully to the upside rotation.
Conversely, Financials (-69.6%) and Consumer Defensive (-82.0%) stood out as decisive sell programs, both exceeding the -66% threshold, signaling broad institutional distribution. Consumer Cyclical (-64.4%) and Energy (-60.7%) added to the defensive tone, though more rotational in nature.
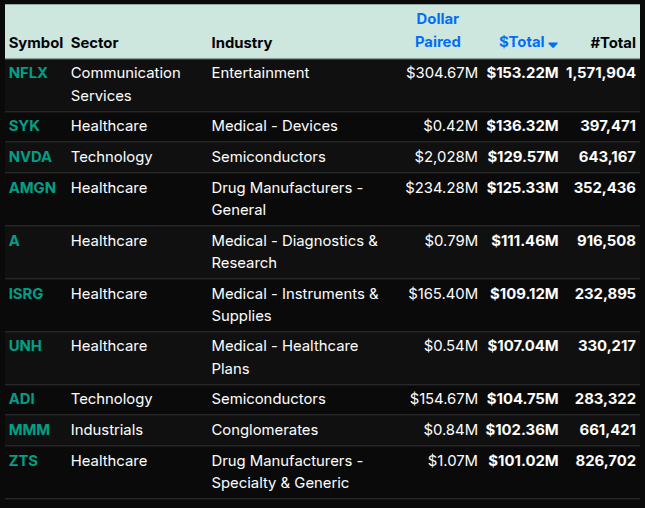
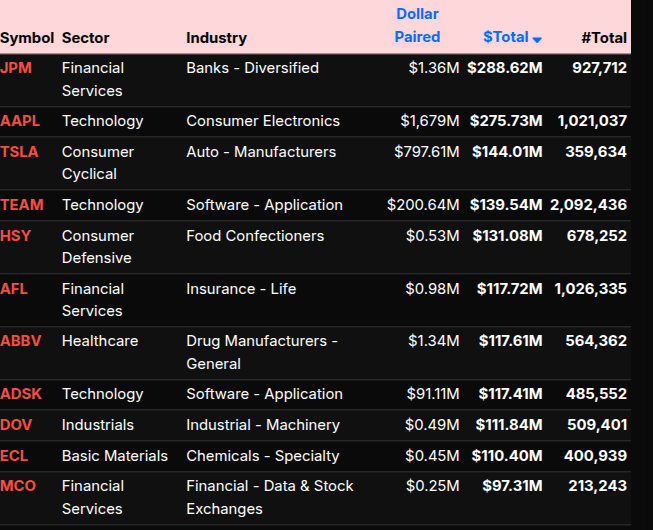
At the symbol level, buying was concentrated in names like NFLX, NVDA, and AMGN, while selling pressure was evident in Financials (JPM, MCO) and Consumer names (TSLA, HSY).
Overall, the session evolved from an early institutional sell imbalance into a late-stage rotational buy program, with sector divergence suggesting repositioning rather than a unified directional move.
Monday
9:00am - 11:30am, Manny & Tom
12:00pm - 1:30pm, Bo
2:00pm - 2:30pm, Tom
Technical Edge
Fair Values for April 20, 2026
SP: 36.05
NQ: 155.9
Dow: 186
Daily Breadth Data 📊
For Friday, April 17, 2026
• NYSE Breadth: 71% Upside Volume
• Nasdaq Breadth: 71% Upside Volume
• Total Breadth: 71% Upside Volume
• NYSE Advance/Decline: 55% Advance
• Nasdaq Advance/Decline: 48% Advance
• Total Advance/Decline: 51% Advance
• NYSE New Highs/New Lows: 195 / 11
• Nasdaq New Highs/New Lows: 527 / 53
• NYSE TRIN: 1.33
• Nasdaq TRIN: 1.13
Weekly Breadth Data 📈
For Week Ending April 17, 2026
• NYSE Breadth: 64% Upside Volume
• Nasdaq Breadth: 72% Upside Volume
• Total Breadth: 69% Upside Volume
• NYSE Advance/Decline: 52% Advance
• Nasdaq Advance/Decline: 60% Advance
• Total Advance/Decline: 57% Advance
• NYSE New Highs/New Lows: 284 / 59
• Nasdaq New Highs/New Lows: 710 / 264
• NYSE TRIN: 1.70
• Nasdaq TRIN: 1.53

BTS Levels - (Premium Only)

Room Summaries:
Polaris Trading Group Summary - Friday, April 17, 2026
Friday had a strong bullish tone from the start, driven by momentum and macro headlines, and ultimately closed at new all-time highs, reinforcing the dominant trend.
Morning – Momentum & Macro Influence
Early excitement as futures hit the 7100 target and pushed into new ATH territory right out of the gate.
Crude oil volatility stood out, with news around the Strait of Hormuz helping trigger a sharp drop. David noted the contract roll to June, which was key context for traders.
The room identified a “snappy, trappy, happy” rhythm, highlighting fast-moving price action that required precision.
Traders discussed levels like high-volume nodes and potential extensions, staying engaged with structure.
Mid-Morning – Challenging Trade Conditions
Some traders expressed frustration with lack of clean pullbacks, especially for long entries.
This reinforced an important lesson:
→ In strong momentum markets, waiting for perfect setups can mean missing moves. Adaptation is key.Discipline was still evident—several traders chose to step away rather than force trades.
Late Morning – Shift to Patience
David pointed out momentum flattening and the transition into lunch consolidation.
Clear guidance: adjust expectations during slower periods—a critical professional mindset.
Afternoon – Targets Achieved & Trend Confirmation
After lunch, the market resumed its strength:
ES hit Cycle Day 2 target (7178) and pushed beyond (HOD ~7185.75)
NQ also completed upside cycle targets
The move was framed as a “Peace Deal Rally”, tying macro sentiment into technical execution.
Price respected key references like VWAP and AVWAP, offering structure for those still trading.
Close – Strength Into the Finish
Market held gains into the close with MOC flat (no major sell imbalance).
Final result: All-Time High Close, capping off a strong trend day.
Key Takeaways & Lessons
Trend Days Pay: When cycle targets and momentum align, holding runners or staying with trend bias is critical.
Adapt to Conditions: Strong markets may not offer ideal pullbacks—flexibility matters.
Respect Time of Day: Lunch = lower probability; capital preservation mindset is key.
Structure Still Works: VWAP/AVWAP and cycle levels provided reliable guidance even in fast markets.
Discipline Wins: Traders stepping aside during frustration avoided unnecessary losses.
Overall, this was a highly productive, trend-driven session with clear execution opportunities for those aligned with the bullish bias and willing to adapt to momentum conditions.
DTG Room Preview – Monday, April 20, 2026
Macro focus: Iran conflict + earnings remain the primary drivers. Tensions escalated after the US seized an Iranian-linked vessel, halting traffic in the Strait of Hormuz again. Oil +6%, while equities and gold dipped slightly. Markets showing muted reaction → growing complacency.
Ceasefire watch: Current US–Iran ceasefire expires Tuesday → potential volatility catalyst.
Fed angle: Kevin Warsh confirmation hearing Tuesday. His stance on inflation vs. employment (especially amid oil-driven inflation) could move markets.
Energy theme: Rising oil prices accelerating global shift to battery storage + renewables. Battery costs down ~75% since 2018; demand and profits (notably China) surging.
Earnings: Strong Q1 so far. Key names this week include TSLA, INTC, and UAL. Heavy earnings slate Tuesday morning (GE, UNH, HAL, NOC, etc.).
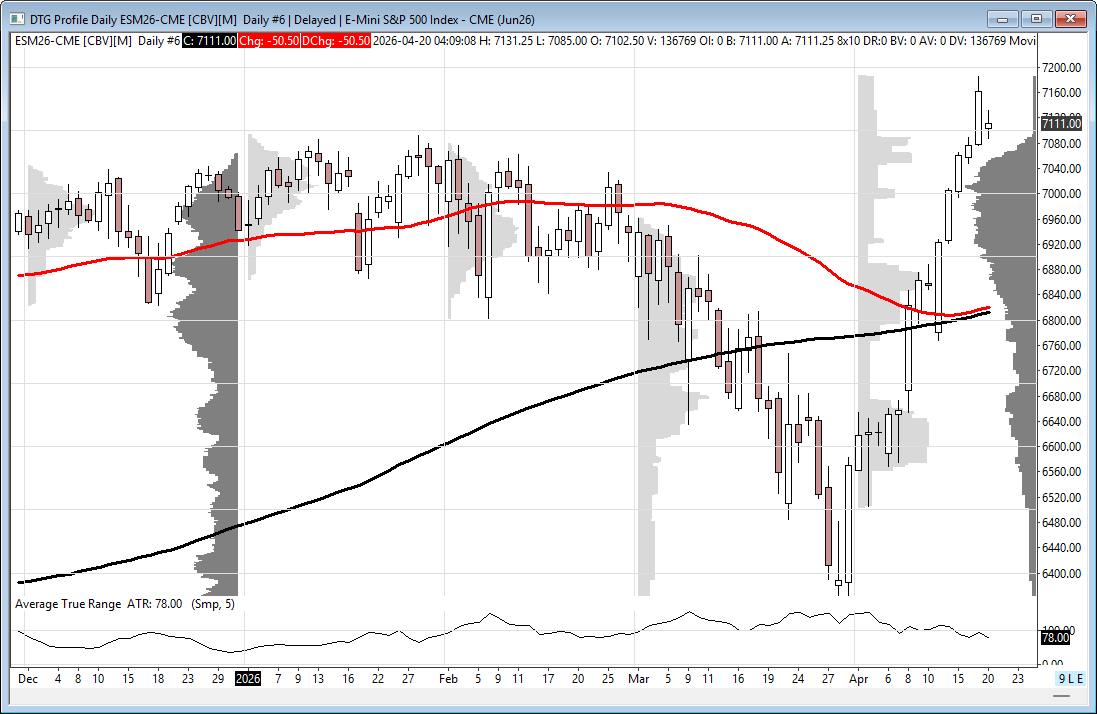
Volatility: Expanding. ES 5-day range jumped to ~95 points.
Positioning: Whale flow leaning bearish into the open.
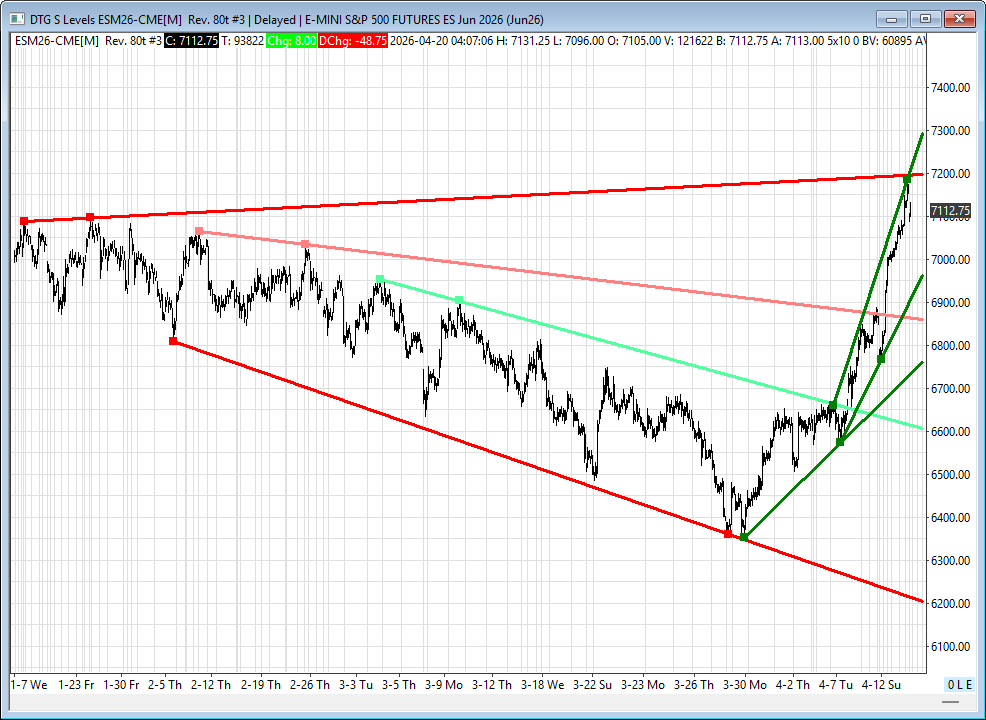
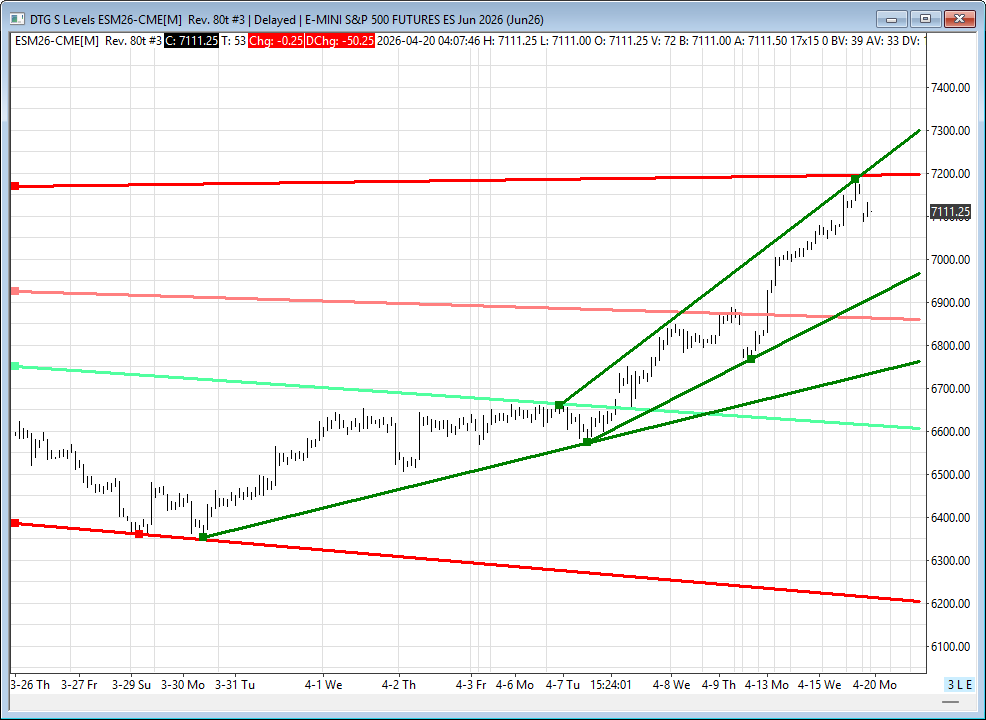
Technicals (ES):
Rejected near 7197–7202 trendline → key resistance on retest
Upside TL resistance: 7244–7249
Support levels: 6941–6946, 6760–6765, 6200–6195
Moving averages remain bullish (50-day > 200-day)
Bottom line: Markets still resilient near highs, but rising geopolitical risk, bearish positioning, and key macro events (ceasefire + Fed hearing) keep downside risk in play.