- The Opening Print
- Posts
- Was Trading on the Floor Easier Than on the Screens?
Was Trading on the Floor Easier Than on the Screens?
Jobs “Fry-Day” is here.
Danny Riley
June 02, 2023
Follow @MrTopStep on Twitter and please share if you find our work valuable.
Our View
People always ask me if it was easier trading the S&P futures on the floor and the answer is a resounding “YES!”
First, you could see — and feel — the order flow. Second, while there was an S&P index arb, there was not that much algo and HFT trading, so you didn't get the wild whips as much.
Finally, the futures trended better, the ranges were smaller and it was $500.00 a point, so if you did catch a move you could make a lot of money on just a few contracts. I used to trade 6 lots, which doesn't sound like a lot, but it was $3,000 a point.
Today it's a totally different game; it's all run by money flow and programs. If you get on the wrong side it doesn't matter how much money you have because you will lose it.
Our Lean
Welcome to hell: jobs Fryday and the Friday options expiration. Regardless of what the jobs number says, the ES is going up. However, the key to this is it may have to go down / pull back first.
Our Lean: The NFP Number will be the driver for today’s action (as well as its implications on the Fed’s rate-hike plans later this month). That said, we are still looking to buy the pullbacks.
If we gap-up on the number, we’re looking to fade the initial rally then buy the pullbacks, while keeping in mind that last Friday the S&P gave us a gap-and-go as it ripped to the upside. Let’s see how this number comes in and if we get a dip, it could give bulls a nice opportunity on the long side.
As for levels, we are keeping a close on the 4240 to 4250 zone. Above that is 4275 and 4300. On the downside, watch 4215 to 4225. Below 4200 and the two-day low is 4174 and 4178.
MiM and Daily Recap
The ES traded up to 4203.50 on Globex and opened Thursday's regular session at 4191.25. After the open, the ES sold off down to 4178 at 9:52, traded up to 4197.50, dropped down to 4184.25 at 10:28 and then rallied back up to 4207.75 at 10:47. From there, it pulled back a few points, then traded up to another new high at 4213.50 and then another new high at 4216 at 11:39. After another small pullback, the ES made a new high at 4225.50 at 12:03, another new high at 4228.75 at 12:22 and finally, another new high at 4229.75 at 1:24. Eventually, it climbed up to 4232.75 at 2:20.
The ES back-and-filled from 12:20 all the way to 4239.75 at 3:19, up 51.50 points. The next move was back down to 4219 at 3:41 and then rallied back up to 4238 as the 3:50 cash imbalance showed $641 million to sell and traded 4228.75 on the 4:00 cash close. After 4:00, the ES rallied up to 4232.50 and settled at 4231.75 on the 5:00 futures close, up 37.50 points or 0.89% on the day.
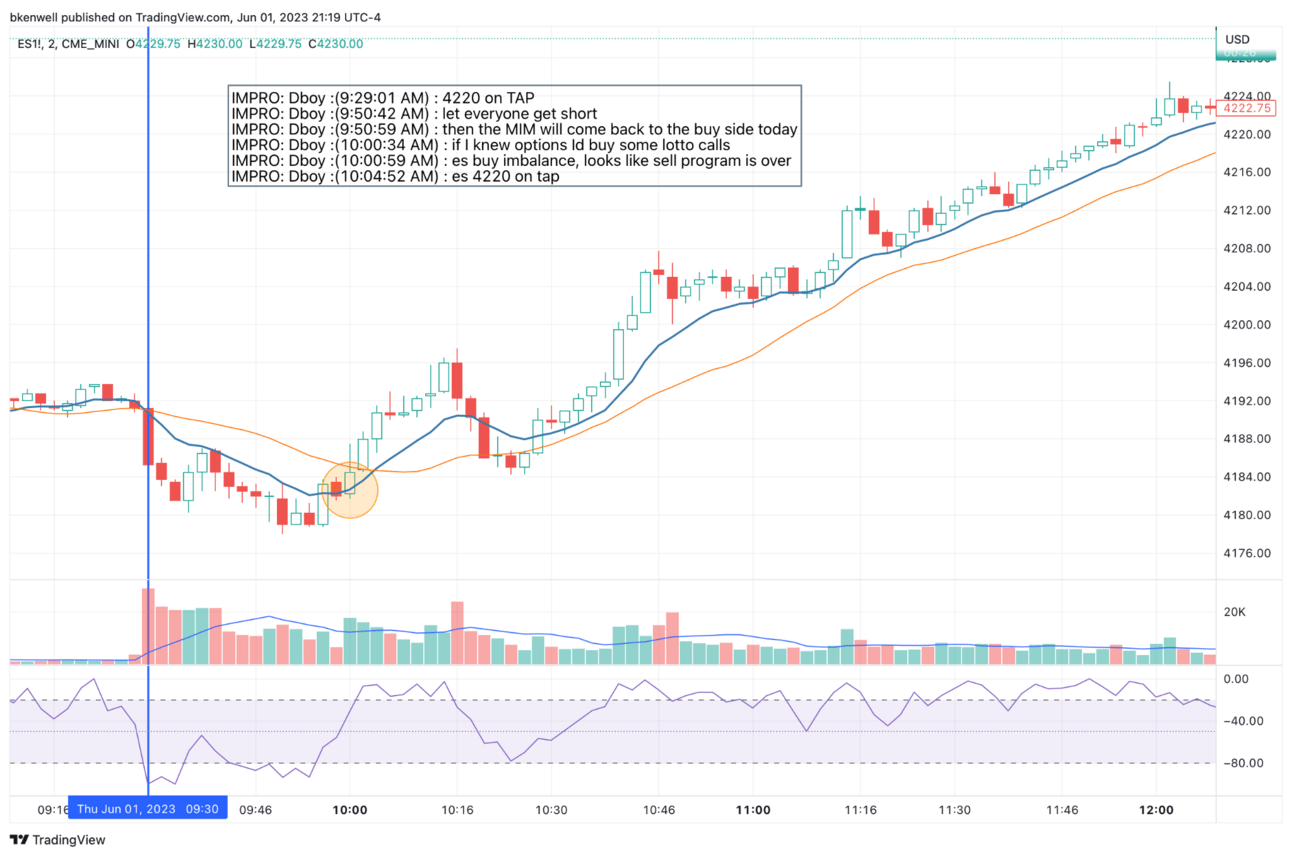
In the end, I had this one nailed. In the chart above are a few posts I made in the MrTopStep chat, one which nailed the #Lotto Options trade. Maybe run a time & sales on your chart and see how the posts worked out if you're interested.
In terms of the ES’s overall tone, it was all buy stops and buy programs after the early up-and-down. In terms of the ES's overall trade, volume was on the high end at 1.80 million contracts traded.

MIM down 12 days in a row.
Technical Edge
NYSE Breadth: 75% Upside Volume
Advance/Decline: 73% Advance
VIX: ~$15.50
S&P 500 — ES
The 4240-50 area has been critical resistance since September, but as the ES continues to put in higher lows, it’s got investors looking for a breakout. The jobs report will be a major driver.

Upside Levels: 4242-4250, 4275-78, 4300
Downside levels: 4215-25 (prior resistance and last week’s high), 4200, 4183, 4175
SPY
$422.50 to $423 has been resistance this week. Over that gets us $425, then the extension near $427.50. Importantly, the SPY has been building over the Q1 high.

Upside Levels: $422.50 to $423, $425, $427.50
Downside Levels: $416-18, $413
SPX
Upside Levels: 4230, 4250, 4270
Downside Levels: 4195-4200, 4170-75, 4150-53, 4130
NQ
Zooming out with a weekly chart, I wanted to highlight some of the bigger levels here. The NQ is looking for a three-week win streak but it might as well be a five-week streak given that the one week that broke it up was a 0.02% decline.
Shares are now reaching for the 61.8% of the bear-market range at 14,683. Above that opens the door to 15K. On the downside, bulls want to see the 13,900 to 14,000 area hold as support, along with the rising 10-week ema, which has been support for several months.
If that’s the case, bulls retain active control.

NQ Weekly
ARKK

ARKK Weekly
Everyone loves to hate ARKK, but it’s going for its first weekly close above the 50-week moving average since September 2021 (not a typo). This thing has been in a wicked downtrend, but a weekly-up over $41.28 and a strong close could fire up ARKK with a reasonable R/R for longs.
It’s why we tried to nab SHOP yesterday, but it didn’t quite tag our entry area. Many growth names have been trading better lately, just as a general observation.
Bold are the trades with recent updates.
Italics show means the trade is closed.
Any positions that get down to ¼ or less (AKA runners) are removed from the list below and left up to you to manage. My only suggestion would be B/E or better stops.)
** = previously mentioned trade setup we are stalking.
Down to Runners in GE, CAH, LLY, ABBV, AAPL, MCD & BRK.B. Now Add META, AVGO, UBER, CRM and AMZN.
Subscribe to Premium to read the rest.
Become a paying subscriber of Premium to get access to this post and other subscriber-only content.
Already a paying subscriber? Sign In.
A subscription gets you:
- • Danny Riley's personal trading plan for the upcoming session
- • Technical setups on the futures market, like the ES and NQ
- • MIM-related data and our daily recap
- • Breadth data and key upside and downside targets