- The Opening Print
- Posts
- Thin-to-Win Tape: Five Up Days, Light Volume, and Santa Taking the Wheel
Thin-to-Win Tape: Five Up Days, Light Volume, and Santa Taking the Wheel
Danny Riley
December 26, 2025
Follow @MrTopStep on Twitter and please share if you find our work valuable!
Our View
From mudslides in California to major winter storms in the Midwest to the Northeast, there had been nearly 17,000 flight delays by Christmas eve and more are expected over the holiday weekend. Will those delays change the pace of the five-day rally? I don’t think so. What it will do is add to the “thin-to-win” price action we’ve been seeing.
Including today, there are three full trading sessions left in December. My question is: can today make it six days in a row? I think so. I'm sorry I can’t add more to this, but the Santa Claus Rally starts today.

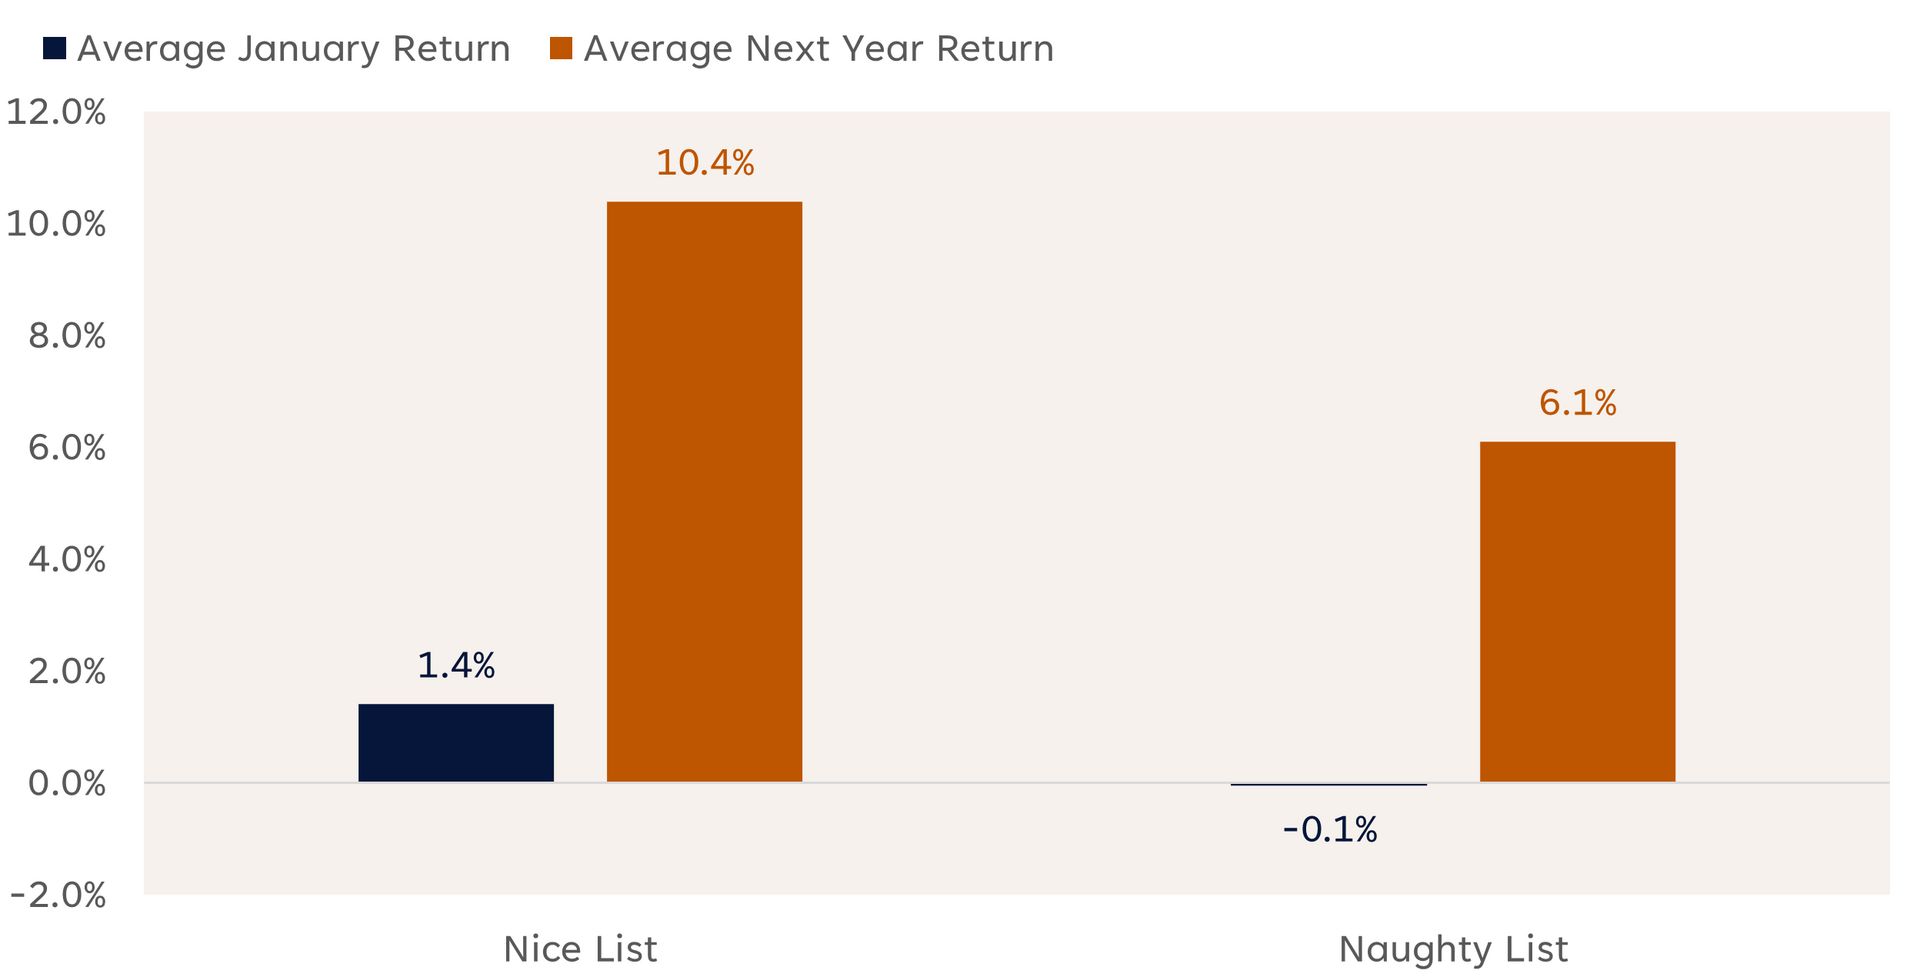
Another intriguing aspect of the Santa Claus Rally is its historical connection to January performance and the following year’s returns. Yale Hirsch captured this with his well-known phrase: “If Santa Claus should fail to call, bears may come to Broad and Wall.”
Historical data backs this up. When the rally is positive — putting investors on the “nice” list — the S&P 500 has delivered an average January gain of 1.4% and an impressive 10.4% return for the full year that follows. In contrast, when the index was down during this period — the “naughty” list — the averages dropped to just -0.1% for January and 6.1% for the subsequent year.
Naughty or Nice List Returns (1950-2025)
Our Lean
I think the lesson we continue to learn about December is that it's a bullish month, but the indices don’t really rally until the latter part of the month.
It’s 11:00 p.m. Thursday night, and the ES made a high at 6990.00 and is trading 6982.50, up 1 point with only 15,219 contracts traded. After five higher closes in a row, I can’t rule out some type of pullback — but I still think the ES and NQ are going higher.
As I said earlier this week, while I think the ES is going to make new all-time highs, I don’t think it’s going to trade to ES 7100, but I also can’t rule it out.
Our lean: Buy the pullbacks — whether it’s a 20-point pullback or a 40-point pullback, it should get bought. And the lower volumes should help that cause.

Guest Posts:
 |
Get instant access to our partners’ real-time market data and insights not available anywhere else. Here is last night's Founder’s note getting you ready for today’s market and explaining the constraints in yesterday’s market. - MrTopStep
Founder's Note:
Futures are flat with no major data on tap.
The big story from Xmas Eve was the apparent destruction of Captain Condor, and his crew. Wednesday PM marked their 6th daily loss in a row, and with that we hear rumors of catastrophic losses for many in Captains paid community. The only thing we know for fact is that there was no doubling down from the 90k-contract loss on Wednesday to a ~180k contract position for today. This is the proof that Condor is gone.
There is one last, but very interesting element on the trade: Our data showed that the liquidity providers for Wednesday's 90k lot was 1/2 market maker, and 1/2 banks. We can't recall having seen the liquidity being provided by two entities like that, and it suggests that the size was so large it was having to be laid off amongst liquidity providers. That, in turn, implies that had Captain even had the capital to go another round to 180k contracts, that they may not have been able to source the counter-party for that trade. Maybe the casino would have cut them off...
Turning to current positioning:
Resistance: 6,950, 6,975, 7,000
Support: 6,900
We don't expect much from markets for today. The key level here now for the SPX is 6,950. Above that level we think the JPM 7,000 strike, 12/31 exp gamma will "grab hold" and pin the market in. Below that strike, as shown in TRACE, is negative gamma. For this reason, we raise our Risk Pivot to 6,890.
If the SPX breaks <6,900, we'd look for a test of 6,850. While that expected gap down is only ~1% (to start), we'd start to be wary of a regime shift in equities wherein the supportive OPEXMas flows are gone. So taking a "stability check" from an opening selling salvo would be critical.
Remember too that IV is now at an absolute lower bound (we've seen 4% IVs !), which signals that "vol up" has a faster path than "vol down". That doesn't mean vol has to jump today, but it does mean that downside could be a bit quicker if vol reprices to something more normal.

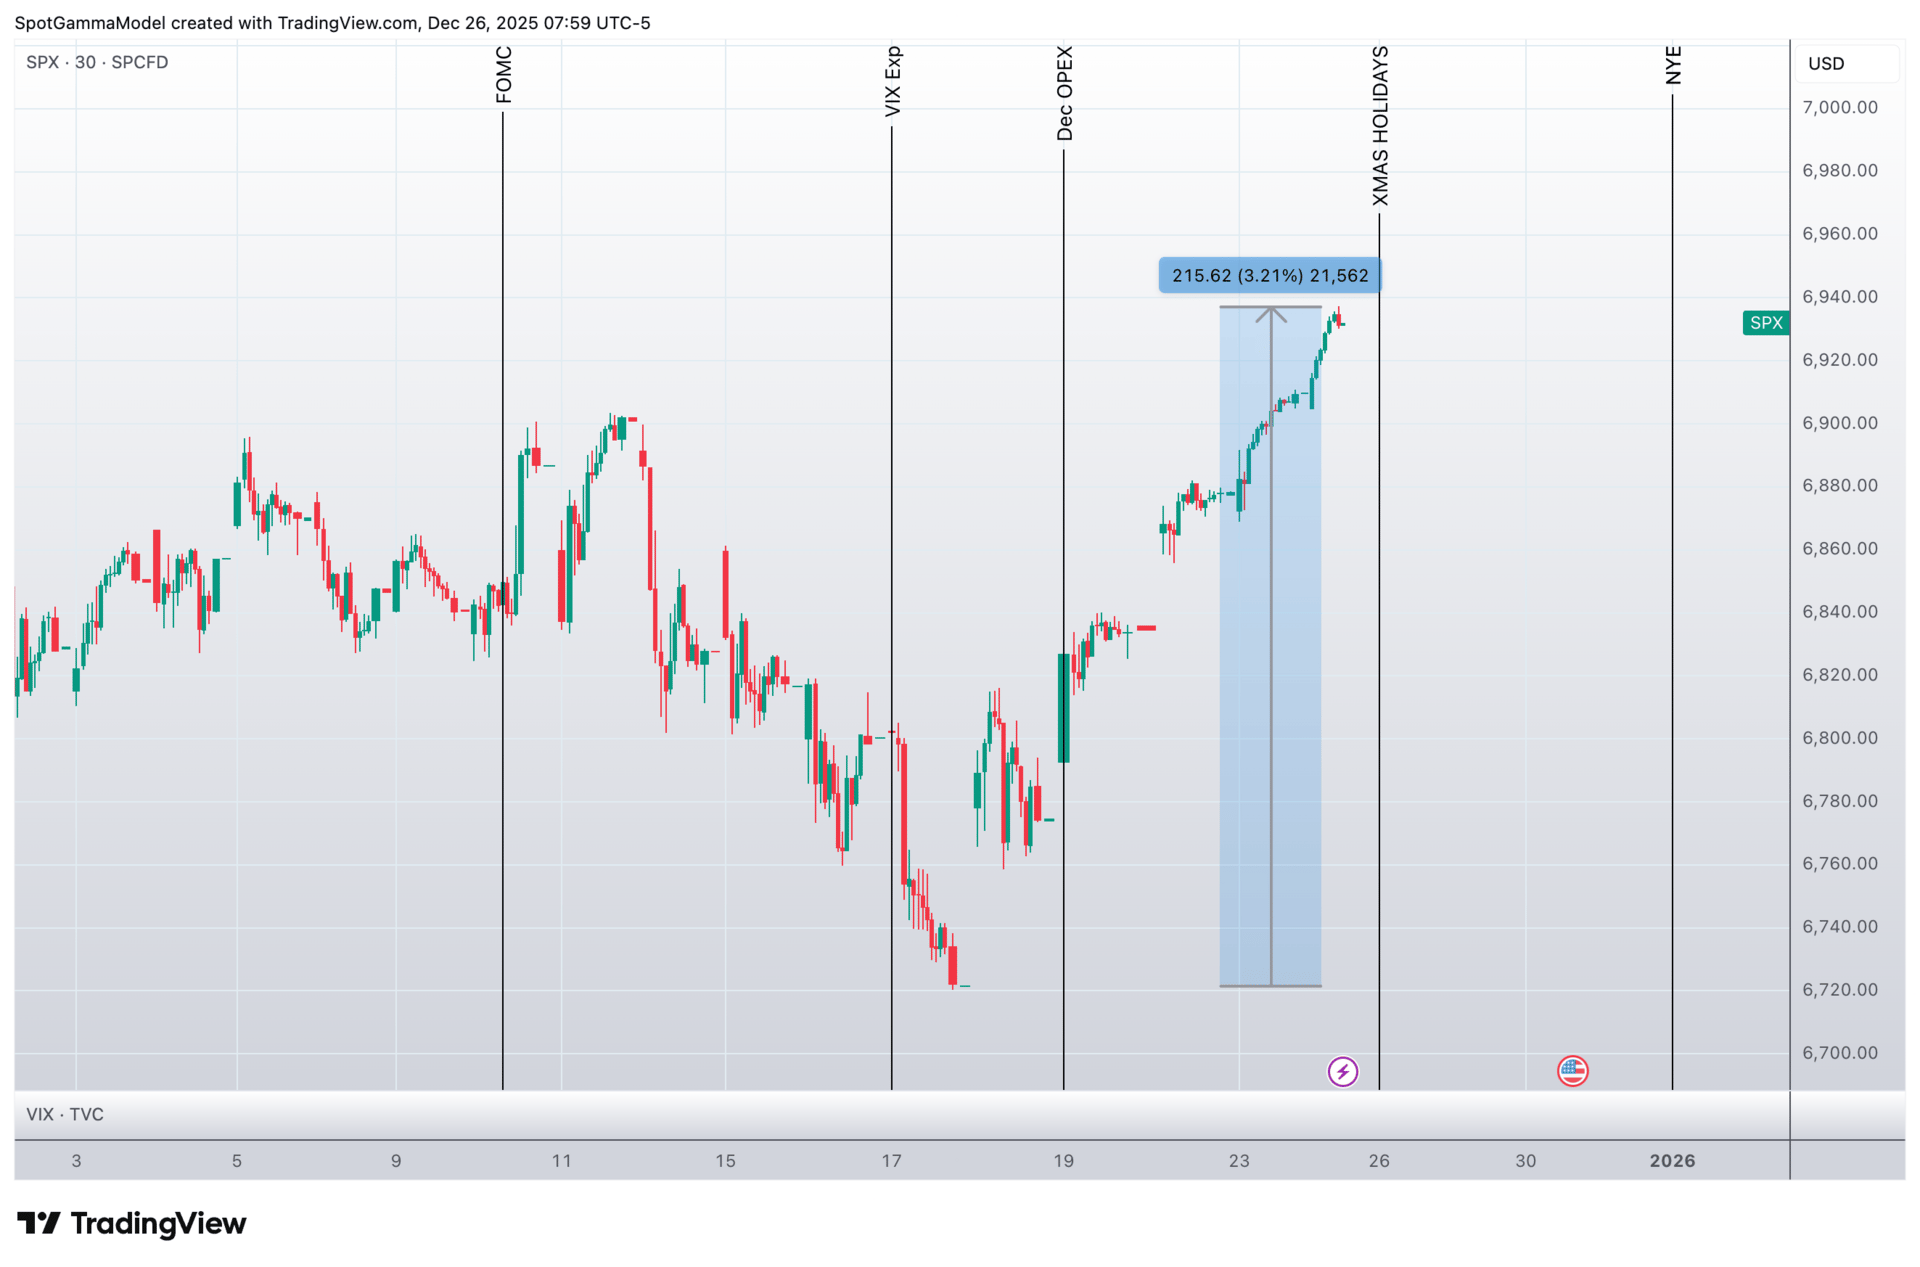
On the topic of OPEXMas, today does mark the closing of the bullish period we marked into last weeks expiration(s). You can see below that the SPX made a low on VIX Exp, and has subsequently traded higher each day, realizing +3% & new SPX all time highs. The closing of this window, which unironically syncs with extreme IV lows, removes our desire to lean bullish. We will still look to have some cheap exposure on to play a move into the JPM 7k strike for 12/31, but our positioning will start to look much more neutral in price direction into Monday. At any point if SPX breaks <6,900, we'll look to lean to the downside.
©2025 TenTen Capital LLC DBA SpotGamma
©2025 TenTen Capital LLC DBA SpotGamma©2025 TenTen Capital LLC DBA SpotGamma
Get instant access to our partners real-time market data and insights not available anywhere else. Here is last night Founder’s note getting you ready for today’s market and explaining the constraints in yesterday’s market. - MrTopStep
Market Recap
The ES traded down to 6952.50 on Globex and opened Wednesday's regular session at 6959.00, down 1.5 points or -0.02%. After the open, the ES traded 6957.00 and slowly ground its way up to 6985.50 at 11:45. It pulled back a few points, then traded up to the high of the day at 6988.00 at 12:30, pulled back again, and settled at 6982.50 on the early close, up 21.50 points or +0.31%.
That marks five sessions in a row of gains, for a total gain of 204 points or +2.2%, and puts the ES only 31.50 points off the all-time contract high at 7014.00.
The NQ settled at 25,880.50, up 68.25 points or +0.26%, also up five straight sessions for a total gain of 1,081.75 points or +3.89%, 789.50 points off its all-time contract high of 26,670.00.
In the end, the ES drifted higher all day. In terms of the ES's overall tone, it acted firm throughout the session. In terms of the ES’s overall trade, total volume for the holiday-abbreviated session was low at 457k contracts traded.
There are no scheduled economic reports or Fed speak today.
The two stories below are from Goldman Sachs and Moody’s. I used AI to summarize both stories.
Goldman Sachs expects layoffs to keep rising and says investors are punishing the stocks of companies that slash staff
Investors are punishing companies for layoffs, even those framed as strategic or AI-driven restructuring, because they no longer trust the "benign" reasons given, seeing them as cover for underlying financial issues like rising costs, leading to stock drops instead of the typical positive reaction, a shift Goldman Sachs notes as companies face pressure to cut costs amid higher expenses, even as CEOs tout AI efficiency gains as a positive, creating a disconnect between PR and market perception.
The Old vs. New Layoff Narrative:
Historically: Layoffs for restructuring often boosted stocks; layoffs for poor performance (declining sales) hurt them.
Now: Even AI/tech-driven layoffs (restructuring) are punished, suggesting investors see them as a sign of weakness, not strength, according to Goldman Sachs analysts.
Why the Change?
Lack of Trust: Investors doubt the "benign" justifications, sensing companies are hiding deeper financial troubles like increased debt, capex, and interest expenses, according to AOL.com.
Negative Signals: The market interprets these cuts as a negative signal about future prospects, even with AI boasting.
The CEO & AI Paradox:
"Badge of Honor": Some CEOs, like Amazon's Andy Jassy, frame AI-driven workforce reduction as positive efficiency, making fewer employees a status symbol, reports Fortune.
Mixed Signals: Yet, companies like Klarna reversed AI hiring freezes, prioritizing human customer contact for brand image, showing a balancing act.
Future Outlook:
Goldman Sachs anticipates continued layoffs, partly driven by AI cost-cutting, but the market's skeptical view of these actions is a key trend to watch
Moodys offers a sobering view of Fed's rate cuts. The signal is quiet, but the implications aren't.
Key Points
The Fed cut rates three times in 2025, ending at 3.50% to 3.75%.
Mark Zandi drops a sharp take on Fed rate cuts.
Fed and big banks expect only one or two modest rate cuts in 2026
Covering the markets during the Covid pandemic years felt like a crash course on how quickly markets can change.
Interest rate hikes came quickly and hard, and inflation refused to cooperate, leaving the Federal Reserve feeling stuck in emergency mode.
However, the emergency phase is over, with inflation cooling from its peak, and the economy proving its resilience. That progress continues to fuel growing optimism that the Fed will continue easing into next year.
Fed rate cut recap for 2025
Most of 2025: The Federal Reserve (the Fed) kept rates steady at 4.25% to 4.50% before the easing cycle finally started.
Sept. 17, 2025: Cut a quarter point to 4.00% to 4.25% (effective Sept. 18).
Oct. 29, 2025: Cut another quarter point to 3.75% to 4.00% (effective Oct. 30).
Dec. 10, 2025: Cut a quarter point to 3.50% to 3.75%.
In conclusion: Three quarter-point cuts in 2025, taking the policy range down to 3.50% to 3.75% by the close of the year.
Source: Federal Reserve
Moody’s Mark Zandi still moves the rate-cut conversation
Mark Zandi is chief economist at Moody’s Analytics, where he runs the firm’s economic forecasting shop and hosts the Inside Economics podcast. He also co-founded Economy.com, which Moody’s scooped up back in 2005, placing Zandi at the intersection of data, markets, and policy.
Over the years, his calling card has been making audacious calls on the economy. A case in point: Zandi flagged the 2007 housing market collapse at a time when most were still calling it a bubble—a stance that helped build his stock when the recession hit.
In recent comments, Zandi suggested the Fed is likely headed to deliver multiple rate cuts in 2026, not because the economy is booming, but because he feels it’s stuck in a delicate balance.
Growth has held up, layoffs remain low, and the long-talked-about recession hasn’t arrived. At the same time, though job creation has slowed down, unemployment is edging higher, and inflation is still running above the Fed’s comfort zone.
In Zandi’s view, that strange combination points to a gradual, cautious rate path ahead instead of an aggressive cutting cycle.
MiM
Market-On-Close Recap
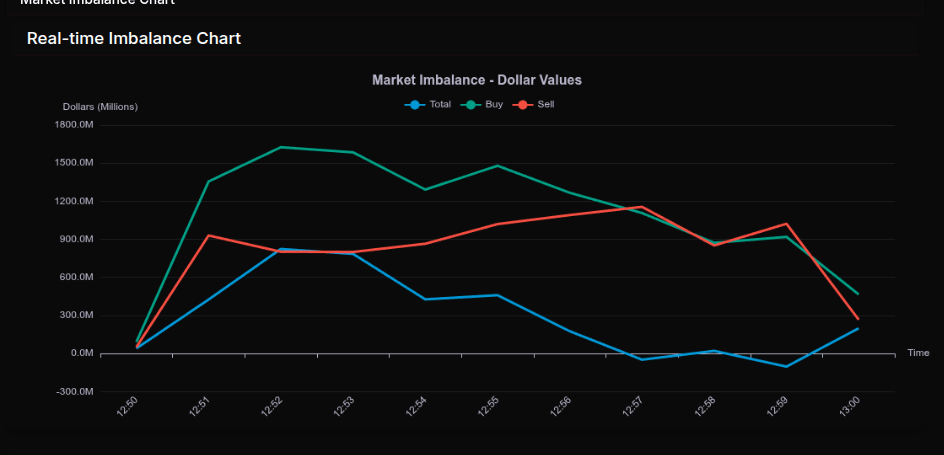
The Market-on-Close auction opened with a firm buy-side tone and carried that bias through much of the session, though the path was anything but linear. Early snapshots showed strong aggregate demand, with total imbalances quickly expanding as buy programs overwhelmed sell interest. Around 12:52–12:53, buy dollars peaked north of $1.6B, pushing net imbalance well above $800M and confirming a broad-based institutional bid rather than isolated stock activity.
As the auction matured, the flow transitioned into a more rotational phase. Net totals compressed, and by 12:57 the tape briefly flipped negative, highlighting late sell programs probing liquidity rather than outright distribution. That late wobble proved temporary, with the final reads stabilizing back toward a modest net buy, consistent with positioning rather than risk-off behavior.
Sector activity was decisive. Technology dominated the tape with over $308M in net buy imbalance and a +77% dollar lean, signaling wholesale accumulation rather than rotation. Financial Services followed with nearly $100M net buy, though the internal skew suggested some offsetting sell pressure beneath the surface. Industrials also attracted meaningful demand, reinforcing the pro-cyclical tone. On the defensive side, Healthcare, Consumer Defensive, and Real Estate all posted solid positive leans above +50%, pointing to broad participation rather than a narrow growth chase.
By contrast, Utilities and Energy stood out on the sell side, both registering leans worse than -60%, a clear sign of institutional supply and relative underperformance. Consumer Cyclical finished slightly negative overall, masking heavy two-way flow and rotation within the group rather than outright liquidation.
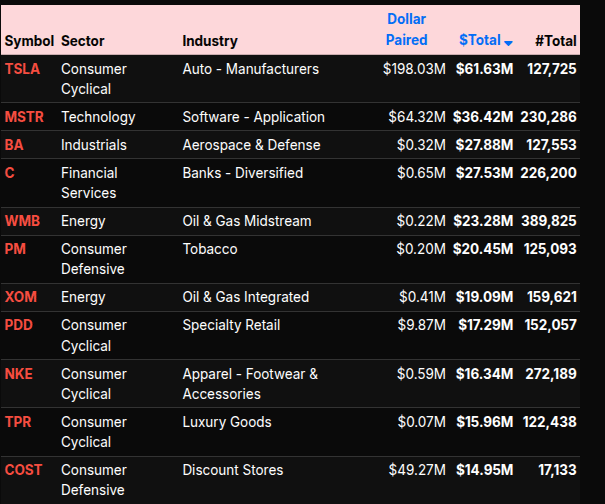
Single-stock flows reinforced the sector story. Mega-cap technology, led by NVDA and other semiconductors, absorbed substantial buy interest, while TSLA dominated the cyclical tape with outsized volume and dollar flow. Financials saw targeted buying in capital markets names, adding weight to the S&P and Nasdaq imbalance totals.
Overall, the MOC reflected controlled accumulation into the close. Strong >66% buy leans in Technology and selective cyclicals pointed to conviction, while near-50% readings elsewhere underscored rotation rather than panic. The auction closed with buyers firmly in control, albeit with enough late volatility to remind traders that liquidity, not direction, was the real story.


BTS Trading Levels - (Premium Only)

ES Levels

The bull/bear line for the ES is at 6977.50. This is the key pivot for today’s trade and defines near-term directional bias.
ES is currently trading around 6978.50, just above the bull/bear line. Holding above 6977.50 keeps the door open for continuation higher, but acceptance is required given the recent vertical push.
On the upside, initial resistance is at 6988.00, followed by 7011.00, which is the upper range target for the session. If ES can build value above 7011.00, extension toward 7042.50 becomes possible, though that would likely require stronger participation.
On the downside, failure to hold 6977.50 puts focus on 6959.50 and then 6952.50. A deeper pullback targets 6944.00, which is the lower range target and key support for buyers to defend.
Overall, the ES remains constructive above 6977.50, but after the sharp rally, two‑way trade and rotation should be expected unless price can cleanly accept above 7011.00.
NQ Levels

The bull/bear line for the NQ is at 25,862.25. This is the key pivot for today. Acceptance above this level keeps the bias constructive, while sustained trade below it shifts control back to sellers.
NQ is currently trading around 25,875.25 in the Globex session, holding just above the bull/bear line. As long as price remains above 25,862.25, buyers can press for a rotation higher toward 25,892.00 and then 26,012.75, which is today’s upper range target.
If the market fails to hold 25,862.25, look for downside rotation toward 25,815.75, followed by 25,777.50. The lower range target for the session sits at 25,711.50 (pS-25,7115). A clean break and acceptance below that level opens the door for a deeper test toward 25,569.75 and potentially the lower balance area near 25,485.
Overall, the NQ remains balanced-to-bullish above 25,862.25. Below that level, expect increased two-way trade with downside pressure toward the lower targets.
Technical Edge
Fair Values for December 26, 2025
SP: 47.09
NQ: 203.39
Dow: 272.4
Daily Breadth Data 📊
For Wednesday, December 24, 2025
• NYSE Breadth: 66% Upside Volume
• Nasdaq Breadth: 51% Upside Volume
• Total Breadth: 53% Upside Volume
• NYSE Advance/Decline: 68% Advance
• Nasdaq Advance/Decline: 63% Advance
• Total Advance/Decline: 65% Advance
• NYSE New Highs/New Lows: 91 / 20
• Nasdaq New Highs/New Lows: 162 / 177
• NYSE TRIN: 1.09
• Nasdaq TRIN: 1.50
Weekly Breadth Data 📈
Week Ending Friday, December 19, 2025
• NYSE Breadth: 48% Upside Volume
• Nasdaq Breadth: 51% Upside Volume
• Total Breadth: 50% Upside Volume
• NYSE Advance/Decline: 43% Advance
• Nasdaq Advance/Decline: 39% Advance
• Total Advance/Decline: 40% Advance
• NYSE New Highs/New Lows: 233 / 98
• Nasdaq New Highs/New Lows: 352 / 554
• NYSE TRIN: 0.81
• Nasdaq TRIN: 0.60
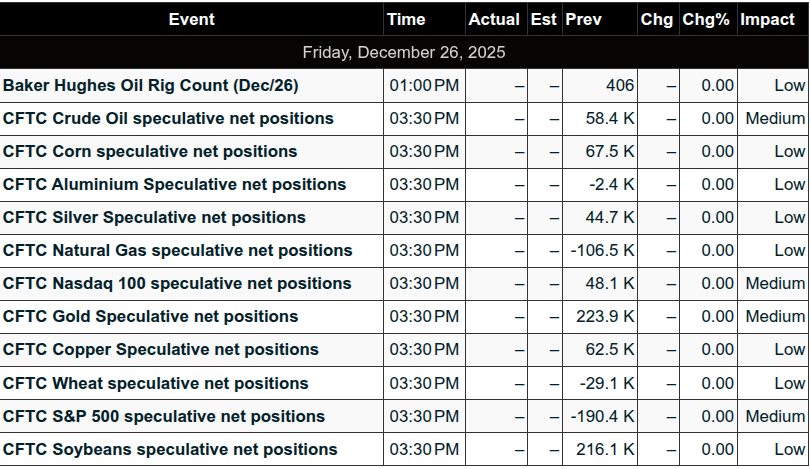
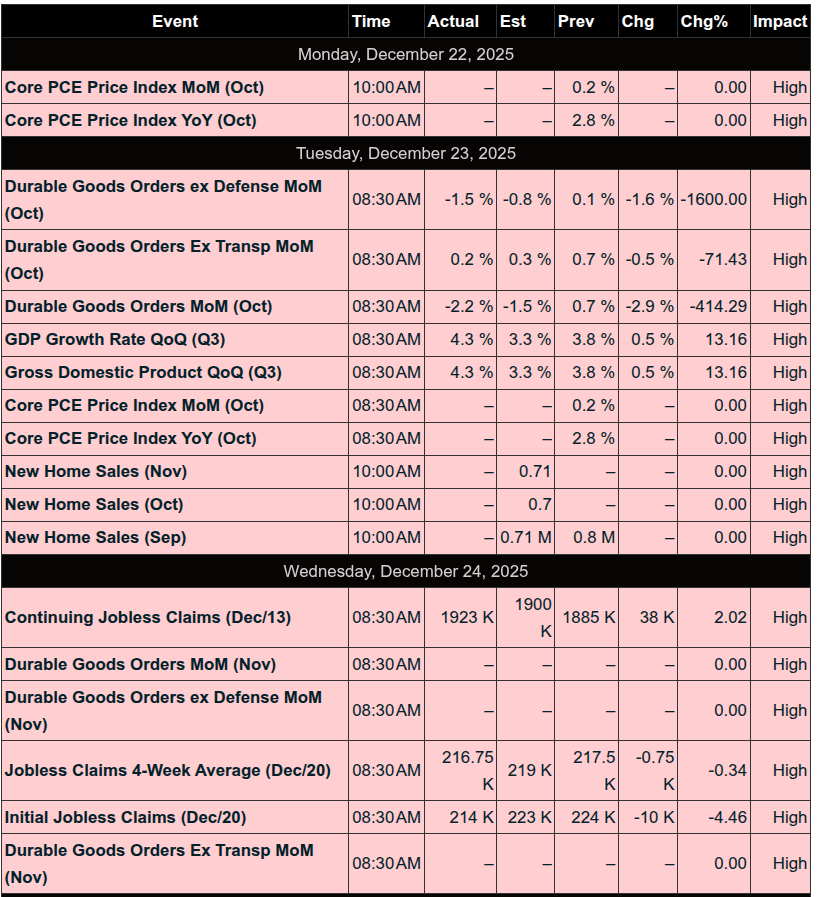
Calendars
Economic Calendar Today
This Week’s High Importance
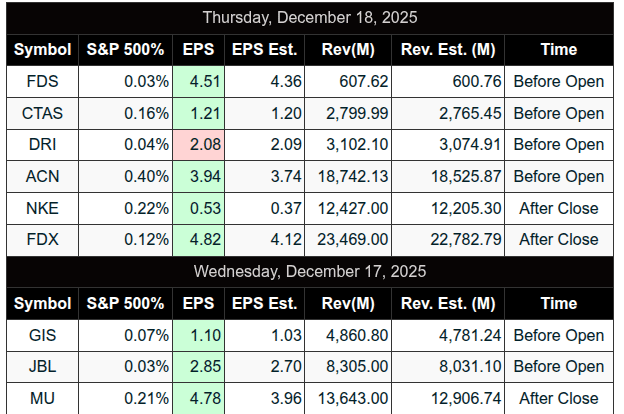
Earnings:
Upcoming:
None
Recent:
Trading Room News:
Polaris Trading Group Summary - For Wednesday, December 24, 2025
Despite some technical hiccups and the shortened holiday schedule, the PTG community wrapped up the year with professionalism, camaraderie, and some solid market insights. Here's how the day unfolded:
Connectivity Issues
PTGDavid experienced a full connectivity outage starting Tuesday at 1:38 PM and lasting until nearly midnight. As a result, no Daily Trade Strategy (DTS) briefing was issued for Wednesday.
David mentioned potentially adding Frontier as a secondary failsafe going forward — a good lesson in redundancy for all traders relying on internet connectivity.
Tuesday Recap (Dec 23rd)
Textbook Cycle Day 2:
Price action perfectly respected the stated levels:
Upside target: 6957 (hit)
Downside edge: 6915
Line in the Sand at 6925 held multiple times, reinforcing bullish conviction.
This is a solid lesson in trusting the framework and trading level-to-level.
Christmas Eve Market Expectations
David warned of progressively declining activity and minimal volatility due to the early market close.
Despite the holiday calm, Cycle Day 3 Penetration Target at 6979 was fulfilled, demonstrating that key levels can still hit even on slow days.
Community and Culture
David took a heartfelt moment to thank the community, celebrating PTG’s 12th year and introducing “Allison Ivy (AI)” (aka “Allie”) to the DTS content creation team.
The chat was filled with good cheer, humor, and seasonal greetings. Traders chimed in with:
“Merry Christmas” wishes
Banter about “Money Boxes” vs. “Coal Boxes”
David’s closing remark: "MERRY CHRISTMAS TO ALL...AND TO ALL A GOOD NIGHT!"
Trades & Market Action
Bosier was actively managing a pair trade (short ES / long CL):
Multiple entries and scale-ins across both contracts
Average ES short around 69.5 and several CL longs from .53 down to .22
Although he reported being down on both legs at one point, it was clear this was more of a position trade than a scalp — a reminder of trade context and timeframes.
David commended the CL entries initially before realizing the full picture, providing a bit of levity (“I need to put on my glasses!”).
Lessons & Highlights
Trusting the levels pays off — Tuesday’s price action hit all key zones.
Expect the unexpected with tech — consider redundancy for trading setups.
Even on low-volume days, targets can still hit — don't dismiss setups.
Pair trades require patience and clarity on structure and timeframe.
The PTG culture remains strong, with gratitude, education, and some holiday fun — wrapping up 2025 on a high note.
Positive Outcomes
Cycle Day 2 and 3 targets achieved with precision
Active community engagement and mutual support
Reinforced education through live trade discussion and post-analysis
DTG Room Preview – Friday, December 26, 2025
Santa Claus Rally Continues:
All major U.S. indexes closed at record highs on Christmas Eve.
S&P 500 up 18% YTD — on track for 6 of the last 7 years with >15% gains.
Bullish momentum persists despite fading expectations for 2026 rate cuts.
Fed Watch:
2025 marked by internal conflict at the Fed over its dual mandate.
Fed Chair Powell secured consensus for 3 rate cuts this year; next year may be more challenging.
Rising unemployment (4.6%, 4-year high) and weak hiring add pressure.
Layoffs Surge:
Major job cuts from Amazon, Microsoft, Meta, UPS, Target, Verizon, and Nestle.
Hiring rates at decade lows, comparable to 2013 and pandemic-era 2020.
Precious Metals Soar:
Silver surging above $75/oz in an exponential move.
Gold remains a global safe haven amid political and economic instability.
Central banks and investors continue to stockpile.
Weather & Trading Conditions:
Major snowstorm in NYC causing 400+ flight cancellations/delays.
Holiday-shortened week + storm = light trading volume expected.
Volatility remains compressed; ES 5-day average range at 62.25 points.
ES Futures Overview:
Trend: Holding mid-channel in short-term uptrend.
Resistance: 7075–7080, 7488–7493
Support: 6814–6819, 6690–6695, 6341–6346
50-day MA: 6863 acting as loose support.
No overnight whale activity; neutral bias.
Calendar:
No major earnings or economic data today.
Market remains in low-volume, low-volatility holiday mode.


Affiliate Disclosure: This newsletter may contain affiliate links, which means we may earn a commission if you click through and make a purchase. This comes at no additional cost to you and helps us continue providing valuable content. We only recommend products or services we genuinely believe in. Thank you for your support!
Disclaimer: Charts and analysis are for discussion and education purposes only. I am not a financial advisor, do not give financial advice and am not recommending the buying or selling of any security.
Remember: Not all setups will trigger. Not all setups will be profitable. Not all setups should be taken. These are simply the setups that I have put together for years on my own and what I watch as part of my own “game plan” coming into each day. Good luck!!
Follow @MrTopStep on Twitter and please share if you find our work valuable!