- The Opening Print
- Posts
- The War Is Not Over, Rates Are not Friendly, But the Tape’s Still Got Teeth Above 6600
The War Is Not Over, Rates Are not Friendly, But the Tape’s Still Got Teeth Above 6600
Danny Riley
March 25, 2026
Follow @MrTopStep on Twitter and please share if you find our work valuable!
FREE Two-Week Offer for the Opening Print Premium. Open up the Lean and other premium features for the next Two Weeks!
Our View
When I got long after the open, I had a feeling the markets were going to rally. After I stepped away and came back, I saw how the ES had rallied and was holding 6600 on the dips. I told the PitBull the ES was holding for a reason, and obviously, the late headline was just that.
It's very hard to think there wasn't a 'major front running' going on. I know I have said the war is not over, but I have also thought it would be OK to be wrong about it—that the end of the war would be good for the entire world.
Is it over? I don’t know, but according to Iran, it has not accepted the ceasefire and continues to reject it in its current form. It insists it never asked for a ceasefire and is not seeking one right now. Foreign Minister Abbas Araghchi stated that Iran is ready to defend itself “as long as it takes” until the U.S. and Israel recognize this as an “illegal war with no victory,” while demanding a complete and permanent end to the war—not a temporary 30-day pause—along with payment of reparations and firm international guarantees against future attacks. Iranian officials also declare there is “no room for ceasefire talks” while U.S. and Israeli military strikes continue, and vow to keep fighting until their conditions are fully met.
What we do know is that the US and Israel have done a ton of damage. While I want the war over, I also think that thinking it’s one and done is 'fool’s gold'.
Our View
The Eye Of The Storm
What's the old saying? It isn't over until the fat lady sings? Well, the fat lady isn't singing, and while the war may be front and center, there is another problem on the long list of many.
Apollo Global Management's chief economist, Torsten Sløk, is warning of a $14 trillion "debt wave" of corporate debt maturing by 2026, forcing companies to refinance at much higher interest rates. This surge in borrowing costs, combined with persistent inflation and a "fragile" market structure, threatens to disrupt stock gains, heighten default risks, and force a significant re-evaluation of risk assets. Increased volatility and excessive derivatives activity are reducing stability, making the financial system vulnerable and keeping interest rates high.
As the US debt sits just above $39 trillion, I asked Grok what the monthly and yearly interest payments would be, and it’s pretty astounding. Interest payments have nearly tripled since 2020 due to higher debt and elevated interest rates. They are now one of the largest items in the federal budget. Yearly interest is projected at $1.2 trillion in 2026, with monthly interest averaging roughly $83–110 billion depending on the exact month.
One Day At A Time
Our Lean — Danny’s Trade (Premium only)

Market Recap
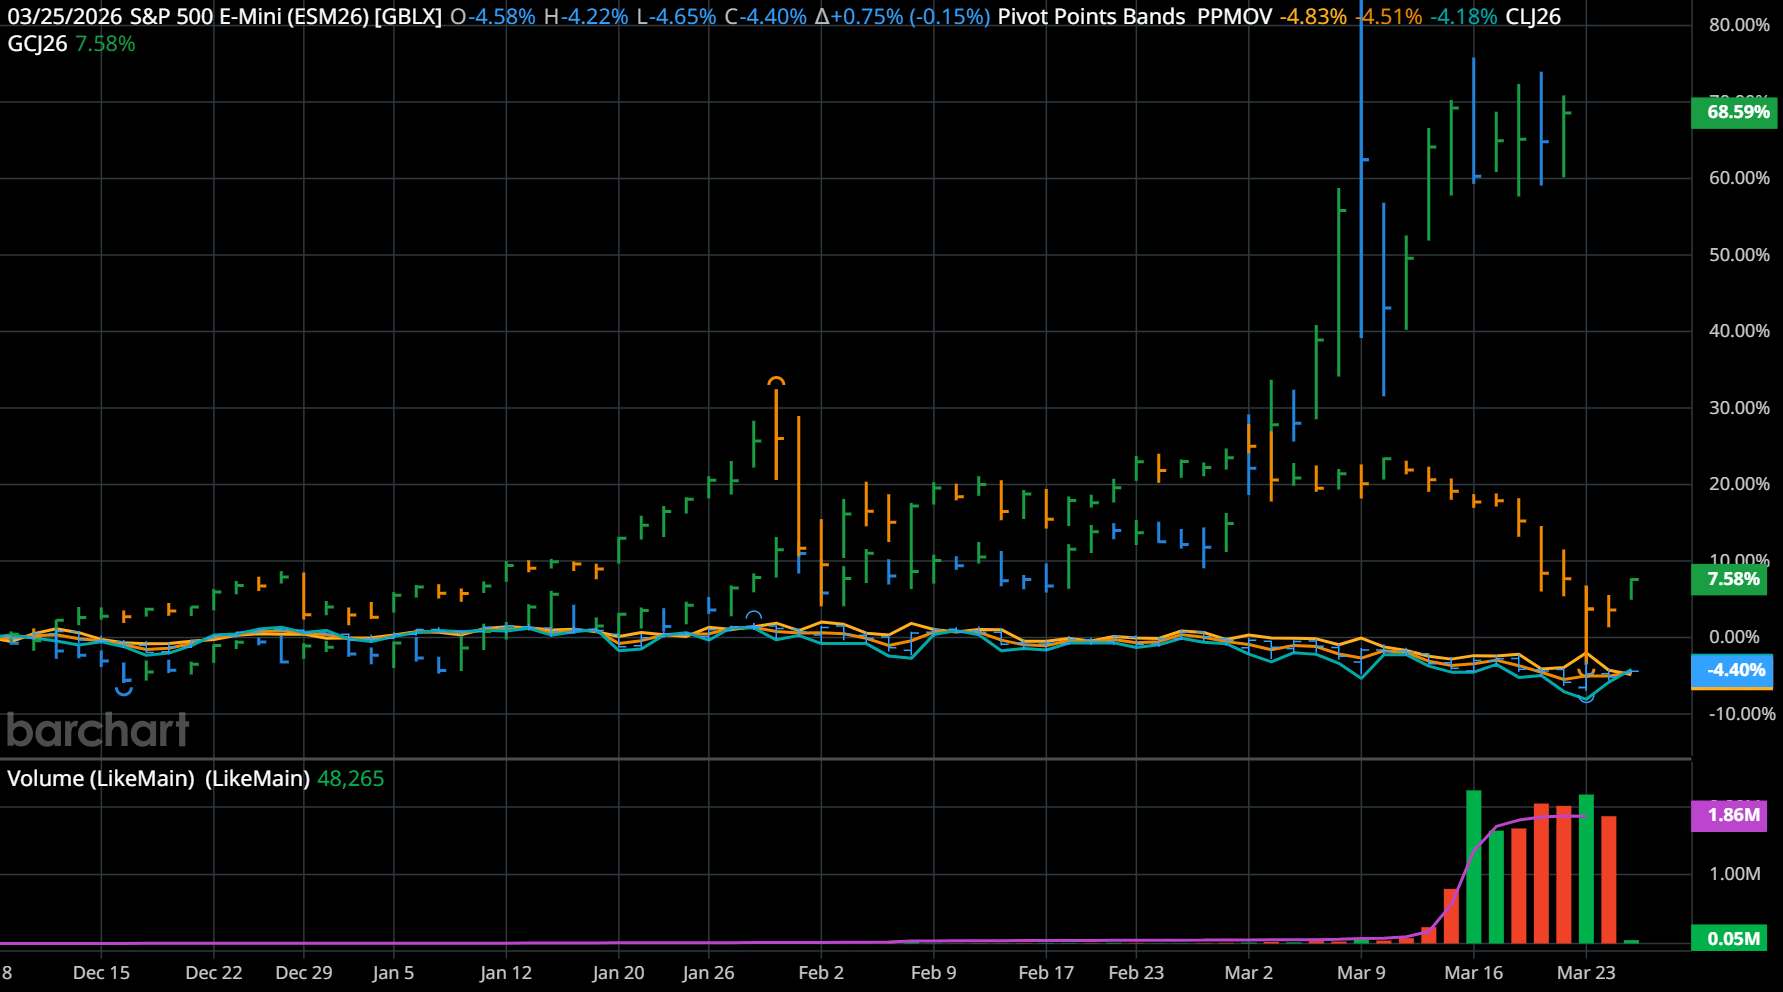
Above is a 1 Day ESM, CLJ and GCJ Comparison Chart.
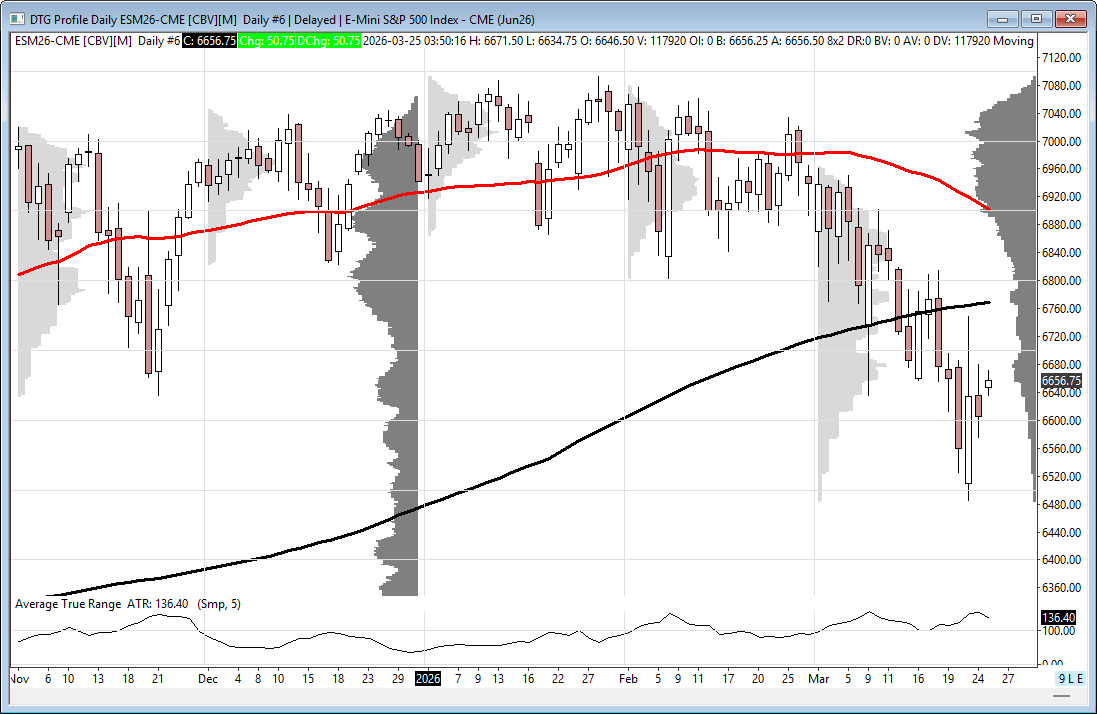
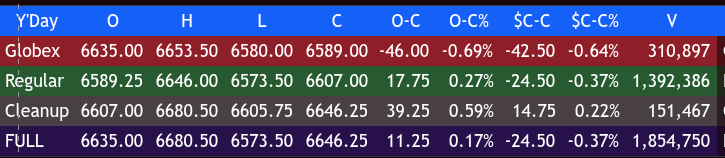
After Monday's rally, the ES gave up the farm late in the day. The ES made a high of 6635.50 and a low of 6580.00 with 315k contracts traded, less than half of Monday's Globex volume, and opened Tuesday's regular session at 6589.25, down 42.25 points or -0.42%.
After the open, the ES traded down to 6584.00, rallied up to 6606.00, sold off down to 6573.50 at 9:42, rallied up to 6691.75, and sold off back down to the low at 6573.50 at 9:50. That's when I put this out in the chat: [9:56:16 AM]: "rip coming."
At 10:50, the ES traded 6635.25, sold off down to 6599.50, made 3 lower highs, and then rallied up to 6643.75 at 11:25. It pulled back to 6628.25 at 11:30, rallied up to another new high at 6646.00 at 11:50, and dropped down to 6618.00 at 12:05.
It then rallied up to a lower high at 6638.00 at 12:20, sold off down to 6598.50 at 1:45, rallied back up to 6625.50 at 2:00, pulled back down to 6607.00 at 2:15, and rallied up to 6641.75 at 2:35. It then sold off down to 6619.50 at 2:55, sold off further to 6606.50 at 3:47, and traded at 6610.50 as the 3:50 cash imbalance showed $350 million to sell.
The ES sold off down to 6600.25 at 3:58 and traded 6607.00 on the 4:00 cash close. After 4:00, the ES traded up to 6615.25 by 4:15 and then rallied 65.25 points up to 6680.50 after a headline hit saying: "ISRAELI CHANNEL 12: A CEASEFIRE FOR A PERIOD OF ONE MONTH WILL BE ANNOUNCED ACCORDING TO A MECHANISM THAT WITKOFF AND KUSHNER ARE WORKING ON."
It sold off down to 6642.50 at 4:30, rallied up to a lower high at 6677.75 at 4:45, and settled at 6628.50, up 15.75 points or 0.24%. The NQ (Nasdaq 100) settled at 24,281.00, up 22.75 points or 0.09%; the YM (Dow Jones) settled at 46,693.00, up 171 points or 0.37%; and the RTY (Russell 2000) settled at 2550.80, up 41.20 points or 1.64% on the day.
In the end, it was another day of "headline hell." In terms of the ES's overall tone, it held together all day. In terms of the ES's overall trade volume, it was heading toward one of the lowest volume sessions in several days until the late headline pushed it up to 1.859 million contracts traded.
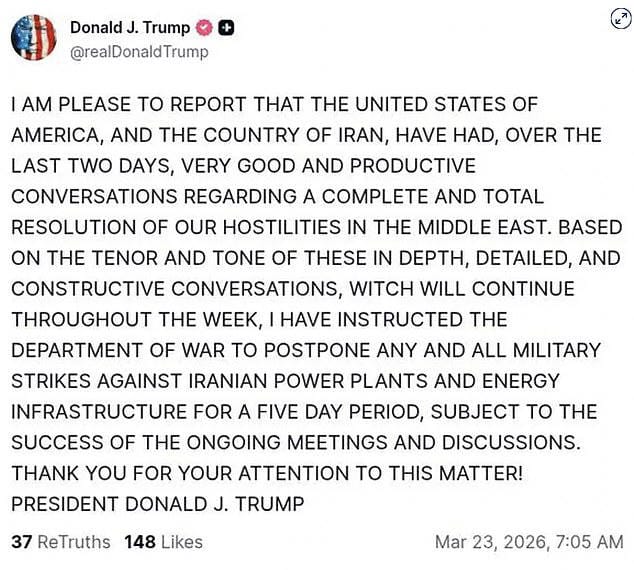
Trump’s “Nancy Pelosi Front-Running Law” / Stop Insider Trading Act
During his State of the Union address, Trump called for Congress to pass the Stop Insider Trading Act (also referred to as the PELOSI Act – Preventing Elected Leaders from Owning Securities and Investments). The bill aims to ban members of Congress, their spouses, and dependents from trading individual stocks to prevent the use of non-public information. Trump directly targeted Nancy Pelosi in his remarks while urging its passage.
But since Trump took over the White House for his second term, front-running has run rampant, and it has almost become a daily event. Below are just a few we know about. but Trump's 7:05 post on Truth Social was one for the record books!
U.S. Officials & Congressional Aides Stock Sales Before Tariff Announcements (Feb–May 2025)
Trump “Great Time to Buy” Post Before Tariff Pause (April 9–10, 2025)
White House Officials Allegedly Tipping Wall Street on Trade Deals/Tariffs (2025)
Polymarket Anonymous Bet on Maduro’s Capture (January 2026)
Sen. Markwayne Mullin Chevron Stock Purchase Before Venezuela Operation (December 2025)
Unusual Oil Futures & Stock Volume Surge Before Trump Iran/Middle East Policy Post (March 2026)
Polymarket Bets on U.S. Strikes on Iran (Early 2026)
Congressional Stock Trades Timed Around Tariff Volatility (March–June 2025)
Nancy Pelosi / Paul Pelosi Stock Trades & Options Activity (Ongoing 2025–2026)
But Trump's 7:05 post on Truth Social was one for the record books!
Before Trump's post:
Brent and WTI Oil Chart
The most recent example of trades was spotted by the X account Unusual Whales, which specializes in tracking "unusual" trading activity. "Just five minutes before Trump's announcement to halt the attacks on Iran, massive trades reportedly hit the market. In one move, $1.5 billion in S&P 500 (ES) futures was bought while $192 million in oil (CL) futures was sold," the account stated.
Then, at 7:05 am, roughly 15 minutes later, Trump posted his announcement. S&P 500 futures surged more than 2.5 percent before the opening bell, while oil prices plunged, with West Texas Intermediate futures falling nearly 6 percent in the immediate aftermath.
But it didn't just show up in the futures markets. On the crypto-based platform Polymarket, a cluster of newly created accounts placed unusually large wagers over the weekend on the likelihood of a US-Iran ceasefire. Eight accounts, all reportedly created around March 21, collectively staked nearly $70,000 on a ceasefire occurring before March 31. If successful, those bets could return close to $820,000.
My guess is this is going to continue right into the end of Trump's term, but clearly no one in the government is doing anything about it, nor does it look like they will.
Guest Posts
Guest Posts — Polaris Trading Group
S&P 500 (ES)
⚠️ Tactical Takeaway
Of course, nothing changes for PTG…Simply follow your plan. Take only Triple A setups and manage the $risk. ALWAYS HAVE HARD STOP-LOSSES in-place on the exchange.
PTG’s Primary Directive (PD) is to ALWAYS STAY IN ALIGNMENT with the DOMINANT FORCE.

— PTG
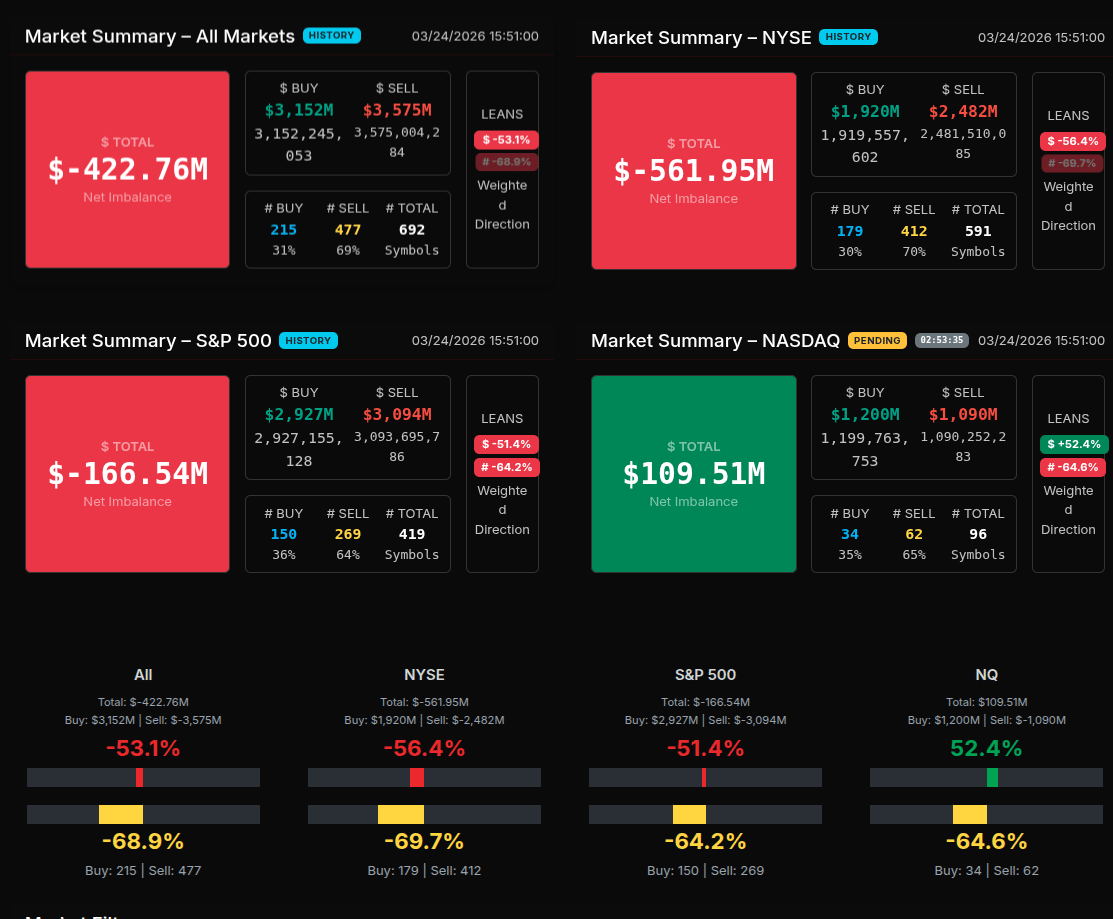
MOC Recap
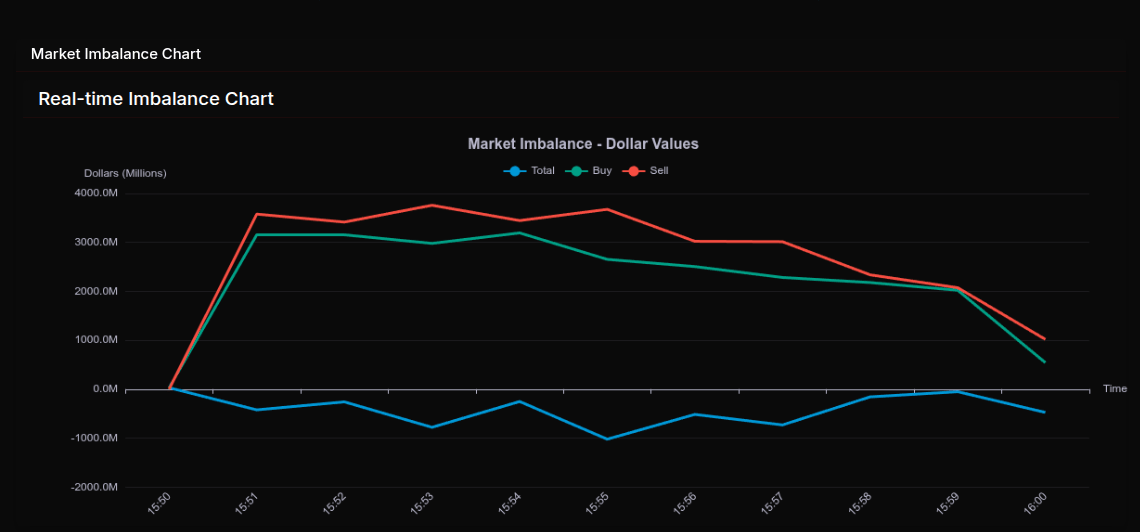
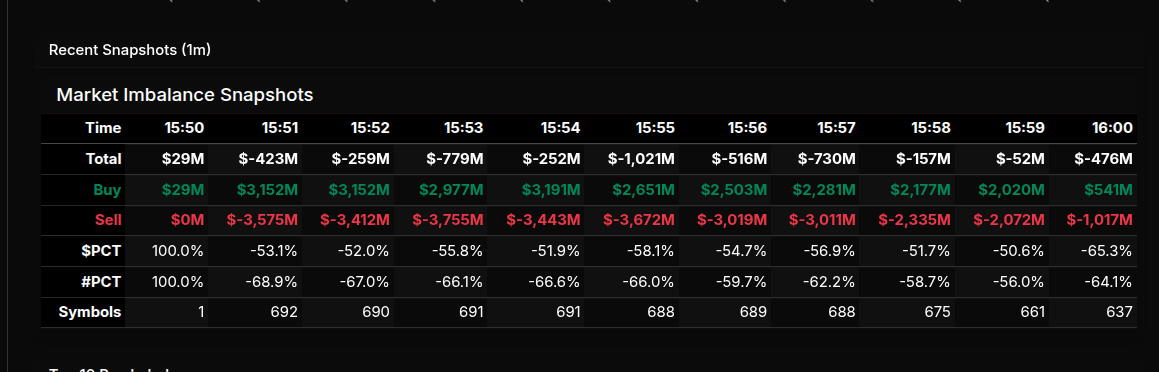
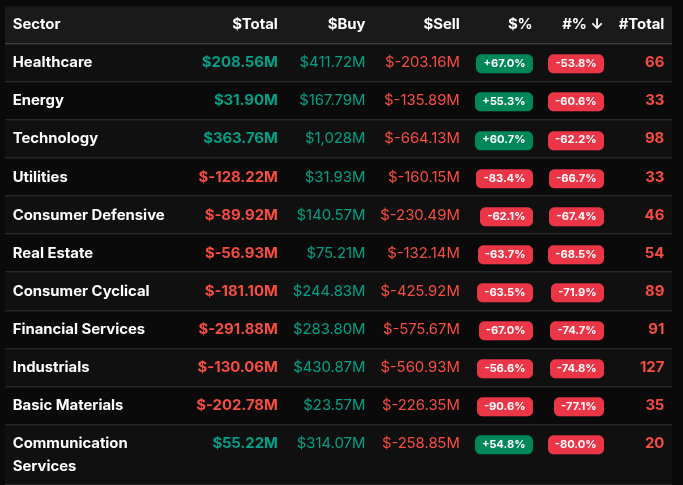
The MOC session opened with an immediate and aggressive sell-side tone, as early snapshots flipped sharply negative after the 15:50 print. What began as a modest +$29M imbalance quickly transitioned into heavy institutional distribution, with the market hitting -$423M by 15:51 and extending to a low of roughly -$1.02B by 15:55. This established a clear sell program environment, with sustained pressure rather than a transient rotation.
Throughout the imbalance window, sell flow remained dominant, with $PCT consistently holding below -50% and closing near -65.3%, while breadth (#PCT) confirmed participation, sitting near -64%. This indicates broad-based liquidation rather than isolated sector rotation.
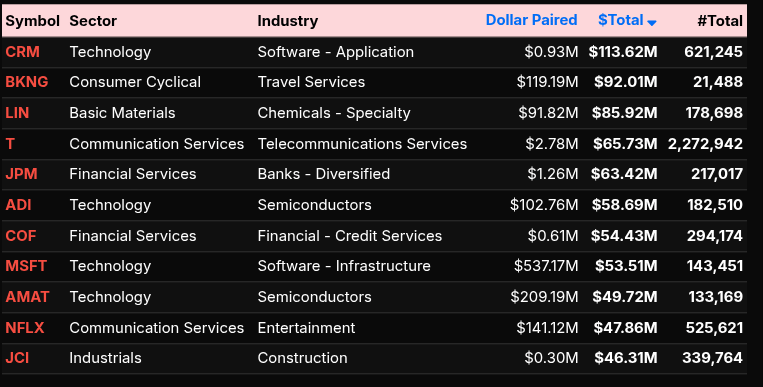
Sector flows reinforced this theme. Financials (-67%), Consumer Cyclical (-63.5%), and Real Estate (-63.7%) all showed strong sell-side control, with Financials and Industrials (#PCT ~ -75%) indicating near wholesale distribution. Basic Materials stood out at -90.6%, marking one of the most extreme sell imbalances on the board — a clear institutional exit. Utilities (-83.4%) and Consumer Defensive (-62.1%) also leaned heavily offered, signaling defensive sectors were not acting as safe havens.
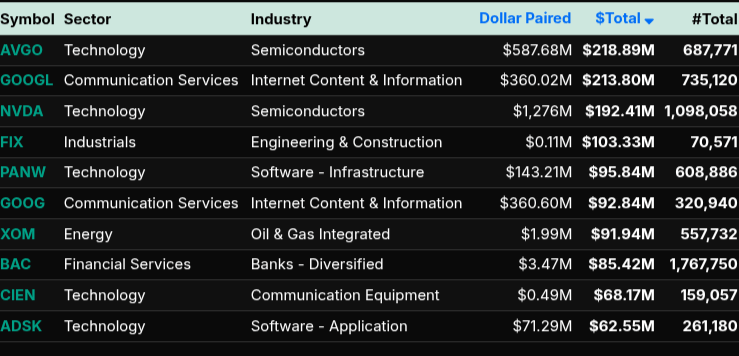
On the buy side, no sector crossed the +66% threshold, meaning there was no true “must-own” accumulation. However, Healthcare (+67%) did reach notable buy-side skew, suggesting targeted inflows. Technology (+60.7%) and Communication Services (+54.8%) were more rotational, not strong enough to counteract broader sell pressure.
At the symbol level, flows were concentrated in high-liquidity names. Selling pressure was evident in CRM, BKNG, and LIN, while buy programs targeted mega-cap tech and communication names such as AVGO, GOOGL, NVDA, and PANW. Notably, NVDA and AVGO saw significant dollar pairing, indicating active two-way flow but still within a broader sell-dominated tape.
Into the close, the imbalance moderated slightly but remained decisively negative (-$476M), confirming that supply persisted through the auction. Overall, this was a structurally bearish MOC, characterized by broad participation, sector-wide selling, and the absence of strong buy-side conviction.
Technical Edge
Fair Values for March 25, 2026:
SP: 48.69
NQ: 207.02
Dow: 276.66
Daily Breadth Data 📊
For Tuesday, March 24, 2026
• NYSE Breadth: 55% Upside Volume
• Nasdaq Breadth: 39% Upside Volume
• Total Breadth: 45% Upside Volume
• NYSE Advance/Decline: 49% Advance
• Nasdaq Advance/Decline: 40% Advance
• Total Advance/Decline: 43% Advance
• NYSE New Highs/New Lows: 86 / 113
• Nasdaq New Highs/New Lows: 68 / 252
• NYSE TRIN: 0.79
• Nasdaq TRIN: 1.04
Weekly Breadth Data 📈
For the week ending Friday, March 20, 2026
• NYSE Breadth: 42% Upside Volume
• Nasdaq Breadth: 46% Upside Volume
• Total Breadth: 44% Upside Volume
• NYSE Advance/Decline: 28% Advance
• Nasdaq Advance/Decline: 29% Advance
• Total Advance/Decline: 28% Advance
• NYSE New Highs/New Lows: 155 / 291
• Nasdaq New Highs/New Lows: 194 / 716
• NYSE TRIN: 0.53
• Nasdaq TRIN: 0.48
ES & NQ Futures trading levels (Premium only)
Trading Room Summaries
Polaris Trading Group Summary - Tuesday, March 24, 2026
The session unfolded very much in line with a Cycle Day 2 (CD2) environment—characterized by early movement followed by choppy, rotational price action.
Pre-Market Context
Overnight price fulfilled the 6590 downside target, then bounced back toward the key 6630 Line in the Sand (LIS).
David set expectations early: CD2 = early MATD (Morning After the Day) rhythms, which typically means:
Initial directional push
Followed by consolidation / chop
Morning Session – Early Opportunity
The market delivered on the expected early MATD rhythm, giving traders a directional read.
David leaned long bias as price attempted to reclaim and hold above the 6630 LIS.
Key instruction:
“HOLD…SHIFT → 1st pullback”
Emphasis on patience and structure, not chasing initial moves
Lesson: Let the first move establish direction, then look for high-probability pullback entries.
Mid-Morning – Chop & Frustration
Price struggled to clear and convert above 6630, which became a pivotal battleground.
Market behavior:
“Big knuckle sandwich” → tight, back-and-forth chop
“Snappy pops n drops” → stop runs on both sides
Market makers cleaning out liquidity above and below
David’s response:
SOH (Sit On Hands) during the chop
Reinforced discipline: don’t trade the middle
Lesson:
When price is stuck around key levels and whipping:
Avoid overtrading
Wait for acceptance above/below key structure
Late Morning – Attempted Breakout
After stops were cleared, bulls began pressing higher
Attempt toward 6652 handle, showing some upside intent
However:
Follow-through was weak
Market remained in CD2 “nonsense” (low progress, rotational behavior)
Key Takeaways from the Day
Respect Cycle Day Structure
CD2 often delivers early opportunity → then chop
Adjust expectations accordingly
Key Level = 6630 LIS
Clear example of:
Resistance → needed to convert to support
Failure to hold = continued rotation
Patience Pays
Best guidance of the day:
Wait for the 1st pullback
Avoid the middle chop (SOH)
Stop Runs Are Not Signals
“Pops n drops” were liquidity events, not true direction
Important to distinguish noise vs. intent
Bottom Line
A classic Cycle Day 2 grind:
Early opportunity for those who were patient
Followed by low-quality chop that required restraint
The biggest win today wasn’t a big trade—it was avoiding bad ones.
Discovery Trading Group Room Preview – Wednesday, March 25, 2026
Morning Macro & Market Brief
Geopolitics in focus: Markets are centered on the Middle East. US equity futures are higher on hopes of a potential US-led resolution to the Iran conflict, with a reported 15-point plan delivered via Pakistan. However, Iran has publicly rejected ceasefire discussions, and uncertainty remains around Israel’s stance. Global pressure is mounting—India (Hormuz access), China (negotiations), and Saudi Arabia (pro-conflict stance) all weighing in.
Oil & volatility: Crude dropped ~7% on de-escalation hopes, though Iran signaled it may not allow prices to normalize. Volatility remains elevated, with ES still seeing wide ranges (~155 pts 5-day ADR), though a quieter session is expected absent new headlines.
Positioning: No clear “whale” bias overnight—large trader activity was active but mixed.
Tech headlines:
NVDA: Jensen Huang highlighted AI’s potential to autonomously build billion-dollar businesses.
SpaceX: रिपोर्टedly preparing IPO filing, with ~$75B raise potential (unconfirmed).
ARM: Announced shift into chip manufacturing (targeting $15B revenue in 5 years); META signed as first major customer. Stock +8%.
Earnings & data:
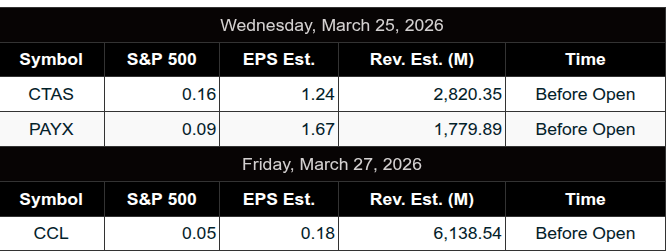
Premarket: CTAS, PAYX
Thursday: AEG
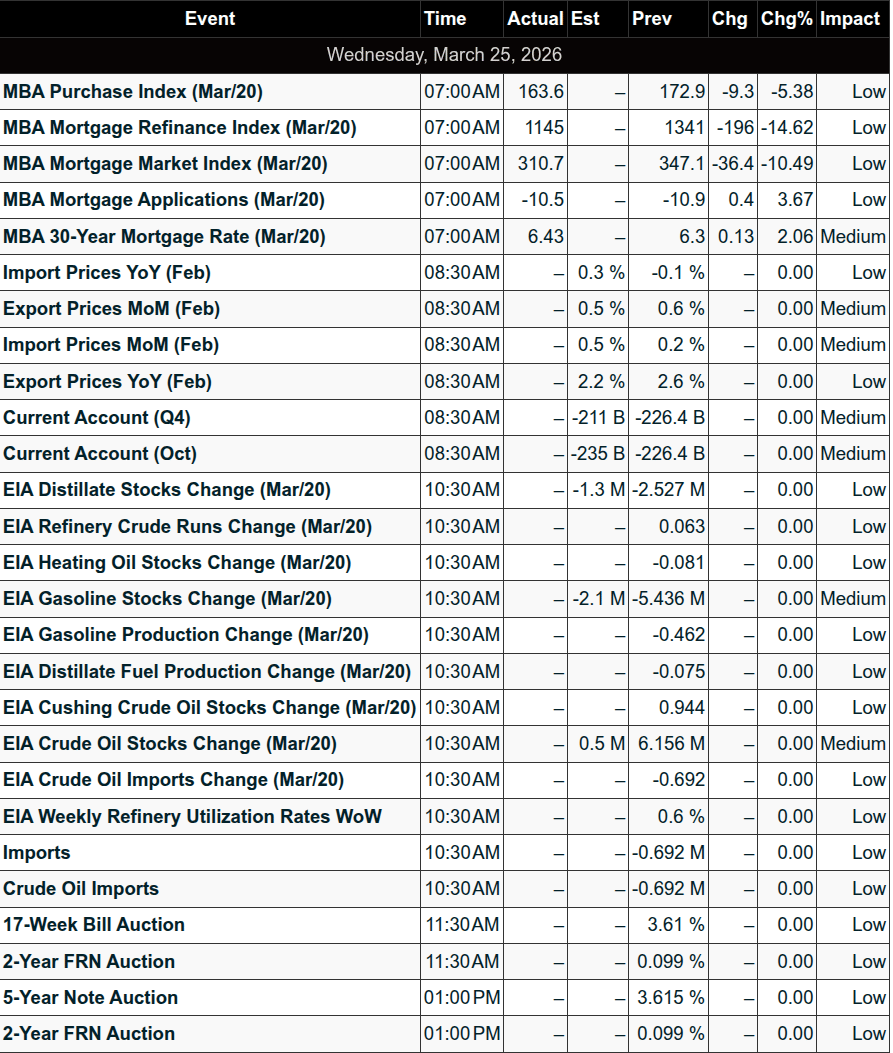
Data: Light (Current Account, Import Prices, Crude Inventories)
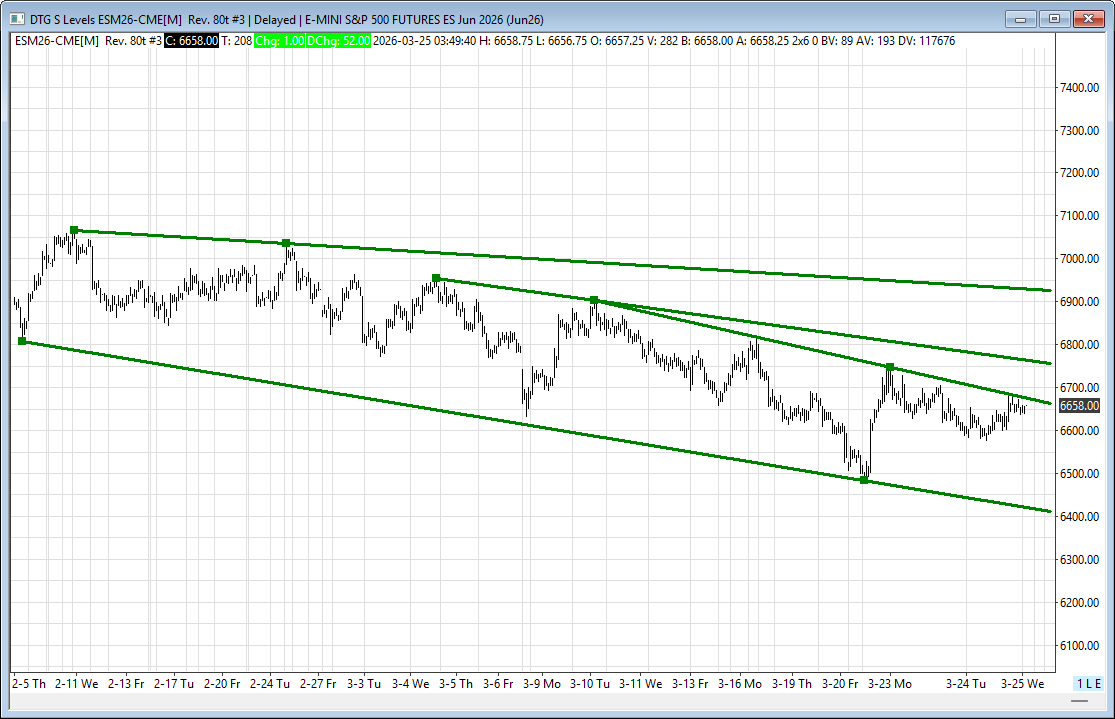
ES technicals:
Resistance: 6680/77 (channel top), then 6765/60, 6925/20
Support: 6415/10
Price rejected the top of the short-term downtrend channel overnight. Bulls need to reclaim 6680s to extend higher.
200-day MA (6769) back in range above; 50-day (~6100) rising quickly toward it.
Bottom line: Macro remains headline-driven with geopolitics dictating direction. Key pivot remains 6680—break above could open upside, while failure keeps bears in short-term control.