- The Opening Print
- Posts
- Seven Weeks Up and No Fat Lady Yet — This Tape Still Wants Higher
Seven Weeks Up and No Fat Lady Yet — This Tape Still Wants Higher
Danny Riley
May 14, 2026
Follow @MrTopStep on Twitter and please share if you find our work valuable!

The word “sell” has not worked very well as the ES and NQ go into their seventh week of gains. I do not know anyone who said the markets could rally this much.
Yes, the NQ had its first 1% decline since 3/27/26 on Tuesday, but the ES — which was down over 1% intraday — only closed down 0.14% on Tuesday. It has not had a 1% down close since 3/27/26 either; that is 35 sessions without a 1% correction.
There have been two other significant periods of “1% drought” in the last few years:
Late 2025: A similar period of tranquility occurred in the latter half of 2025. By October 2025, the S&P 500 had gone 119 trading days without a single 2% pullback, and the stretches without a 1% drop frequently exceeded 30-40 sessions during that summer/fall rally.
2023–2024 Bull Run: During the massive rally from October 2023 through early 2024, the index went approximately 70 sessions without a 1% pullback, one of the longest such streaks in the modern era until the current 2026 cycle eclipsed it.
So, can the ES keep going higher? It sure looks that way! No “big fat hug” for Trump yet, but there are positive signs.


Our Lean is a premium feature available only to paid subscribers. It provides a daily pre-market look at how Danny is leaning into the trading day.
Take a Free Premium Trial to see this section in action.


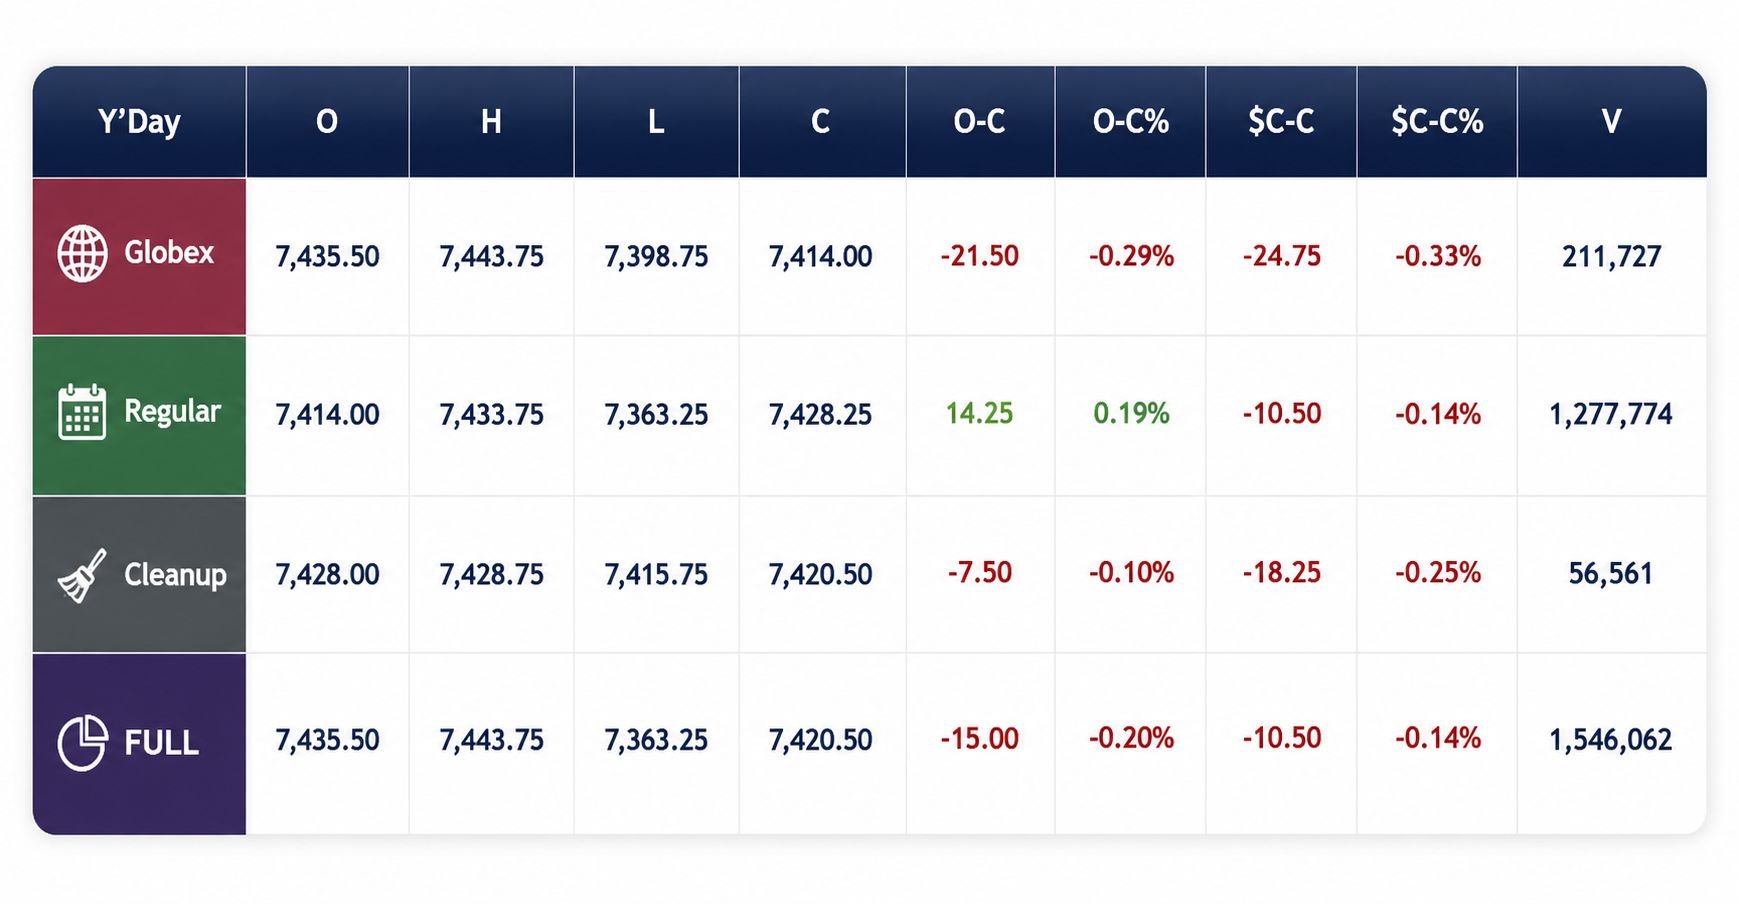
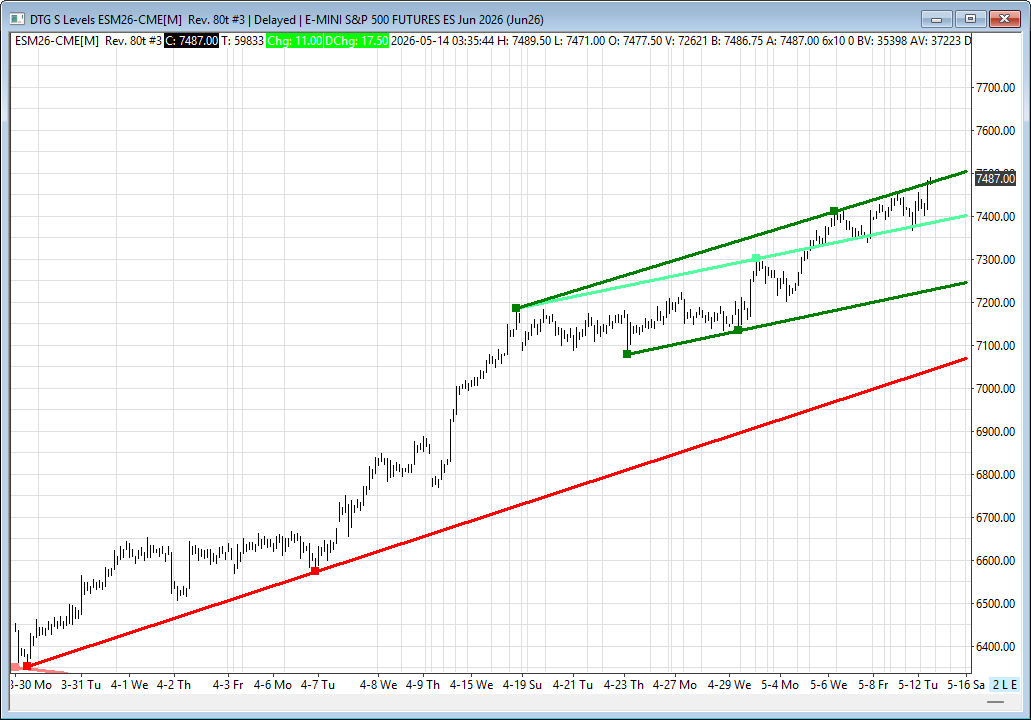
The ES traded in a 7363.25 to 7433.75 Globex trading range and opened Wednesday’s regular session at 7429.25, up 1.00 points or +0.01%.
After the open, the ES traded 7429.50 and sold off 30.50 points down to 7399.00 at 9:45, rallied 33.00 points up to 7432.00 at 10:25, sold off down to a 7422.00 double bottom, rallied up to a new high at 7447.00 at 11:40. It traded 7439.50, and then made five higher highs up to 7464.75 at 12:25, 65.75 points off the low of the day.
After the high, the ES pulled back a few points, backed and filled, and then rallied up to 7474.00, pulled back to 7465.75 at 2:00, and then rallied 18.00 points up to 7483.75 at 2:16. It sold off 13.50 points down to 7470.25 at 2:55, rallied up to a new high at 7482.25 at 3:15, chopped in a narrow 4- to 6-point range, traded 7481.25, and traded 7479.00 as the 3:50 imbalance showed $3.5 billion to sell. The ES then sold off down to 7466.50 on the 4:00 cash close.
After 4:00, the ES stutter-stepped up to 7478.00 at 4:35 and settled at 7476.00, up 49.50 points or 0.67%. The NQ settled at 20,536.00, up 366 points or +1.82%. The YM settled at 42,895.00, up 26 points or +0.06%, and the RTY settled at 2,252.20, up 1.80 points or +0.08% on the day. Bitcoin fell 1.2%, and crude oil traded up to 103.67 but settled down 1.15%.
The PPI showed that wholesale inflation jumped 6% in April on an annual basis, the largest increase since 2022. With oil up after the open, I was right about my lean: sell the open or early rallies and buy the dip.
In terms of the index markets' overall tone, the NQ monstered higher, gaining back more than Wednesday's decline. In terms of the ES's overall trade, volume fell to the lowest level of the week at 1.2 million contracts traded.
On Tap Today
8:30 AM: Retail Sales (Headline & Ex-Autos); Jobless Claims (Initial); Import Price Index (Headline & Ex-Fuel)
10:00 AM – 1:00 PM:
10:00 AM: Business Inventories
10:15 AM: Jeff Schmid (KC Fed)
1:00 PM: Beth Hammack (Cleveland Fed)
Evening Fed Speakers:
5:45 PM: John Williams (NY Fed)
7:00 PM: Michael Barr (Fed Governor)

MiM
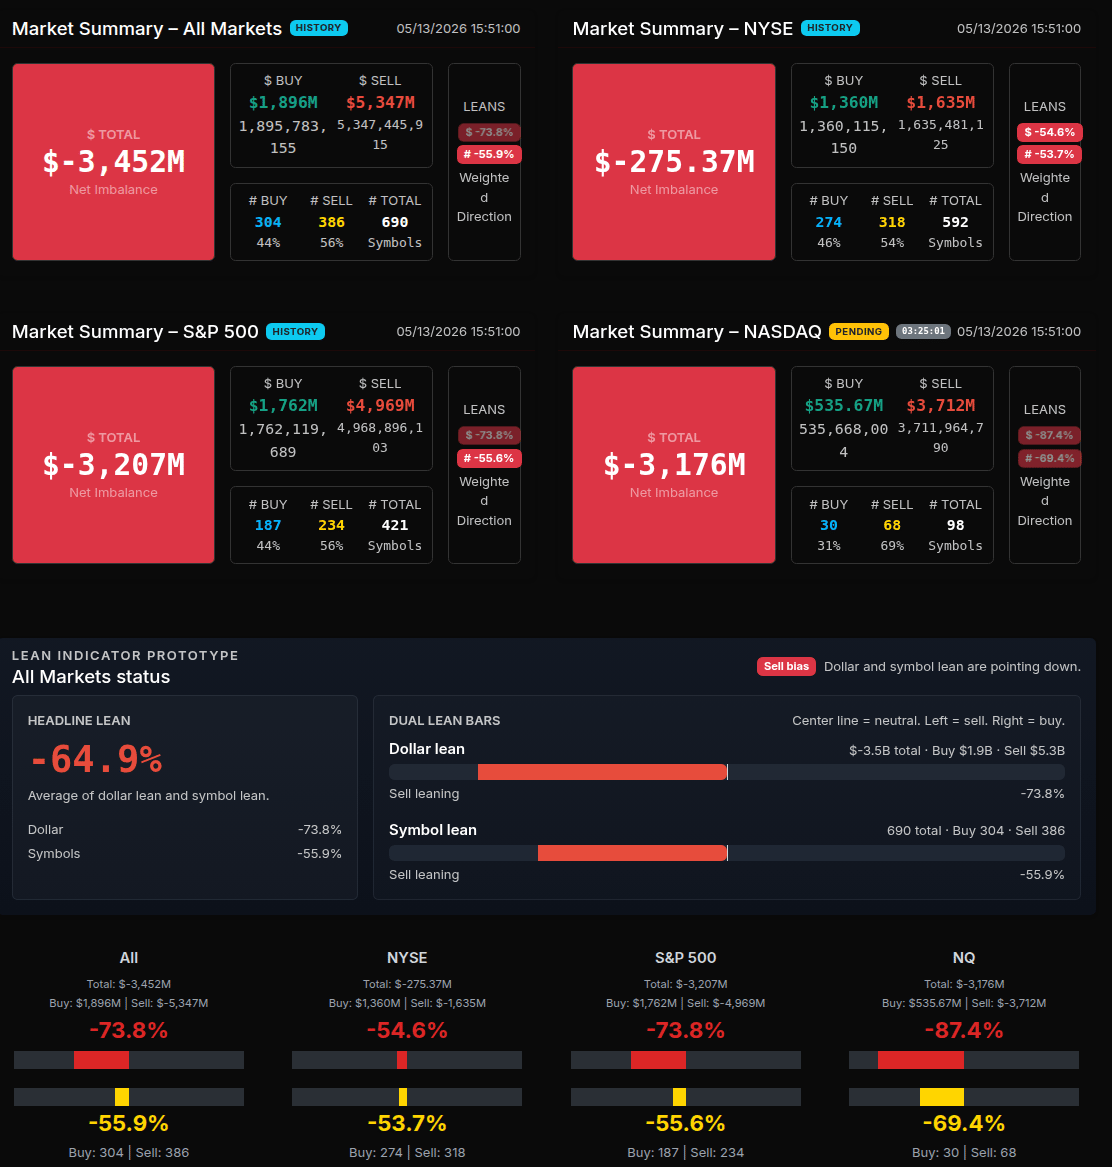
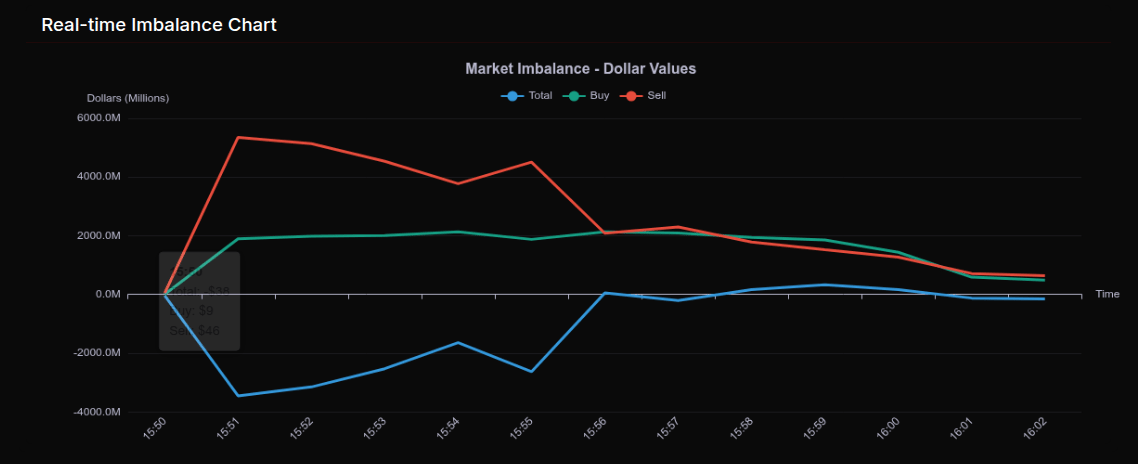
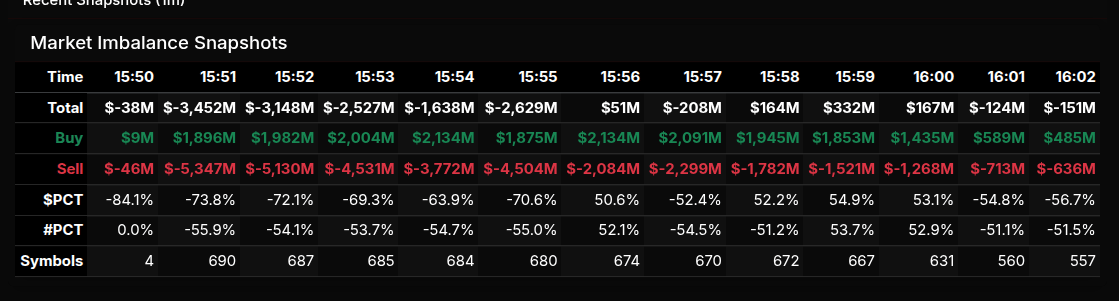
The closing auction developed into a sharp sell imbalance event after an initially mixed and rotational setup deteriorated into broad institutional selling pressure. At 15:50 the MiM opened with a sell imbalance of $3.4B for sale. The strongest pressure remained concentrated in the Nasdaq complex and growth sectors throughout the remainder of the close.
By 15:51, the Nasdaq carried a staggering -87.4% dollar lean with only 30 buy symbols versus 68 sell symbols, showing aggressive one-sided liquidation rather than simple rotation. The S&P 500 also reflected heavy institutional supply with a -73.8% dollar lean and -55.6% symbol lean. Overall market conditions ended with a headline lean of -64.9%, confirming broad sell-side dominance into the bell.
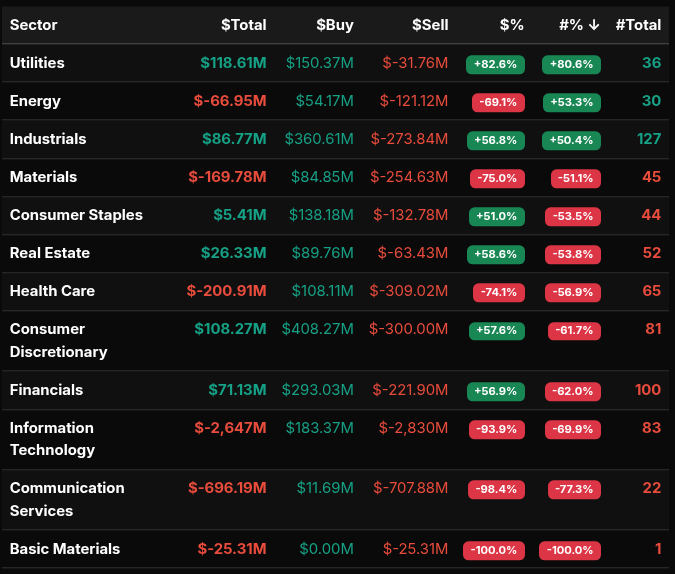
Communication Services showed the most extreme sector pressure with a -98.4% lean, while Information Technology printed a -93.9% lean. Basic Materials finished at -100%, although participation there was minimal. Materials (-75.0%) and Health Care (-74.1%) also experienced wholesale sell-side activity. Sector readings beyond +/-66% typically indicate directional institutional flow rather than normal repositioning, and several sectors clearly crossed that threshold.
Despite the bearish index backdrop, there were selective pockets of buying interest. Utilities posted a strong +82.6% lean, suggesting defensive positioning into the close. Industrials (+56.8%), Financials (+56.9%), and Consumer Discretionary (+57.6%) were more rotational in nature, showing balanced two-way participation rather than outright accumulation.
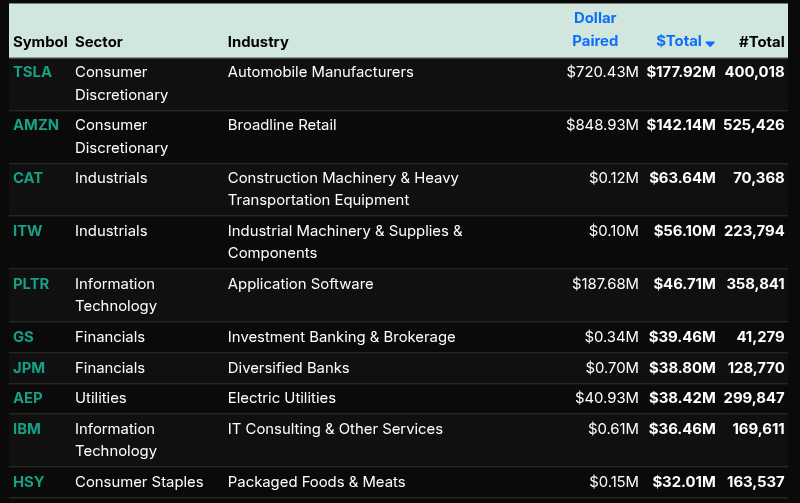
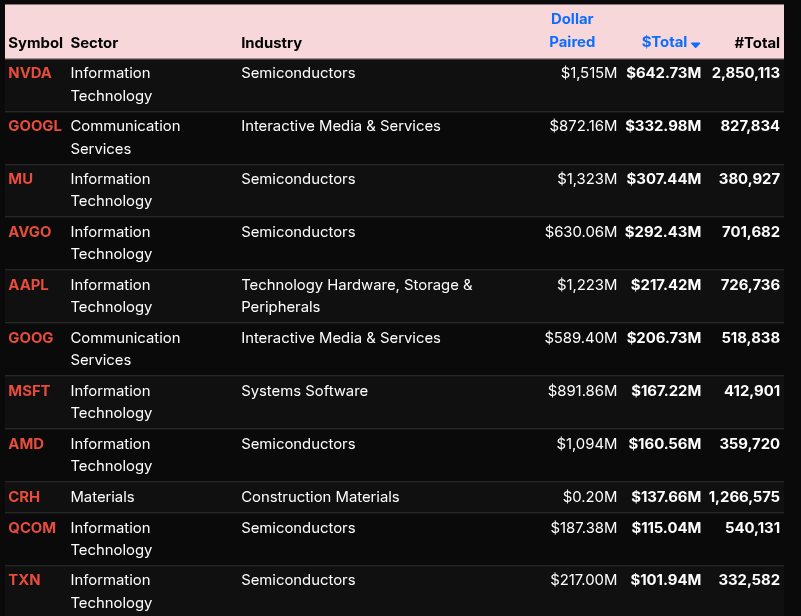
On the symbol level, the largest sell imbalances were concentrated in mega-cap technology and semiconductor names. NVDA led with a $642.73M imbalance, followed by GOOGL ($332.98M), MU ($307.44M), AVGO ($292.43M), and AAPL ($217.42M). AMD, QCOM, TXN, and MSFT also saw sizable sell programs. Conversely, TSLA showed one of the stronger buy imbalances at $177.92M alongside AMZN, CAT, GS, JPM, and AEP, highlighting selective rotation into cyclicals, financials, and defensive utilities while large-cap tech absorbed the majority of the closing sell pressure.

Live today at 9AM:


Fair Values for May 14, 2026
S&P: 22.81
NQ: 106.6
Dow: 80.48
Daily Breadth Data 📊
For Wednesday, May 13, 2026
• NYSE Breadth: 43% Upside Volume
• Nasdaq Breadth: 59% Upside Volume
• Total Breadth: 53% Upside Volume
• NYSE Advance/Decline: 39% Advance
• Nasdaq Advance/Decline: 48% Advance
• Total Advance/Decline: 45% Advance
• NYSE New Highs/New Lows: 110 / 114
• Nasdaq New Highs/New Lows: 295 / 233
• NYSE TRIN: 0.85
• Nasdaq TRIN: 0.65
Weekly Breadth Data 📈
For the Week Ending Friday, May 8, 2026
• NYSE Breadth: 49% Upside Volume
• Nasdaq Breadth: 57% Upside Volume
• Total Breadth: 53% Upside Volume
• NYSE Advance/Decline: 55% Advance
• Nasdaq Advance/Decline: 58% Advance
• Total Advance/Decline: 57% Advance
• NYSE New Highs/New Lows: 370 / 128
• Nasdaq New Highs/New Lows: 854 / 357
• NYSE TRIN: 1.32
• Nasdaq TRIN: 1.03
S&P 500/NQ 100 BTS Trading Levels (Premium Only)
BTS are daily generated levels created using a combination of proprietary calculations and AI to define an upper range target and a lower range target, split by a bull/bear line. You receive daily charts along with clear descriptions of each level to help guide your trading.

Take a Free Premium Trial to see them in action.


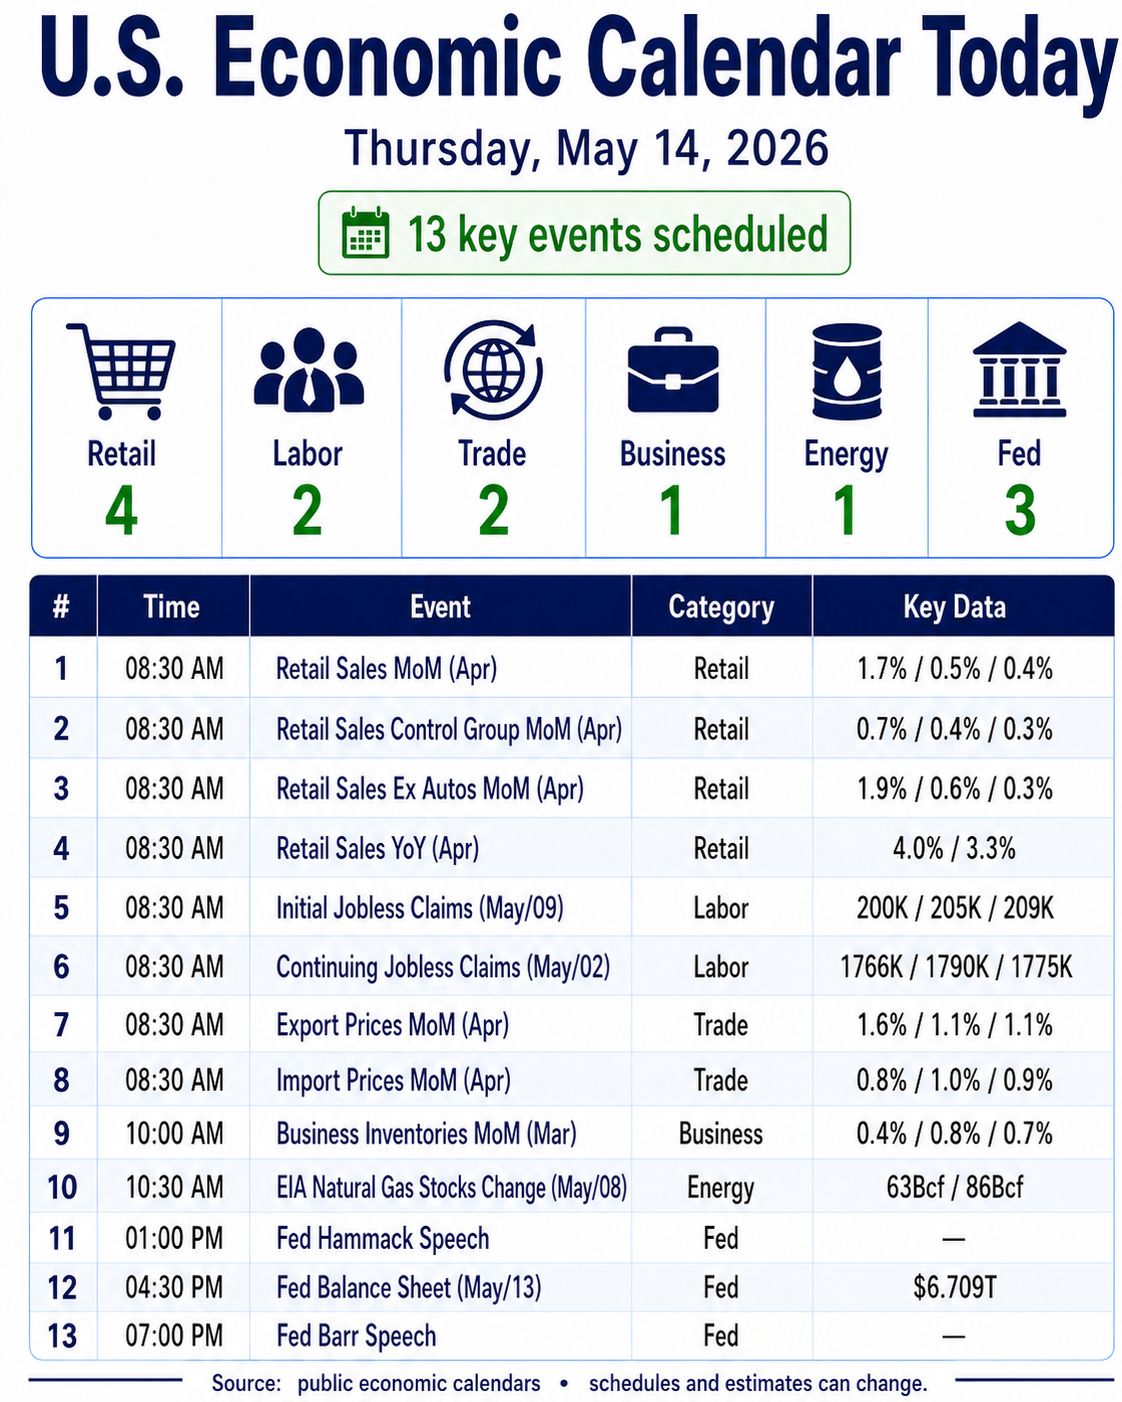
Today’s Economic Calendar
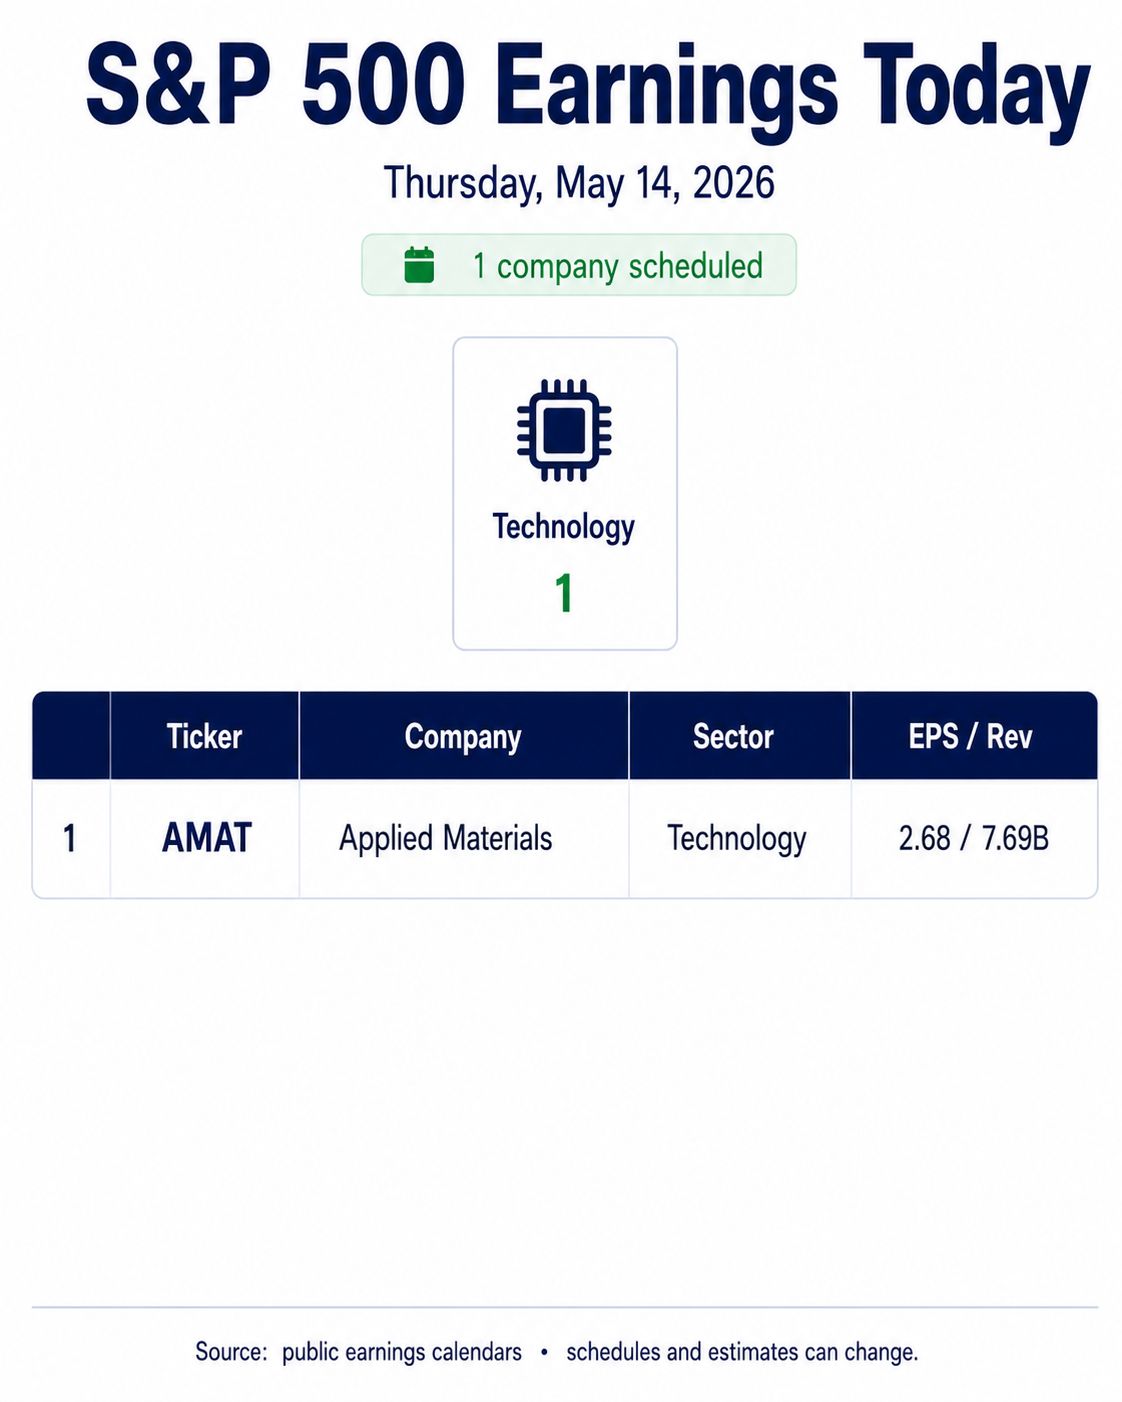
Earnings:

PTG Room Summary – For Wednesday, May 13, 2026
The day was a strong example of PTG cycle discipline: early structure, clear LIS references, and patience through balance led into a powerful Cycle Day 2 upside extension.
Pre-Market Context
ES and NQ fulfilled overnight upside targets.
Price reversed from the D-Level.
PTGDavid identified the day as Cycle Day 2.
Early expectation: MATD Rhythms.
Early Trade Plan
Initial lean: sell-side on bounces.
Key Line in the Sand: 7410.
David called a premium sell / ONL retest.
The 7410 LIS back test was successful.
Positive Trade Highlights
Nicholas hit his first two targets on the premium trade at 7419.
The room later saw a strong back test of the 7420 LIS zone.
David described the move as a “Perfect Cycle Day 2 Rhythm.”
Afternoon price action extended strongly higher toward the upside penetration target at 7482.71.
Market Progression
After the early sell-side lean, price rotated back toward mid-VWAP.
David shifted expectations to more two-way balance trade.
Buyers regained control into the afternoon.
The move developed into:
Range Runner and Beyond
Money Box in-play
Parabolic Blow-off Phase
Closing Action
ES closed near the highs of the day.
David summed it up with: “Train Kept a Rolling.”
A late $4B MOC sell imbalance appeared, but it was largely paired off.
Lessons Learned
Respect the Cycle Day framework.
LIS back tests can provide high-quality trade references.
Hot news data does not automatically override market structure.
Balance periods require patience, not forced trades.
Confidence builds by following rules and trusting the system.
Overall Takeaway
A clean, constructive session where PTGDavid’s Cycle Day 2 roadmap played out very well.
The strongest opportunity came from trusting the LIS levels, cycle rhythm, and upside continuation structure.
DTG Room Preview – Thursday, May 14, 2026
Macro Focus
Markets focused on the Trump-Xi summit, US/Iran conflict, and this morning’s Retail Sales data.
S&P 500 expected move is muted at ~0.7% despite elevated headline risk.
Geopolitical Update
Possible China deal could include Boeing 737 Max orders, US ag purchases, and Nvidia H200 chip export clarity.
Critical minerals remain in focus; a US-China deal could pressure recent rare-earth winners.
Chinese clean-tech firms have reportedly canceled ~$2.8B in planned US manufacturing projects.
Today’s Calendar
8:30am ET: Retail Sales, Weekly Claims, Import Prices.
10:00am ET: Business Inventories.
10:15am ET: KC Fed’s Schmid.
1:00pm ET: Cleveland Fed’s Hammack.
Earnings: HMC, BN, NGG, VIK premarket; AMAT, BAP, NU, SUZ after close.
ES Outlook
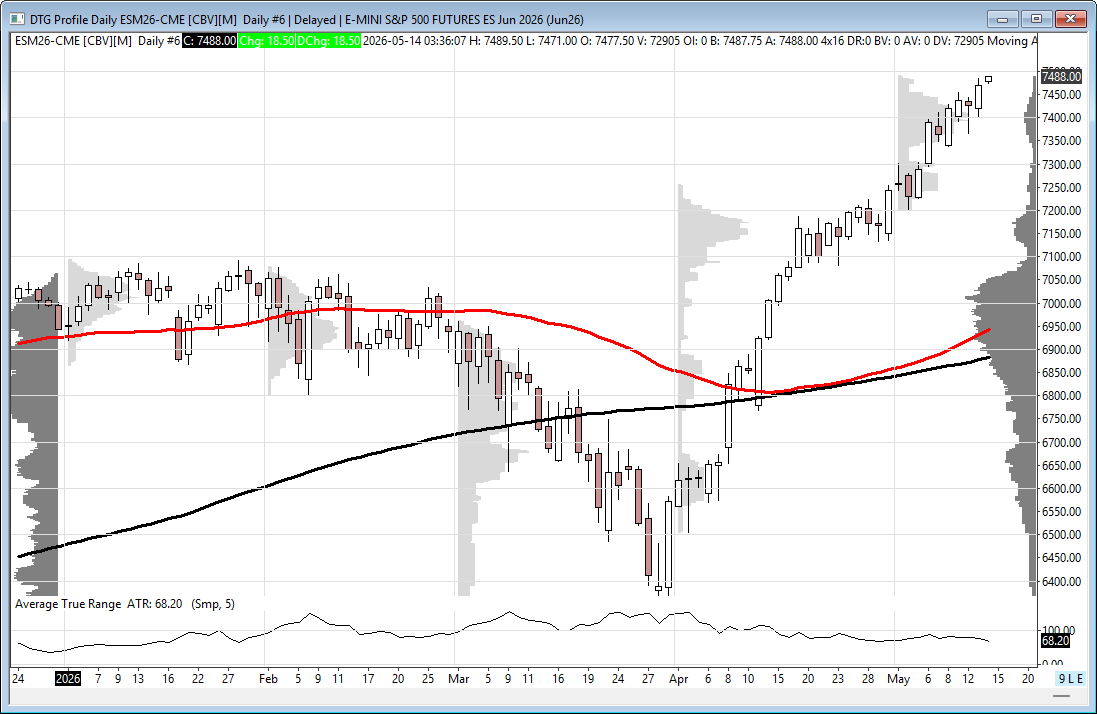
Volatility remains elevated, though ES 5-day average daily range eased to 77.25 points.
Whale bias slightly bearish into 8:30am ET data on light overnight volume.
Longer-term bias remains bullish with the 50-day MA above the 200-day MA.
Key ES Levels
Resistance: 7478/83.
Support: 7390/93, 7234/39, 7070/75.