- The Opening Print
- Posts
- Santa Rally Period Starts Today
Santa Rally Period Starts Today
It's options FRY-day
Last Call!
Don't Forget! Our upcoming dynamic Live Q&A session featuring two leading experts in the field is this weekend!
Please register for S&P 500 Quantitative End of Year Review + Stock Market Outlook for 2024 on Dec 23, 2023 11:00 AM EST at:
After registering, you will receive a confirmation email containing information about joining the webinar.
We look forward to having you join us for an engaging and informative session!
Today is Fry-Day, which means it’s a free-read for everyone. If you’d like to consider upgrading to our premium membership, do so with a free 7-day trial.
Our View
I do not think there is much to say that has not already been said. Sometimes, that’s just the way it is in a trending market late in the year and I don’t want to waste your time and energy by pretending otherwise.
We are full boar into the holidays and things should start to really gear down. Today is the week three December Options expiration (although technically, the fourth weekly expiration this month). My guess is it has a bullish slant to it.
One other note: The Santa Claus Rally period starts today.
In case it helps, consider bookmarking the New Year Holiday Trading Schedule.
Our Lean
I think the ES is going to rip today. Six of the last seven expiration Friday’s have been higher (and the only down day in that stretch was a decline of 6 points).
More than at any point this year, trade less, pick your spots better, buy the pullbacks, use stops, and don't spoil your year-end by making bad trading decisions.
For those of you who like HandelStats levels, here they are:
Upside: Trade and hourly close above 4795.75 targets 4809.50. Hourly close above there targets 4816, then 4822.50. Above there targets 1 sd at 4824, then 1sd weekly at 4826.53. Hourly close above there targets 4841.24, hourly close above there targets 2 sd at 4852.28. Hourly close above there targets 3 sd at 4880.54.
Downside: Trade and hourly close below 4790 targets 4777.62, then 4774.25. Hourly close below there targets -1 sd at 4767.49, then 4765, then 4763.25, hourly close below there targets 4755.51, hourly close below there targets 4742.25, then -2 sd at 4739.22. Hourly close below there targets 4726.88, then -1 weekly sd at 4715.97, then -3 sd at 4710.96.
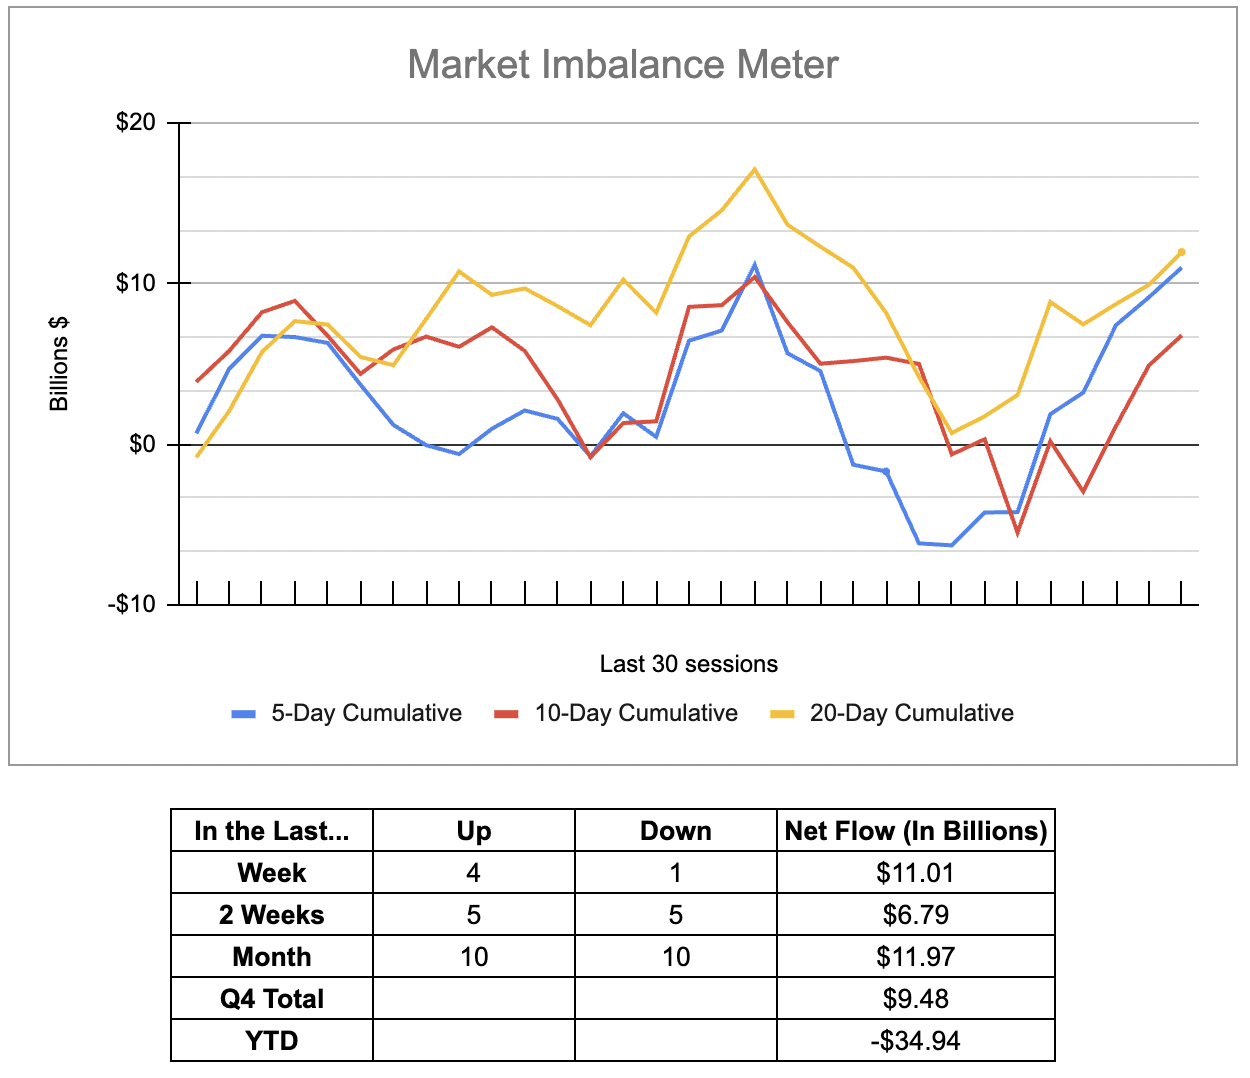
MiM and Daily Recap
ES Recap
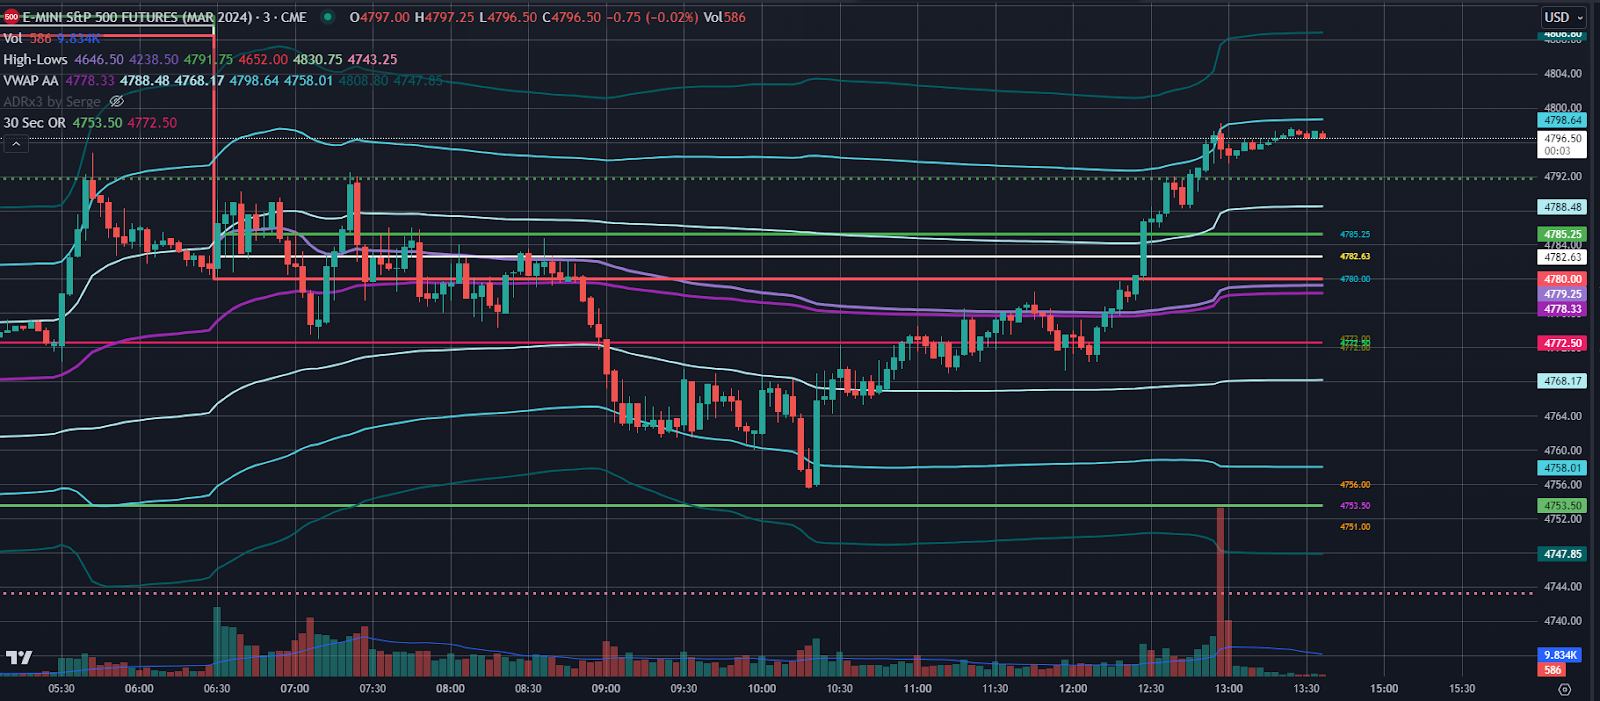
After a 78-point drop, the ES rallied up to 4794.75 on Globex and opened Thursday's regular session at 4781.25. After the open, the ES sold off down to 4773.00 at 10:09, rallied up to 4792.50 at 10:25, pulled back down below the VWAP at 4777.50 at 10:28, and traded just above and below the VWAP until 11:39. From there, it sold off down to 4755.50 at 12:36, rallied up 4778.50, and then sold off down to 4769.25 at 2:58. That’s when I posted this in the room:
MIM: Dboy : (3:03:49 PM): firm close today to set up the Santa FRYday
The ES then rallied up to 4792.00 at 3:38 as the early imbalance showed $147 million to buy. The ES traded 4792.25 as the 3:50 cash imbalance showed $2.2 billion to buy and the ES rallied up to 4798.25 on the 4:00 cash close. After 4:00, the ES remained near the highs of the day and settled at 4895.75, up 42.5 points or +0.89% on the day.
In the end, it was a Lowry’s 9-to-1 down day Wednesday (bearish reading) and then a big rip higher yesterday (and almost a 9-to-1 upside day). In terms of the ES's overall tone, it was firm but sloppy until late in the day. In terms of the ES's overall trade, volume was steady: 304k traded on Globex and 1.306 million traded on the day session for a total of 1.610 million contracts traded.
Technical Edge
NYSE Breadth: 88% Upside Volume (!)
Nasdaq Breadth: 73% Upside Volume
Advance/Decline: 80% Advance
VIX: ~13.75
Green, despite stock rebound
ES
Levels from HandelStats.com
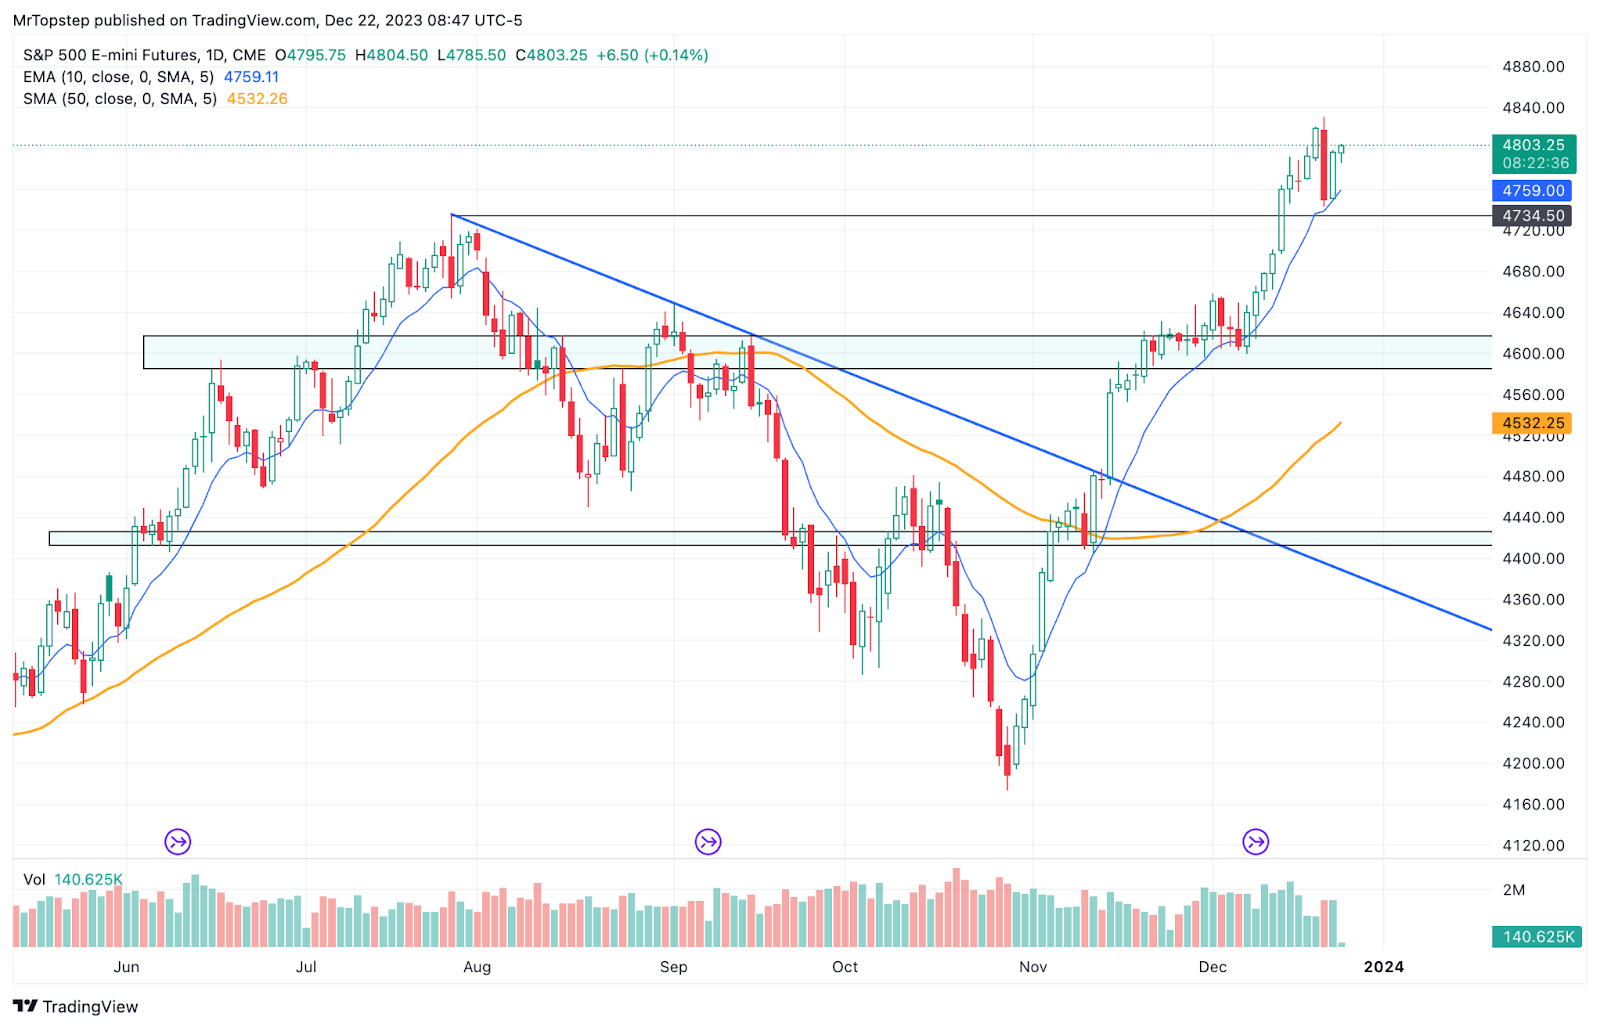
ES Daily
Upside: Trade and hourly close above 4795.75 targets 4809.50. Hourly close above there targets 4816, then 4822.50. Above there targets 1 sd at 4824, then 1sd weekly at 4826.53. Hourly close above there targets 4841.24, hourly close above there targets 2 sd at 4852.28. Hourly close above there targets 3 sd at 4880.54.
Downside: Trade and hourly close below 4790 targets 4777.62, then 4774.25. Hourly close below there targets -1 sd at 4767.49, then 4765, then 4763.25, hourly close below there targets 4755.51, hourly close below there targets 4742.25, then -2 sd at 4739.22. Hourly close below there targets 4726.88, then -1 weekly sd at 4715.97, then -3 sd at 4710.96.
NQ
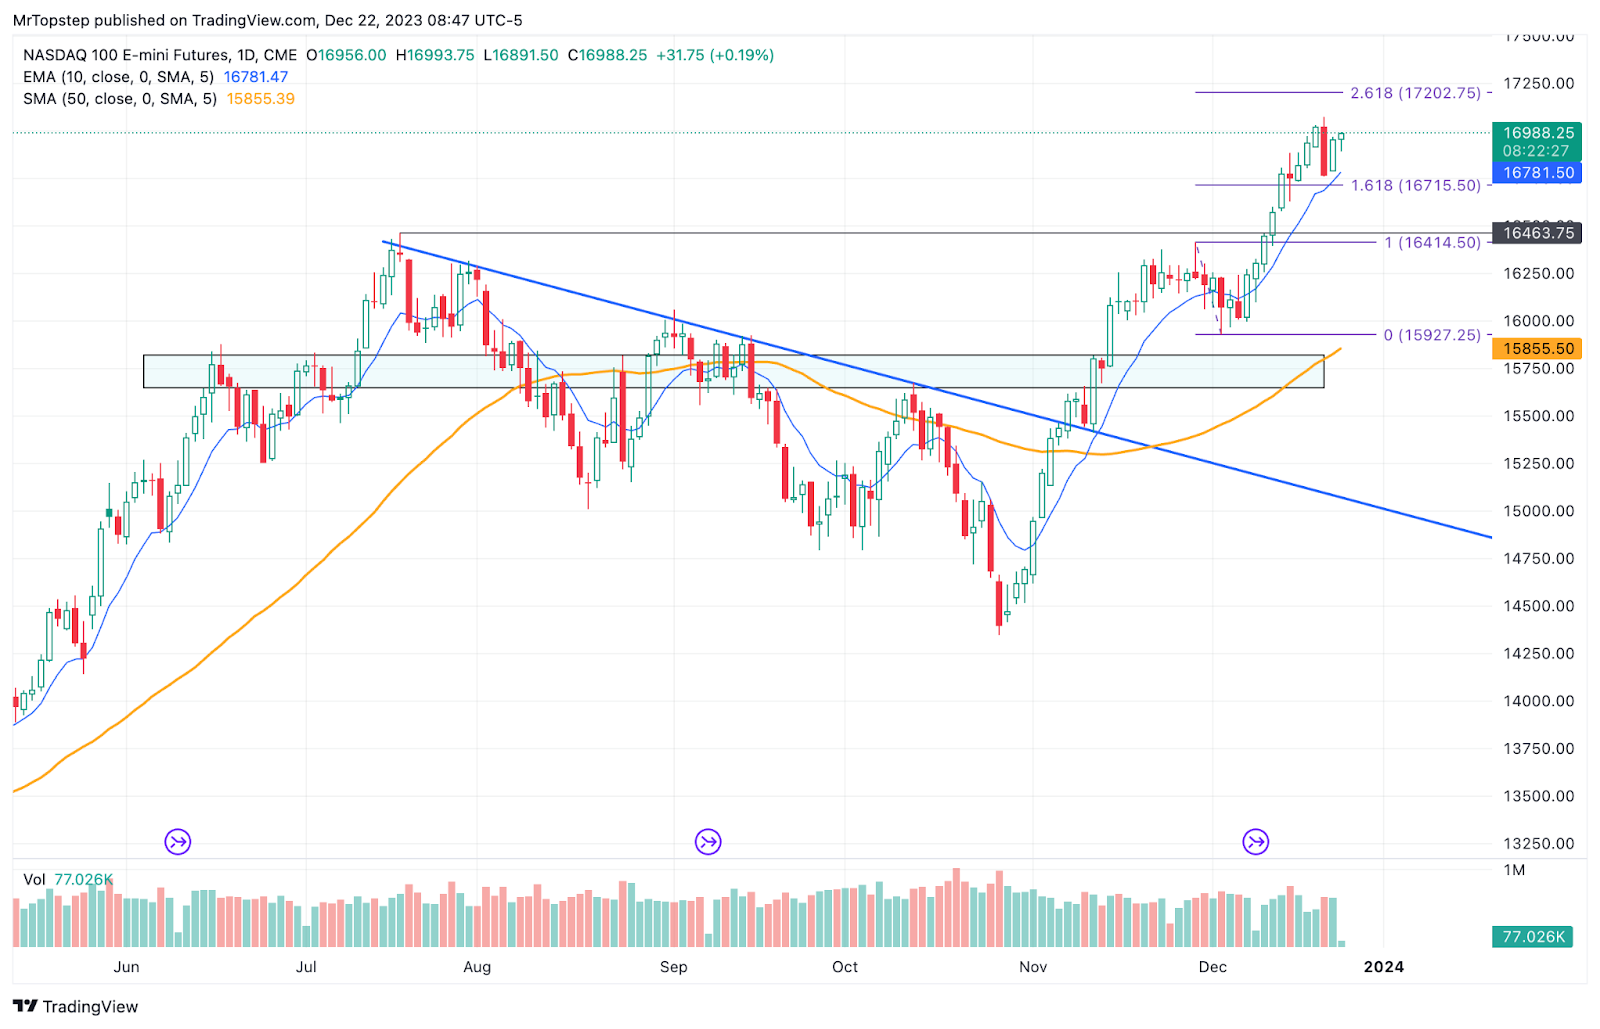
NQ Daily
Upside: Above settlement 16946.25 targets 16971.50. Hourly close above there targets 17006.38, then 17040.75. Hourly close above there targets 1 sd at 17097.04. Hourly close above there targets 1 sd weekly at 17136.03. Hourly close above there targets 2 sd at 17247.83. Hourly close above there targets 17304.75. Hourly close above there targets 3 sd at 17398.62.
Downside: Hourly close below 16971.50 targets settlement at 16946.25, then 16939.62, then 16929.62, then 16913. Hourly close below there targets 16901.75, then 16883, then 16875.50.
Hourly close below there targets 16838.25. Hourly close below there targets 16803.25, then -1sd at 16795.46. Hourly close below there targets 16740.50, hourly close below there targets 16882, then -2 sd at 16644.67.
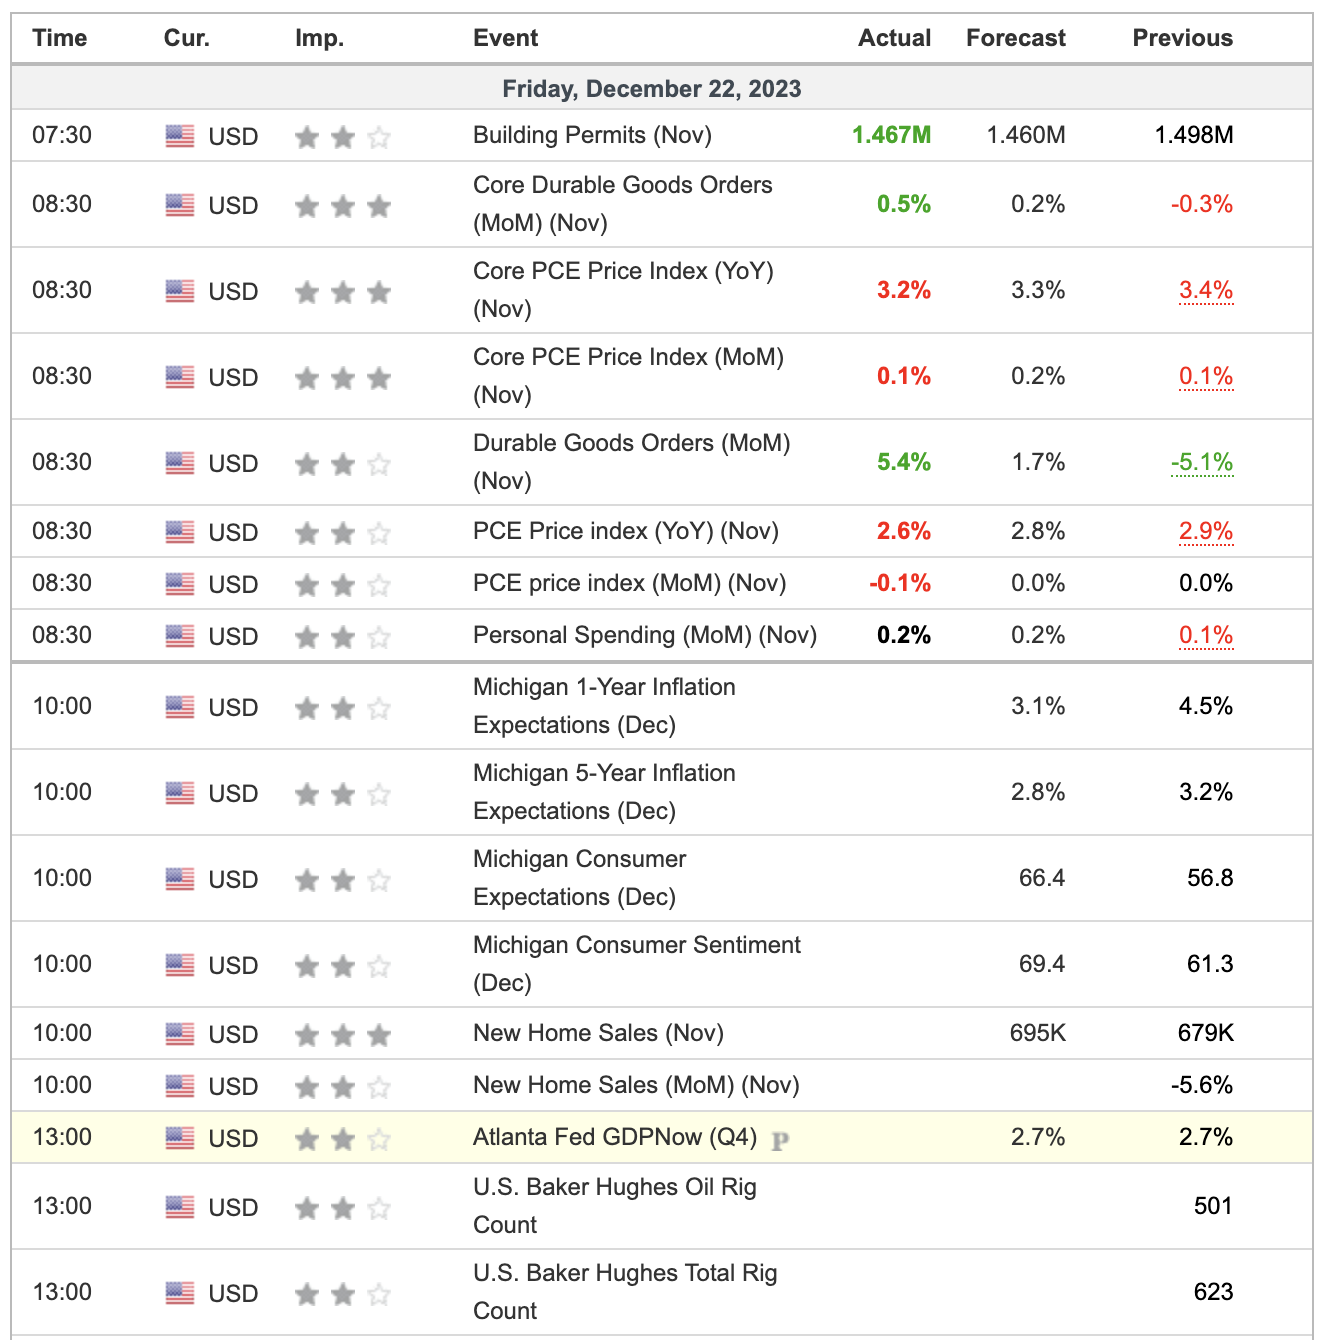
Economic Calendar