- The Opening Print
- Posts
- Rollover Rumble: ESZ to ESH, Wide Markets and Whippier Swings
Rollover Rumble: ESZ to ESH, Wide Markets and Whippier Swings
Danny Riley
December 18, 2025
Follow @MrTopStep on Twitter and please share if you find our work valuable!
Our View
If you’re wondering why the ES has been so volatile, you may want to take a closer look at the ESZ and ESH spread volumes. While the last 5 sessions have been on the higher side, most of the volume has been coming from the rollover. This is what the PitBull calls "two candy stores."
ESZ
Monday: 1.77 million
Tuesday: 1.070 million
Wednesday: 591,000
ESH
Monday: 2.067 million
Tuesday: 2.345 million
Wednesday: 1.950 million
As the institutions roll into the March contracts, most of the volume comes from the (ESZ / ESH) spreads. During the rollover—or switch period—that typically starts around the Thursday before expiration week, trading volume and open interest migrate from the front $ESZ (expiring) contract to the next-month $ESH.
During the roll, as the front-month becomes less liquid, you tend to see wider bid-ask spreads, lower volume, and potentially higher slippage or volatility in fills. For outright traders holding the front-month, this can make exiting or adjusting positions more costly or erratic. Rollover week sees increased volume overall, but it also amplifies the daily swing or move.
Long-term bulls in ES futures often face a small negative drag from contango rolls, while short positions can benefit from it. #BAM!
Market Recap:

The ES traded up to 6882.50 on Globex and traded 6865.50 on the regular session open. After the open, the ES traded 6871.25, sold off down to 6841.25 at 9:45, rallied up to a lower high at 6862.25, and then started to tank after a report that Blue Owl Capital won’t back Oracle's $10 billion data center for OpenAI.
After the news, the ES sold off 58.25 points down to 6804.00 at 10:55, rallied up to 6821.25 at 11:05, traded down to 6794.50 at 11:50, traded up to 6814.75, traded down to a new low at 6793.00, rallied up to 6812.75 at 1:05, and then reversed down to 6783.75 at 1:40. It rallied up to 6796.25 at 2:55, sold off down to 6782.00 at 3:30, and then rallied, made a lower high, and traded up to 6793.25 at 3:45. The ES traded 6792.25 as the 3:50 cash imbalance showed $1 billion to sell and then dropped to $5 billion. It sold off down to a new low at 6775.50 at 3:55 and traded 6777.00 on the 4:00 cash close.
After 4:00, the ES rallied up to 6795.00 at 4:10, pulled back to 6786.00, and settled at 6778.50, down 77.50 points or -1.13%, down 4 sessions in a row for a total loss of 2.72%. The NQ settled at 24,898.75, down 481.50 points or -1.90% on the day, down 4 of the last 5 sessions or -4.50%.
A post from the MrTopStep chat: Who's Telling the Truth Here?
The Nasdaq has now lost $660 billion in market cap over this one Michigan data center fiasco that started Friday morning. First, Bloomberg erroneously reported that the data center in Michigan was delayed due to labor and equipment shortages. Then FT this morning twisted the knife (as they love to do) about this same data center, claiming that OWL dropped out of the financing. Both stories were denied by ORCL, by the way, but the market seems to think ORCL is the one lying.
JP Morgan estimates a total of 122GW of data center capacity to be built in the US in the 2026–2030 time frame (base case). In other words, the entire hysteria is over 1% of total capacity that is being built.
Yesterday, the Megacaps shed over $400 billion. All the trillion-dollar tech giants fell on Wednesday. Nvidia, Broadcom, Tesla, and Google-parent Alphabet all shed 3–4% by the closing bell, racking up a total of $431 billion in lost market cap for the day.
In the end, it's hard to avoid the elephant in the room: the constant rotation out of the overcrowded hit tech and AI names—something I questioned a few days ago. Even after the ES sold off down to 6525, that liquidation was probably continuing into the recent push back up 5 days ago.
In terms of the ES’s overall tone, it was a gap-up followed by the same sell programs we’ve seen. In terms of the ES’s overall trade, volume was lower at 1.6 million contracts traded.
MiM
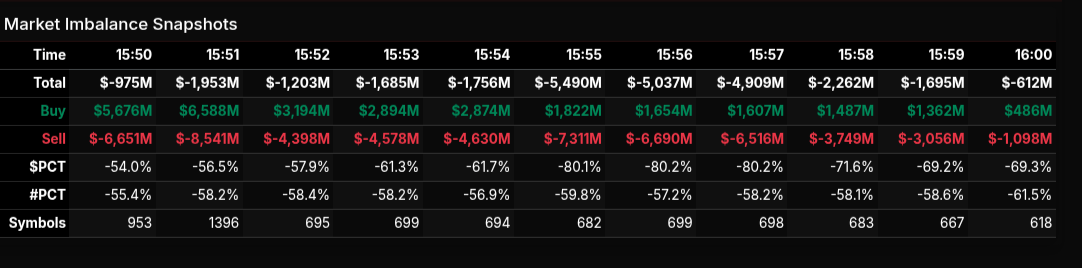
The market-on-close auction opened already leaning heavy to the sell side and never truly escaped that pressure. From the first meaningful snapshot at 15:51, total imbalance widened sharply, signaling institutional sell programs asserting control early. While there were intermittent buy responses, they functioned more as absorption attempts than true reversals, and the imbalance structure stayed decisively negative into the peak of the auction.
Between 15:54 and 15:56 the auction reached its most stressed phase, with total imbalances pressing beyond -$5 billion and sell-side percentages exceeding -80%. That degree of lean is notable and reflects wholesale selling rather than simple rotation. Although buy dollars remained active, they steadily faded while sell pressure expanded, confirming that sellers were dictating the close. After 15:56, sell intensity eased modestly, but the imbalance never meaningfully flipped, finishing the session still firmly negative.
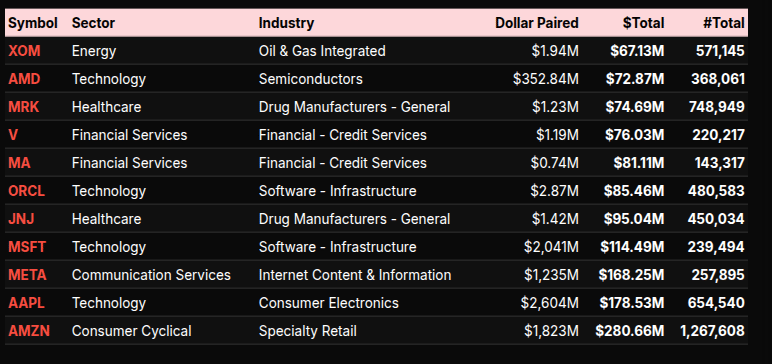
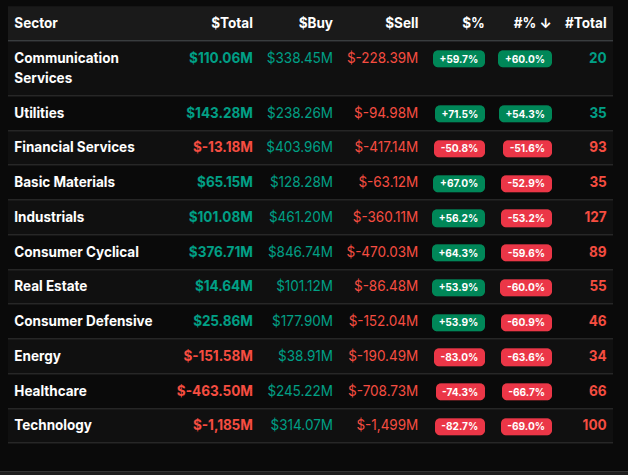
Sector flows reinforced this defensive tone. Technology and Healthcare stood out as the largest sources of sell pressure, both posting extreme negative leans near -80%, classic examples of institutional distribution rather than rotation. Energy also saw aggressive selling, with a similar -83% lean, adding to the risk-off profile. Financial Services showed a negative lean just over -50%, closer to rotational behavior, but the sheer symbol count on the sell side suggested persistent liquidation under the surface.
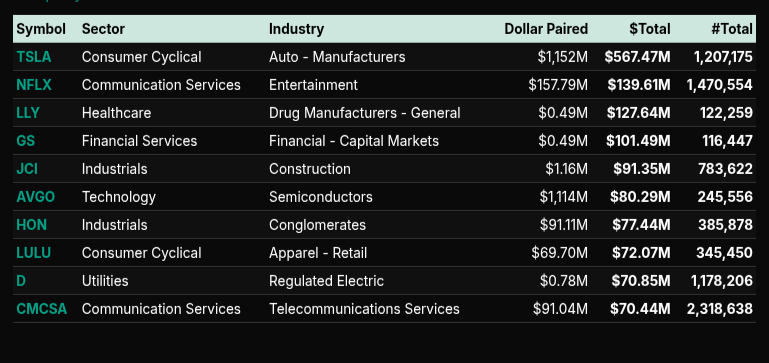
On the buy side, Utilities, Basic Materials, Industrials, and Consumer Cyclical attracted interest, many with leans in the +60% to +70% range. These flows, however, appeared more rotational than dominant, especially given that sell-side symbol counts often outnumbered buyers even in sectors showing positive dollar totals. Communication Services also posted a strong positive lean, driven by a narrow group of large-cap names rather than broad participation.
At the symbol level, selling concentrated in mega-cap technology and healthcare leaders, while selective buying appeared in consumer and industrial names. Overall, the imbalance data paints a clear picture: a seller-controlled MOC with limited late rescue attempts, consistent with broader distribution rather than a balanced or rotational close.


Guest Posts:
Dan @ GTC Traders
Betting For a Year-End Rally ... and Betting Against One
Markets and people love false binaries.
Either you’re “all-in” for a year-end melt-up … or you’re hiding under the desk waiting for the trapdoor to open.
We have found that portfolio’s return better results when you express differing views across programs, not slogans. Long? Or Short? Well, following that thought, as we sit here late in the year, we are ... quite intentionally ... doing both.
Betting For a Year-End Rally
(The Equity / Fixed-Income Hybrid Core)
At the core of the portfolio sits what we refer to as the diversified Equity–Fixed-Income Hybrid Core … designed to participate in upside while controlling volatility. These are risk assets, unapologetically so. And yes, we remain positioned to benefit from any year-end strength the market wants to give.
That exposure, however, is not naked at the moment. As Premium Members know … the core is modestly hedged, running roughly a 0.5 beta hedge, delta-weighted to the SPY. In plain English: if the portfolio’s aggregate beta to the S&P is “X,” we’re hedging approximately half of that exposure. At least … at the moment.
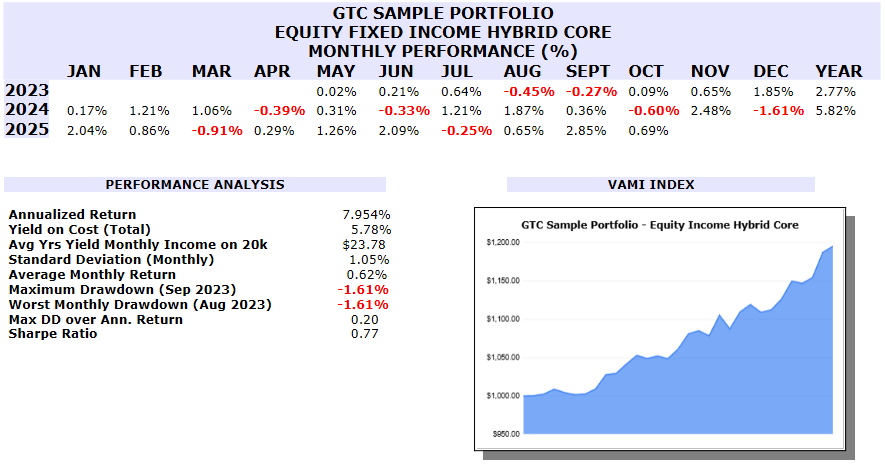
That framework has served us well. 2025 has been a solid year for the core book, and if markets decide to levitate into December, we’re happy participants. This is how you express constructive views without turning a portfolio into a one-way bet. You enjoy the rally … without betting the firm on it.
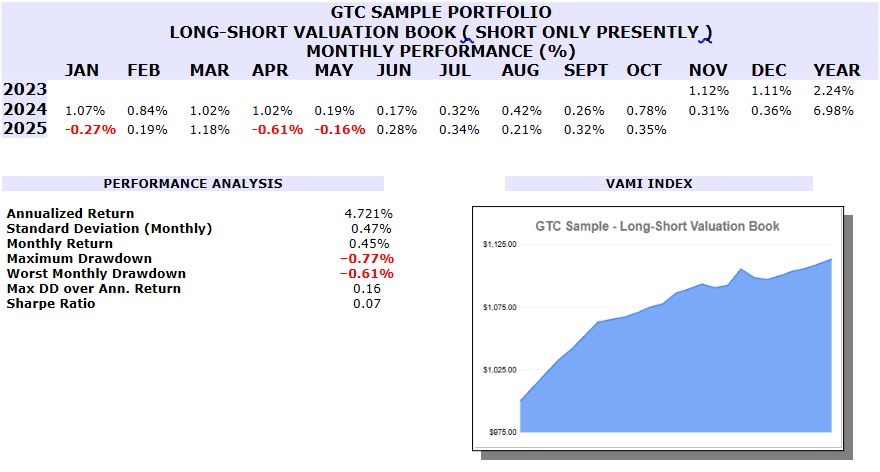
Betting Against a Year-End Rally
(The Long / Short Valuation Book)
Now for the part that tends to confuse people.
Away from the core, we run a separate long/short valuation program. From 2009 to 2018, we were happy participants buying assets we felt could be purchased at a deep value. But from November of 2023 … we have been running a short-only mandate. That book is not there to agree with the core. It’s there to do its own job, separate and unconcerned with the Equity Fixed Income Hybrid Core.
As of Wednesday afternoon … as Premium Members would tell you … that program initiated a short against the indices following a failure that, from a valuation and structure perspective, mattered. This is not a prediction that “the market must fall.” It is a trade based on what didn’t happen when it needed to.
Important distinction.
This book does not care whether headlines are bullish, seasonal flows are positive, or Twitter has decided a Santa Rally is “guaranteed.” It responds to valuation, regime, and structure. Sometimes that puts it aligned with the core. Sometimes? Like now … it puts it directly opposite.
And that’s not a bug. That’s the design. It’s the feature.
Non-Correlation for the Win
Time like now … is when this philosophy becomes visible.
Right now, one program has us long many risk assets (with a hedge). Another has us net short as of Wednesday afternoon. That coexistence is not confusion. It’s non-correlation doing exactly what it’s supposed to do. Leading to better risk adjusted results. Which is why our total portfolio returns are so … smooth. And linear.
Markets don’t require ideological consistency. Portfolios require structural consistency.
If the year-end rally continues? The core participates.
If it fails? The valuation book is positioned.
If nothing dramatic happens? The diversification still matters.
This is why … at least in our view? We don’t run “calls” per se. We run programs.
And why betting for a rally and betting against one can coexist… without contradiction.
Technical Edge
Fair Values for December 18, 2025
S&P: 53.39
NQ: 226.19
Dow: 334.42
Daily Breadth Data 📊
For Wednesday, December 17, 2025
NYSE Breadth: 49% Upside Volume
Nasdaq Breadth: 33% Upside Volume
Total Breadth: 36% Upside Volume
NYSE Advance/Decline: 44% Advance
Nasdaq Advance/Decline: 32% Advance
Total Advance/Decline: 37% Advance
NYSE New Highs/New Lows: 67 / 33
Nasdaq New Highs/New Lows: 93 / 258
NYSE TRIN: 0.98
Nasdaq TRIN: 0.93
Weekly Breadth Data 📈
For the Week Ending Friday, December 12, 2025
NYSE Breadth: 53% Upside Volume
Nasdaq Breadth: 52% Upside Volume
Total Breadth: 52% Upside Volume
NYSE Advance/Decline: 56% Advance
Nasdaq Advance/Decline: 49% Advance
Total Advance/Decline: 52% Advance
NYSE New Highs/New Lows: 344 / 76
Nasdaq New Highs/New Lows: 616 / 306
NYSE TRIN: 1.05
Nasdaq TRIN: 0.89
S&P 500/NQ 100 BTS Trading Levels (Premium Only)
BTS are daily generated levels created using a combination of proprietary calculations and AI to define an upper range target and a lower range target, split by a bull/bear line. You receive daily charts along with clear descriptions of each level to help guide your trading.
Take a Free Premium Trial to see them in action.

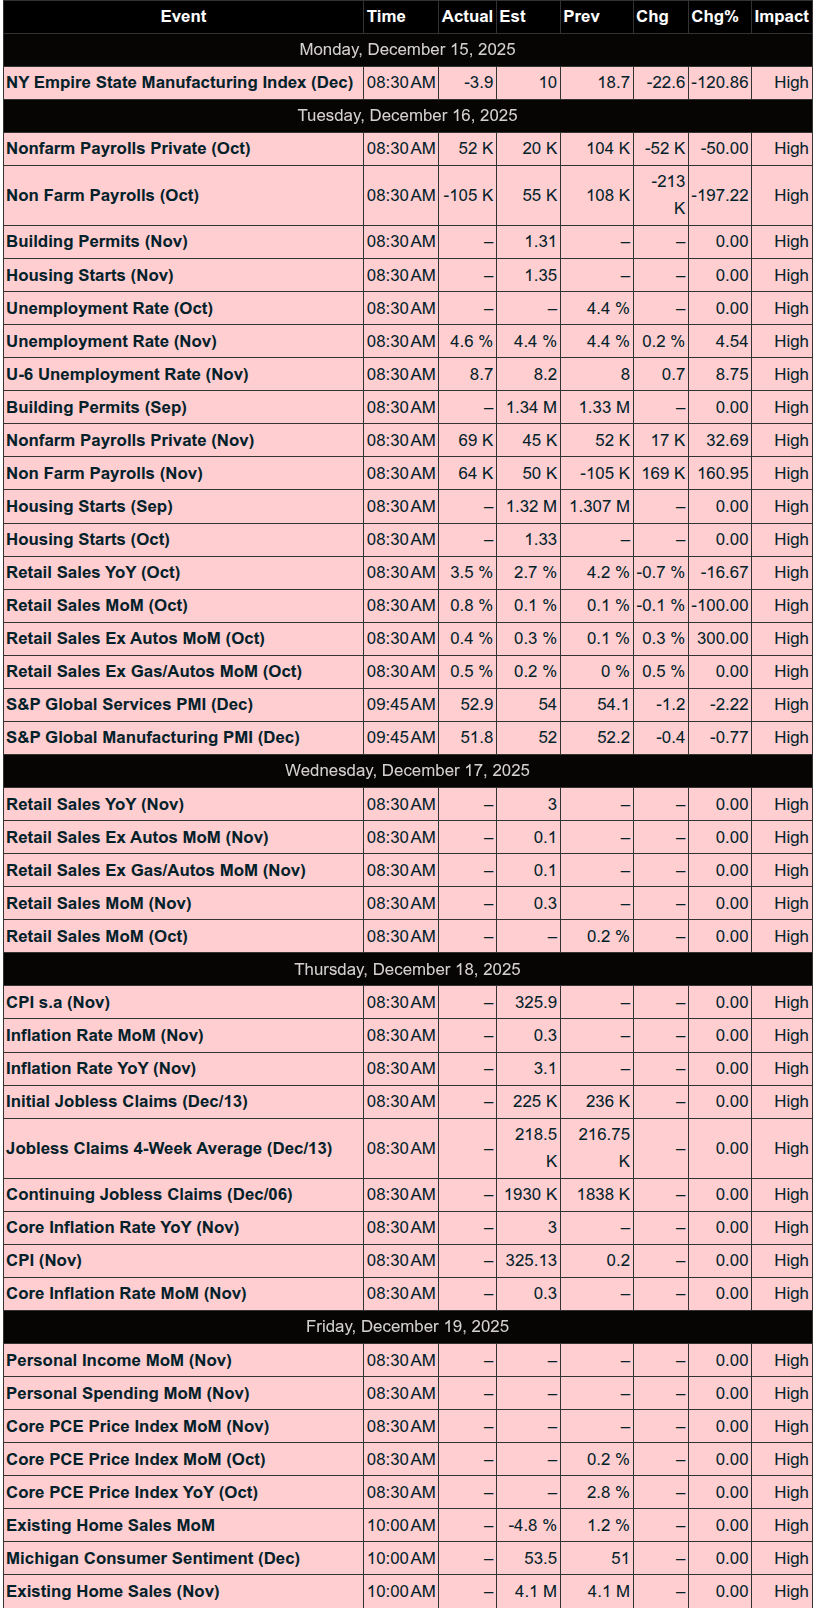
Economic Calendar Today

This Week’s High Importance
Earnings:


Trading Room News:
PTG Room Summary – Wednesday, December 17, 2025
Theme of the Day: “Textbook Cycle Day 1 – Decline with Ultra Precision”
Strong Start – Setup #1 Win
The day kicked off with confidence and clarity. Manny nailed a quick +5 pts right out of the gate using Setup #1 (Support Buy at 6867–6871), confirming the effectiveness of the trade plan. David highlighted the importance of early wins, setting the tone for disciplined execution.
Trend Day Down – Cycle Day 1 in Full Effect
Yesterday unfolded as a textbook Cycle Day 1, which implies a directional move with expanding range – and that’s exactly what we got:
Bearish momentum dominated as projected support levels failed to hold.
David masterfully tracked each GEX level (6819, 6810, etc.) with real-time commentary and charts, offering clear reads on order flow and directional bias.
The projected Cycle Day 1 levels (from average decline to violation) were tagged with remarkable accuracy:
📍 Average Decline: 6798.42 – tagged and noted
📍 Projected Range Low: 6793.74 – fulfilled
📍 Final downside target: 6775 – hit right into the close
David’s phrase "Ultra Precision" and "Laser Precision" were well earned today. Even Bruce F commented on the uncanny accuracy.
Educational Highlights & Lessons Learned
Manny practiced solid discipline, stepping away after a stop hit per his “Stop Loss Protocol (S.L.P.)” – a strong example of emotional control and managing psychological capital.
David reinforced Cycle Day logic, walking the room through the structural levels with transparency and teaching moments.
The CL Open Range trade was broken down for CSmith in real-time, offering insight into trade management and Sierra Chart visuals.
Afternoon chop was noted, and expiration week + rollover were identified as contributing factors.
Closing Action & MOC
Massive MOC Sell Imbalance: Grew from $1.7B to $5B into the close.
The market closed on the lows, completing the cycle narrative to the downside.
David wrapped the day confirming all targets met, including the unposted 127.2% extension to 6775, which is now marked as a Key Low Marker.
Key Takeaways
Plan your trades, and trade your plan – Setup #1 worked cleanly when respected.
Cycle analysis and GEX levels provided surgical precision for targeting.
Discipline matters – stepping away after stops, staying patient, and not forcing trades during chop are hallmarks of professional behavior.
DTG Room Preview – Thursday, December 18, 2025
Focus:
Markets are bracing for the 8:30am ET release of delayed CPI data, the first inflation reading since September. With no October data due to the shutdown, today’s report lacks month-to-month comparisons. Headline inflation is expected to remain well above the Fed's 2% target.
Macro & Geopolitics:
China boosted rare earth exports by 13% in November as regulatory easing kicks in, potentially easing tech sector supply constraints.
President Trump delivered a primetime address, unveiling a $1,776 “Warrior Dividend” for military personnel and previewing housing reforms and mortgage rate relief.
Crypto:
Bitcoin has dropped 30% from its peak. Long-term holders are exiting at the fastest pace in 5 years, while ETF flows, derivatives volumes, and retail interest are all waning.
Equities & Earnings:
Micron (MU) surged ~10% after crushing earnings; CEO expects memory chip shortages through 2026 with demand driven by AI data centers.
Key earnings today: Accenture (CAN), Cintas (CTAS), Darden (DRI), FDS (pre-market); FedEx (FDX), Nike (NKE), HEI (after hours); Carnival (CCL), Paychex (PAYX) on Friday.
Market Technicals & Flow:
Volatility rising: ES 5-day ADR is 94.25 points.
Whale flow bullish into the CPI release.
ES short-term trend is bearish, trading below the 50-day MA (6847.50). Bears eye a breakdown; bulls need a close back above the MA.
Key Levels:
Resistance: 6851/46, 7050/55, 7455/60
Support: 6770/65, 6374/69
Eco Data at 8:30am ET:
Delayed CPI, Weekly Jobless Claims, Philly Fed Manufacturing Index.

