- The Opening Print
- Posts
- Opex Fry-Day Is Here. Can Bulls Stop the Bleeding?
Opex Fry-Day Is Here. Can Bulls Stop the Bleeding?
The ES suffered its worst day in almost a month.
Danny Riley
April 21, 2023
Follow @MrTopStep on Twitter and please share if you find our work valuable.
On Thursday, we had a number of individual stock trades on watch outside of tech. Different traders likely took different setups, so I have updated them all below in the “open positions” section. Cheers!
Our View
It’s really been an interesting trade over the last few weeks. We’re going into Monthly Opex today and the earnings engine is starting to fire up. Aside from the big banks, we’re not getting that great of reactions so far.
Is it time for money to rotate out of tech and find a new home?
Last week we noted the strength in defensive stocks — like MCD at all-time highs, PEP, KO, PG etc. — and yesterday’s post was littered with picks in the healthcare space, which has been hot as well.
The direction of tech will really be determined once FAANG starts reporting, but the reaction from NFLX and TSLA was uninspiring to say the least.
Our Lean
My friend Jeff Hirsch from the Trader’s Almanac sent me these charts, which are the historical performances for April and the full year.
For April, it shows the performance over the last 21 years vs. where we’re tracking now.
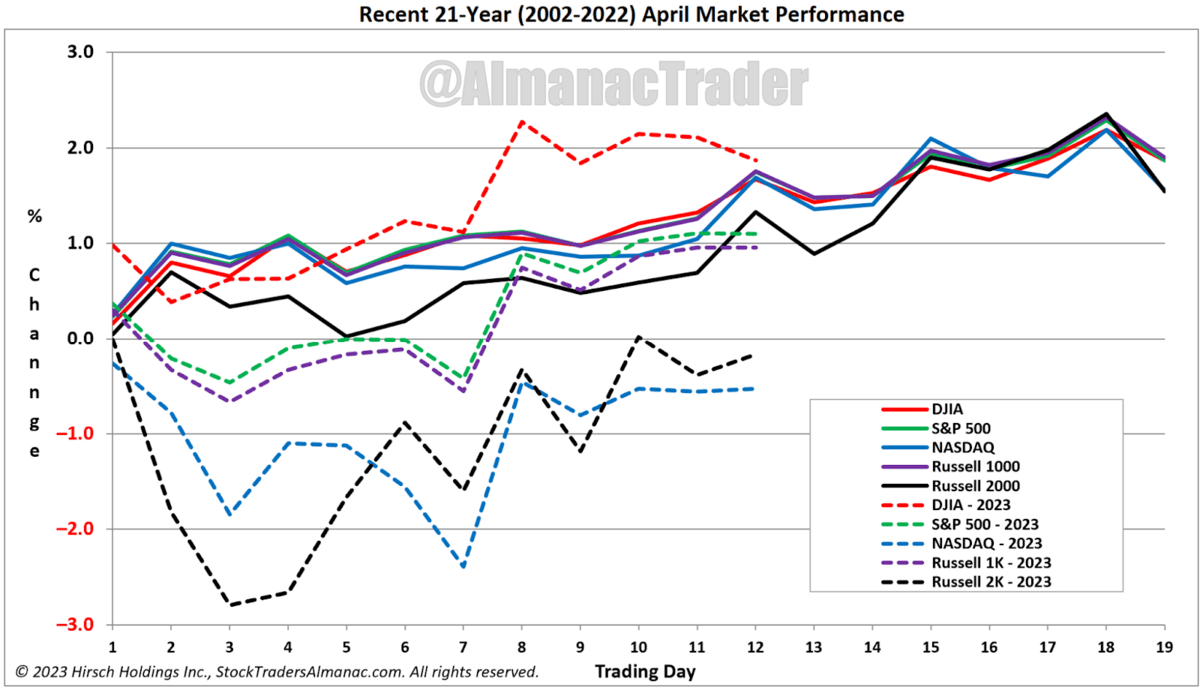
April
For the full year, it shows how the S&P 500 is tracking in pre-election years with various contributing factors and observations.
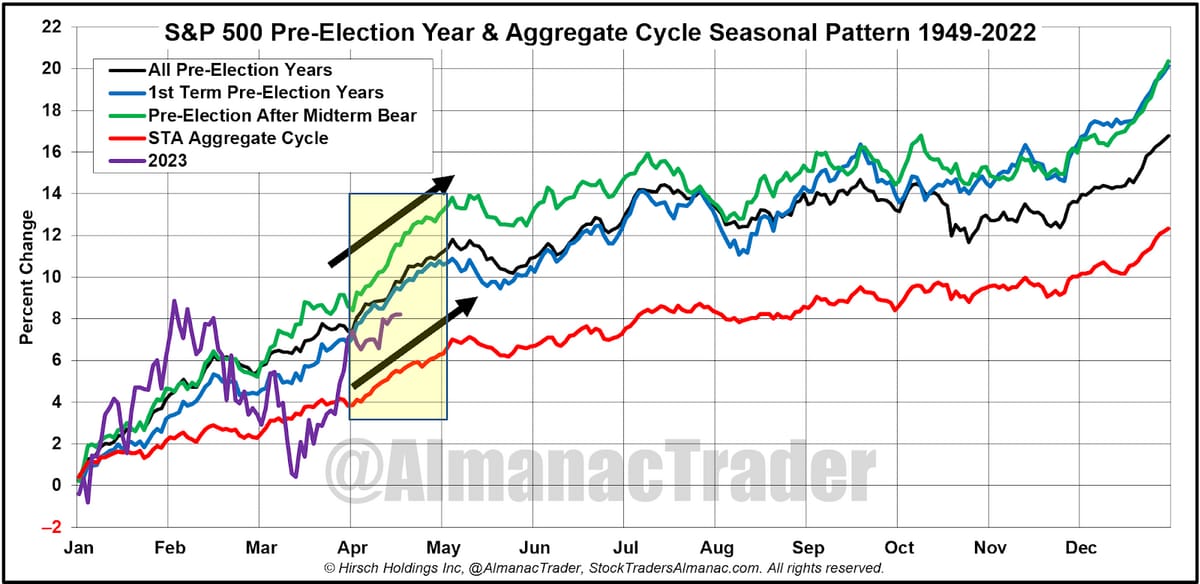
Pre-election years
So where does that leave us for Opex?
Going into Friday, we’re now seeing a change of pace. As opposed to rallying off the open, dipping, then rallying hard, we’ve opened down notably the last two sessions.
On both days, they gobbled up the opening dip — remember, it’s hard to sell a gap-down in an “up” tape.
However, late-day selling pressure on Thursday sent the S&P lower until a big 20 handle spike in the final 10 minutes. Considering we only had a trading range of 35 points during the regular-hours session, that’s a pretty big spike, but not surprising given the recent pattern of late-day strength.
Our Lean: I want to go “nice and easy today.” Opex days are difficult to trade as the price action can be erratic. We’ve navigated the current sequence pretty well so far and I don’t want to get ahead of our skis.
Continue to play the ranges. If we get an opening pop up into the 4175-80 area, I’d look to sell it. If we get an opening dip into the 4137-4140 area, I’d try to buy it while using yesterday’s low as my pivot area.
If the ES continues beyond either of those zones, watch 4200 on the upside and 4115 on the downside.
MiM and Daily Recap
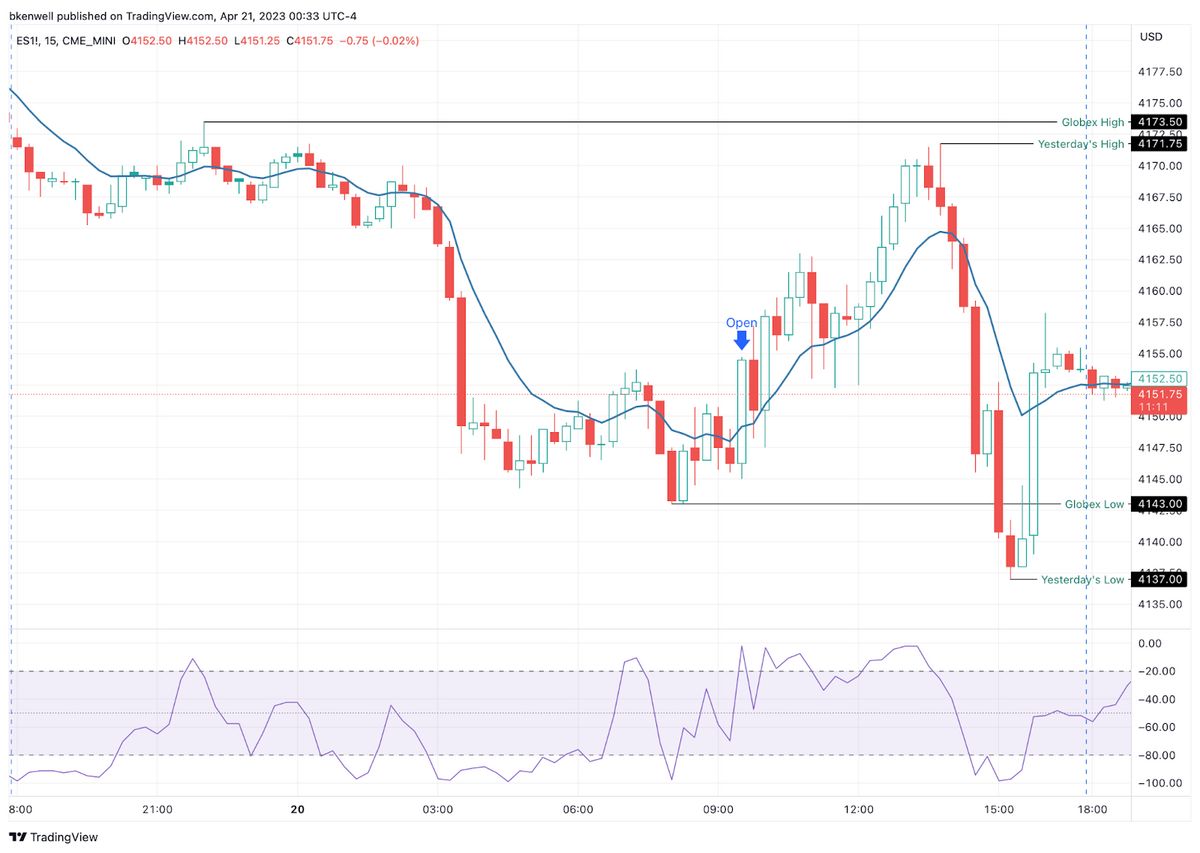
The ES traded down to 4143 on Globex and opened Thursday's regular session at 4146. After the open, the ES rallied up to the VWAP 4157.25, dropped down to 4147.50 at 10:02 and then rallied 4163 at 10:54. From there, it sold off down to 4152.25 at 11:36, then rallied back up to 4171 at 1:45.
That started a ~35 handle drop, as the ES fell 26 points down to 4145.50 at 2:30, bounced 7.25 points over the next 20 minutes then fell another 15 points to the session low of 4137 at 3:25. The ES bounced a bit, trading 4142.75 as the 3:50 cash imbalance showed $578 million for sale. The ES dipped 3.75 points, then ripped higher by 15 points, before closing at 4135.50. It settled at 4135.75, down 26 points or 0.52%.
It’s hard to believe it, but in the end, the ES suffered its worst one-day drop (26 points) since March 22nd. In terms of the ES’s overall tone, it was firm until the afternoon. In terms of the ES’s overall trade, volume was higher at 1.71 million contracts.
Technical Edge —
NYSE Breadth: 26% Upside Volume
Advance/Decline: 36% Advance
VIX: ~$17.10
We loaded a ton of individual setups on Thursday, as healthcare gave us quick buys against the weakness in the Nasdaq (and TSLA).
So let’s keep today super simple and not look at too many setups. Opex days are notoriously choppy and difficult to trade. Let’s see if this ends up as one of them.
S&P 500 — ES
The ES held the 4140 to 4145 area, then held the 10-day by the close after a late-day jump.
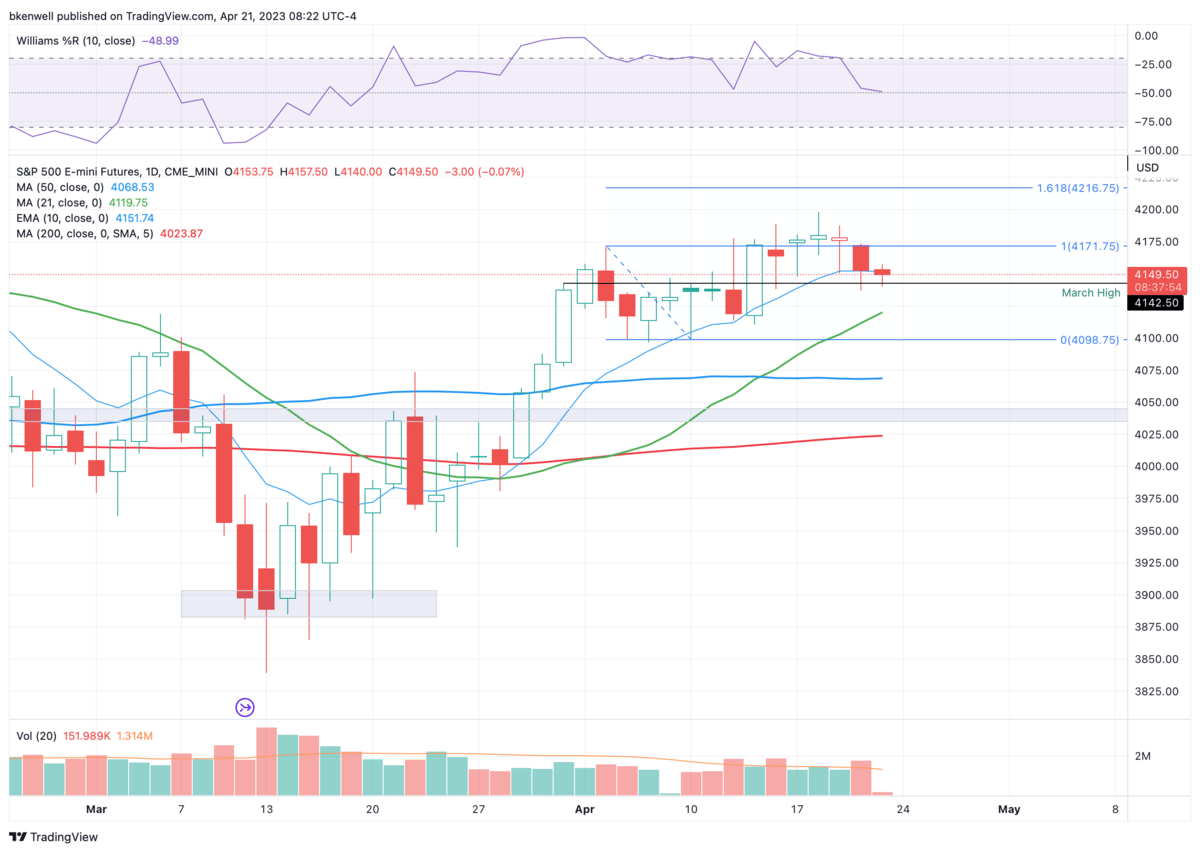
Key Pivot: 4150
Upside Levels: 4175-80, 4200, 4217-25
Downside levels: 4137-4140, 4115, 4095-4100
SPY
$415-16 resistance is clear. Let’s see if the SPY can hold yesterday’s low of $410.27 and the March high at $409.70.
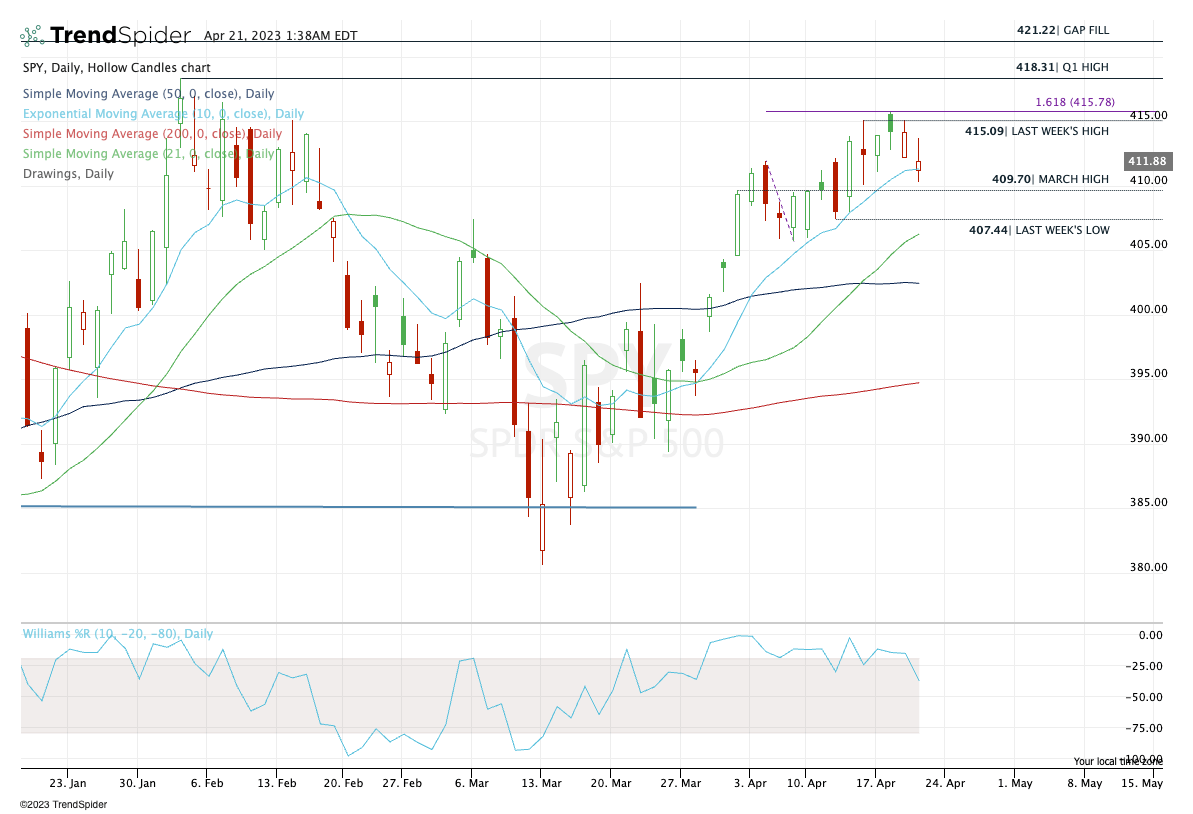
SPY Daily
Upside Levels: $415 to $416, ~$418.25, $421
Downside Levels: $410-ish, $407.50, $405.50 to $406
SPX
Doji-candle the day before Opex? Why am I not surprised?
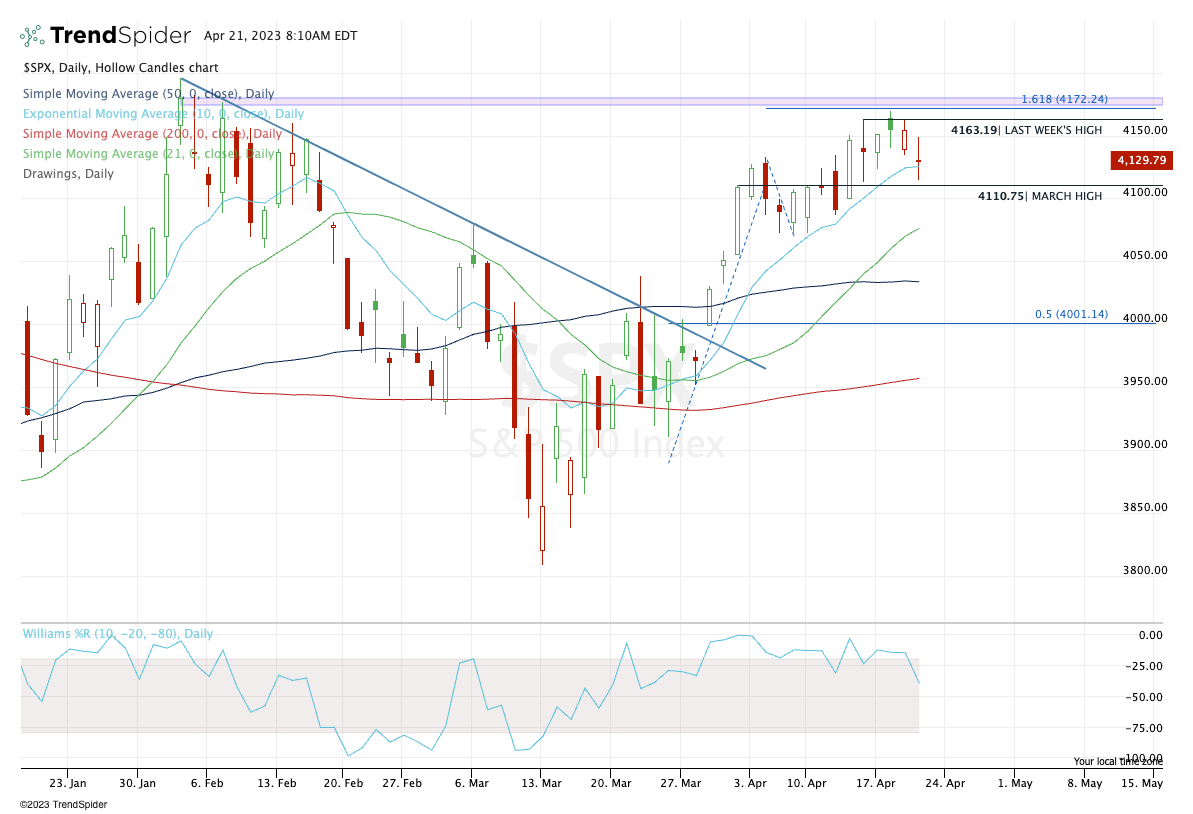
SPX Daily
Upside Levels: 4150, 4163 4172-75, 4195-4200
Downside Levels: 4110-12, 4091, 4070-75
TSLA
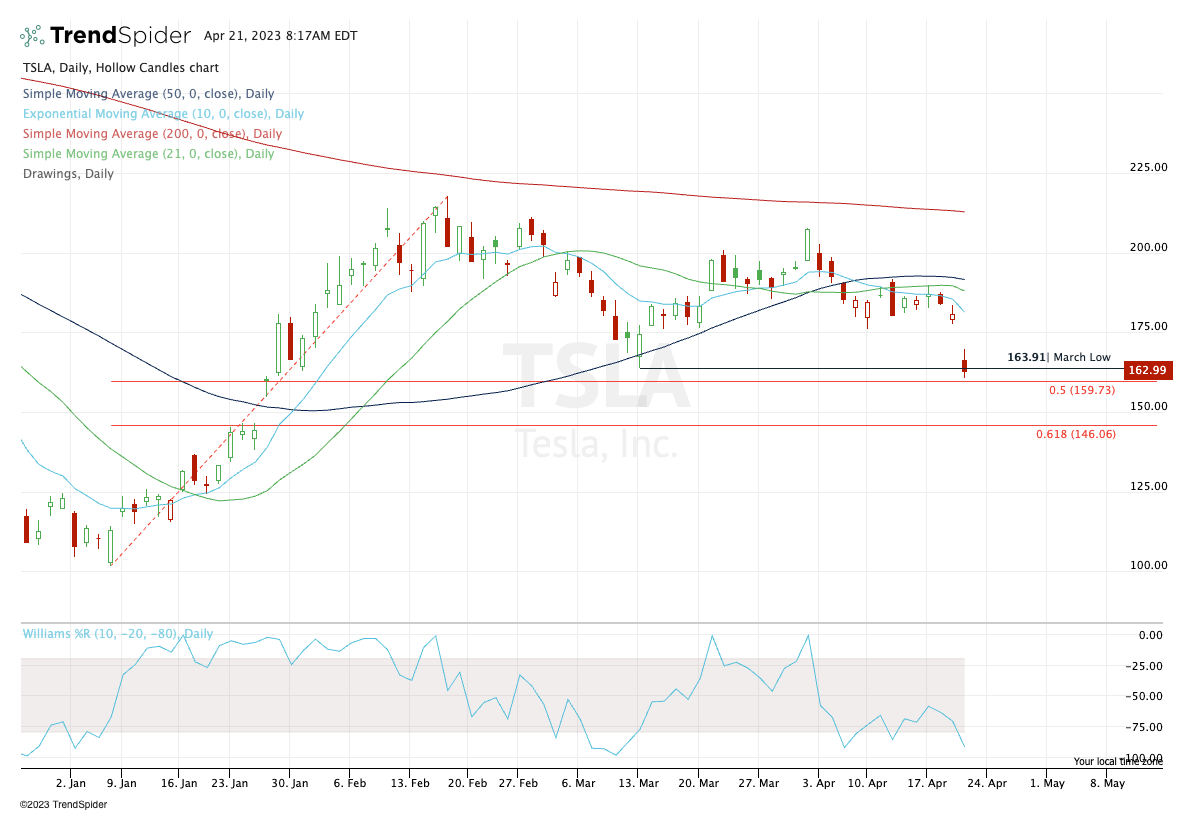
TSLA Daily
This is for aggressive traders only, but I am looking at TSLA to see if it can regain the March low near $164.
Specifically, I’m looking for an open below this level, then a move up through $164 to get me long, with a stop-loss around $160.
This is a cash flow scalp for me, so I’m looking to get paid by trimming early and often, likely in the $165-$166 area, then $167.50-ish. If we clear yesterday’s high near $169.70, we can look to trim down more and possibly swing trade a partial position.
Open Positions
Bold are the trades with recent updates.
Italics show means the trade is closed.
Any positions that get down to ¼ or less (AKA runners) are removed from the list below and left up to you to manage. My only suggestion would be B/E or better stops.)
** = previous trade setup we are stalking.
AAPL — for those that were swinging AAPL for the longer timeframe, we got our $165 area to trim into and as we continue to tip-toe higher, I’d say down to ½ size here or even less.
Going for $168.50 to $170 on the next tranche. Raise stops up to $160.
GE — long from ~$94.50 and got our $100+ target. Down to Runners.
AMD — Long from $88.50 — $92 to $93 is ideal first trim, ⅓. $95+ is the second target.
I’m using $87 as my stop-loss, but you can admittedly go tighter than that and/or use a B/E stop.
**DIA — 10-day ema may be a worthwhile dip buy in the DIA if we see it today — If took, look to trim on any NHOD, then $339.50 to $340. Stop can be a 30- or 60-minute close just below Thursday’s low.
ABBV — long over $161.50 — Target $162.50+ for first trim, $163.25+ to get down to ½ position.
Stop at $158
CAH — long from $79 as a scalp vs. $78.50 low — $80 was a trim spot (resistance). Now Breakeven stop, fish for $80.50+ to get down to ½ or less.
LLY — Long from daily-up over $370.50 — ⅓ trim at $375+ as per plan.
$377-78 is next trim spot, followed by $380-82. Breakeven stop.
**XLV — no daily up trigger — but can adjust entry down to a rotation up through Thursday’s high of $133.60.
**BRK.B — look for a test of $319-ish and the 10-day ema. That’s a Buy-the-Dip setup in my view (setup from Thursday).
Go-To Watchlist
Feel free to build your own trades off these relative strength leaders
Relative strength leaders → Tech remains absolutely the strongest group lately.
MCD, PEP & KO, WMT, PG — XLP
ABBV, LLY — XLV
NVDA, AMD
MSFT, AAPL, META
PANW, FTNT
FSLR
AQUA
GE
DKS, ULTA
LMT, RTX
GOOGL, AVGO
ULTA & LULU
MELI
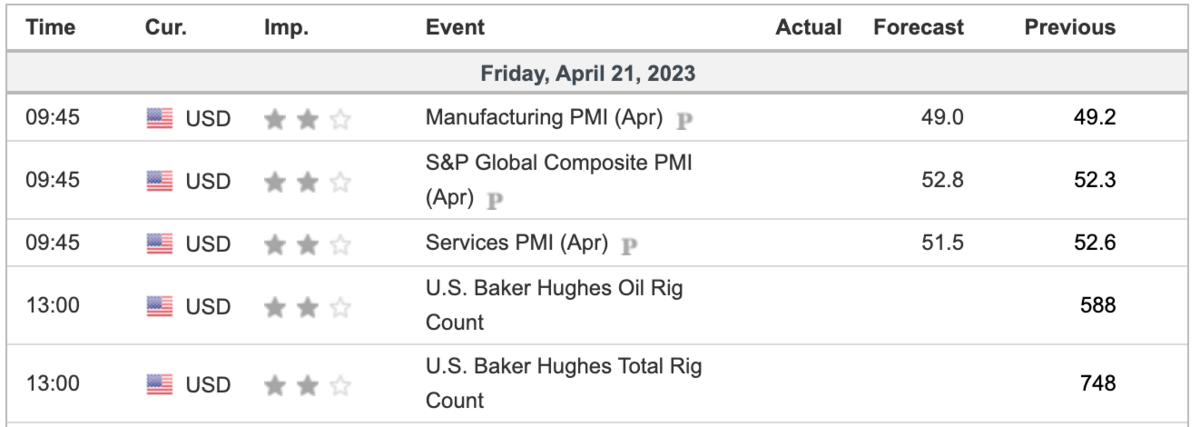
Economic Calendar