- The Opening Print
- Posts
- Not a Correction Yet, The S&P’s Pullback Not Done Shaking the Weak Hands
Not a Correction Yet, The S&P’s Pullback Not Done Shaking the Weak Hands
Follow @MrTopStep on Twitter and please share if you find our work valuable!
Our View
The S&P 500 is trading around 6,700–6,900 (recent closes include ~6,740 on March 6 amid volatility, with levels dipping from highs near 7,000 earlier in the year), following strong multi-year gains driven by tech/AI momentum, resilient growth, and Fed easing—echoing historical post-rally dynamics where strong fundamentals don't always deliver smooth, linear advances.
Key historical parallels include:
1950s post-war boom: (e.g., 1953–1968 regime with ~10% annualized S&P gains amid low inflation, productivity surges, and infrastructure/consumer expansion), where the market rallied robustly after Depression/WWII scars but featured consolidation pauses, minor corrections (like 1957's dip), and "wall of worry" climbs—much like today's digestion after 2023–2025 double-digit runs, with potential for choppy periods before resumption.
Mid-20th-century patterns: (1950s–1960s) show prolonged sideways or flat stretches after big rallies despite solid GDP growth, similar to the Dow's 1956–1972 path to 1000; today's high valuations (e.g., Shiller CAPE elevated, market 200%+ above long-term trend) and concentration in mega caps rhyme with late-1960s/early-1970s "Nifty Fifty" era, where premium stocks led before broader corrections and stagflation hit (1970s annualized gains near flat in real terms).
Recent analogs: like the 1990s dot-com buildup (overlapping multi-year 20%+ streaks) or post-GFC boom (2009–present regime) highlight how extended bull runs can persist longer than expected—even with stretched valuations—if earnings and innovation (e.g., AI productivity) deliver, but often face volatility, leadership shifts, or pullbacks.
Current context shows optimism for continued gains: Wall Street forecasts average 12% total return for 2026 (e.g., Goldman Sachs, others targeting ~7,500 year-end), potentially marking a rare fourth straight positive year; midterm presidential cycle historically favors strong returns (19% average in such years); and fourth-year bull market performance averages >14% in past cycles. However, risks loom—high concentration, tariff/geopolitical pressures, sticky inflation echoes, and historical warnings of plunges or muted returns after extreme overshoots (e.g., post-1990s or 1970s parallels). The timeless lesson from these eras: markets reward patience through consolidation and turbulence, as underlying economic drivers (innovation, productivity, demographics) propel eventual new highs, though patience is key when “climbing the wall of worry.”
S&P 500 Major Drawdowns (Through March 2026)
Threshold | Last Trough | Peak → Trough Dates | Max Decline | Primary Drivers |
|---|---|---|---|---|
10% Correction | March 2025 | Feb '25 – Mar '25 | ~10.1% | Post-inauguration volatility |
15% Pullback | March 2025 | Feb '25 – Mar '25 | ~15.0% | Deepened Q1 2025 correction |
20% Bear Market | Oct 2022 | Jan '22 – Oct '22 | -25.4% | Inflation & Fed tightening |
25% Drop | Oct 2022 | Jan '22 – Oct '22 | -25.4% | Same as 2022 Bear Market |
I don't have the answer to what I call the “state of affairs,” but as I have said, I doubt Iran is just going to walk away from the current conflict. I also do not think it's a good idea to try to protect oil takers or have boots on the ground in Iran.
The ES is only down 4.3% from its 7043 high, which I think is a standard “pullback.” It would need to drop to approximately 6339 (a 10% decline from the peak) to officially enter correction territory.
Yes, I used AI for part of the view, but it was my question and not taken from any news source or periodical.
Our Lean
Market Recap
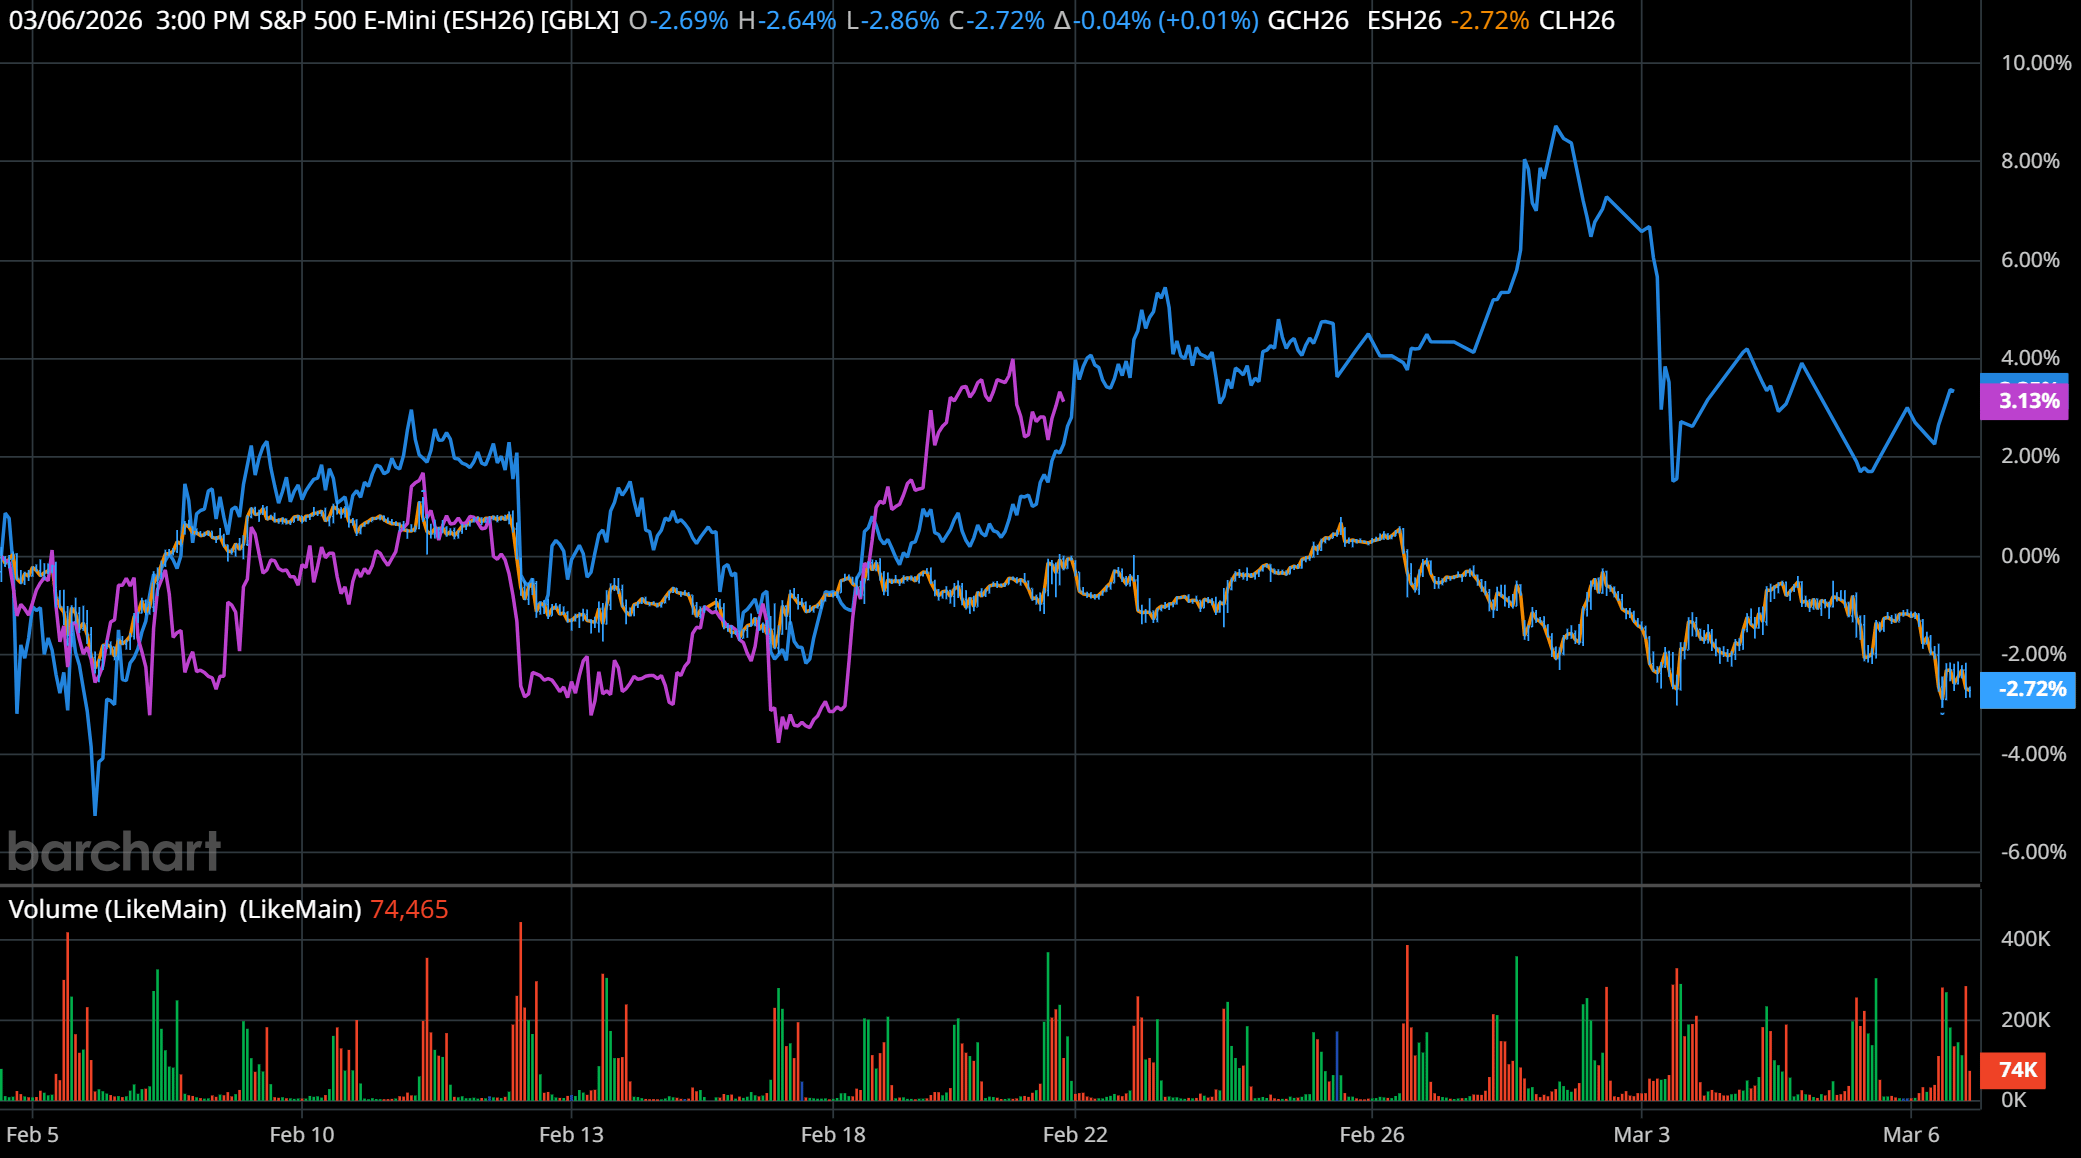
5-Day ESH26 vs GCH26 vs CLH26 Chart
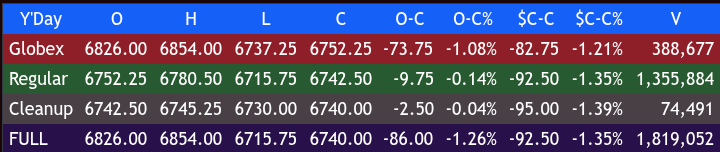
It was no surprise that the ES sold off down to 6783.75 on Globex, and I was I not surprised that the ES tanked down to 6736.75 after the Nonfarm payrolls fell by 92,000 for the month, compared to the estimate for 50,000 and below the downwardly revised January total of 126,000. February marked the third time in the past five months that payrolls declined, following a sharp revision showing a drop of 17,000 in December.
The ES opened FRYday’s regular session at 6752.25, down 82.75 points or -1.23%.. After the open, the ES traded up to 6759.25, sold off 44.00 points down to 6715.25 at 9:55, rallied 62.75 points up to 6778.00 at 10:35, and dropped 35.00 points down to a higher low at 6743.00 at 10:50.
The ES then rallied up to a new high at 6779.00 at 11:00, pulled back to 6752.75 at 11:30, and rallied up to a 6779.00 double top. It then sold off 40.00 points down to 6739.00 at 12:40, rallied 41.25 points up to a 6780.25 double top at 1:15, and pulled back to 6755.50 at 1:50.
The ES rallied up to 6775.25 at 2:20, pulled back to 6660.50 at 2:45, rallied up to a lower high at 6778.50 at 3:00, and traded down to 6729.50 at 3:38. It then rallied up to 6752.50 at 3:41 and traded 6747.00 as the 3:50 imbalance showed $1 billion for sale, rallied up to 6752.50 at 3:40, and traded 6742.50 on the 4:00 cash close.
After 4:00, the ES traded down 6729.75, rallied up to 6745.25, and closed down 95. points on from Thursday’s close (-1.349) to 6,740.00, while the Nasdaq 100 E-Mini (NQH26) dropped 379.25 points (-1.51%) to 24,670.25. The Dow Futures Mini (YMH26) declined 466 points (-0.97%) to 47,517, and the Russell 2000 E-Mini (QRH26) saw the steepest loss, sliding 59.70 points (-2.31%**) to end at 2,526.70.
In the end, it was a hellish week for the index markets, marked by an overload of headlines and volatile up and down moves. In terms of the ES’s overall tone, it acted weak. In terms of the ES’s overall trade, volume was steady all day with a total of 1.83 million contracts traded.
No one promised us a rose garden, but they also didn’t promise economic and geopolitical armageddon.
As of early March 2026, the US economy faces several interconnected challenges. Recent data shows softening job growth (e.g., recent monthly job losses and unemployment around 4.4–4.5%), persistent inflation pressures above the Fed's 2% target, and policy-driven headwinds. Public concern remains high around affordability, with many Americans citing the cost of living as a top issue.
Here are the top 6 problems currently weighing on the US economy, based on analyses from sources like Stanford SIEPR, Brookings, CBO, and recent economic reports:
Weakening labor market and slow job creation
The job market has shifted to a “low-hire, low-fire” dynamic, with very low monthly hiring (sometimes near zero or negative sustainable levels due to reduced immigration). Recent reports show net job losses in some months, rising unemployment (especially among young workers), and long-term unemployment at concerning levels. This limits broader economic momentum and strains consumer confidence.
Persistent inflation and affordability crunch
Inflation remains “sticky” (core measures often above 3%), driven partly by tariffs, energy price shocks (e.g., from geopolitical events like the Iran conflict), and other factors. This combines with high costs for essentials—food, housing, health care, and utilities—creating a “stagflation-lite” environment where prices rise while real wage growth lags, hitting middle- and lower-income households hardest.
High and rising national debt / fiscal deficits
Federal deficits are large (around $1.9 trillion projected for FY 2026), pushing debt toward 120%+ of GDP in the coming years. Unsustainable paths risk higher interest rates, crowding out private investment, and limiting fiscal flexibility for future crises.
Tariff policies and trade disruptions
Ongoing or elevated tariffs act as a headwind by raising input costs, contributing to inflation, and creating uncertainty for businesses and supply chains. While some effects have been absorbed so far, persistent or escalating tariffs could further slow growth and job creation.
Risk of stagflation or stagflation-lite conditions
A combination of elevated inflation and rising unemployment (without strong growth) creates widespread economic discomfort. This is harder to reverse once entrenched, with concerns that policy mixes (tariffs + immigration restrictions + fiscal pressures) could push the economy toward this scenario.
Geopolitical and energy price risks (including oil shocks)
Conflicts (e.g., involving Iran) have driven oil and energy prices higher, adding to inflation and reducing consumer spending power. This compounds other pressures on retail sales and overall demand, with potential for broader market volatility.
Week Ahead
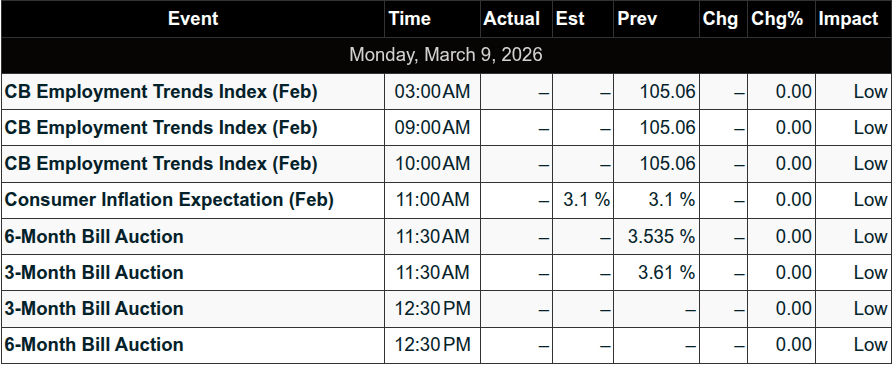
MONDAY, MARCH 9
None scheduled
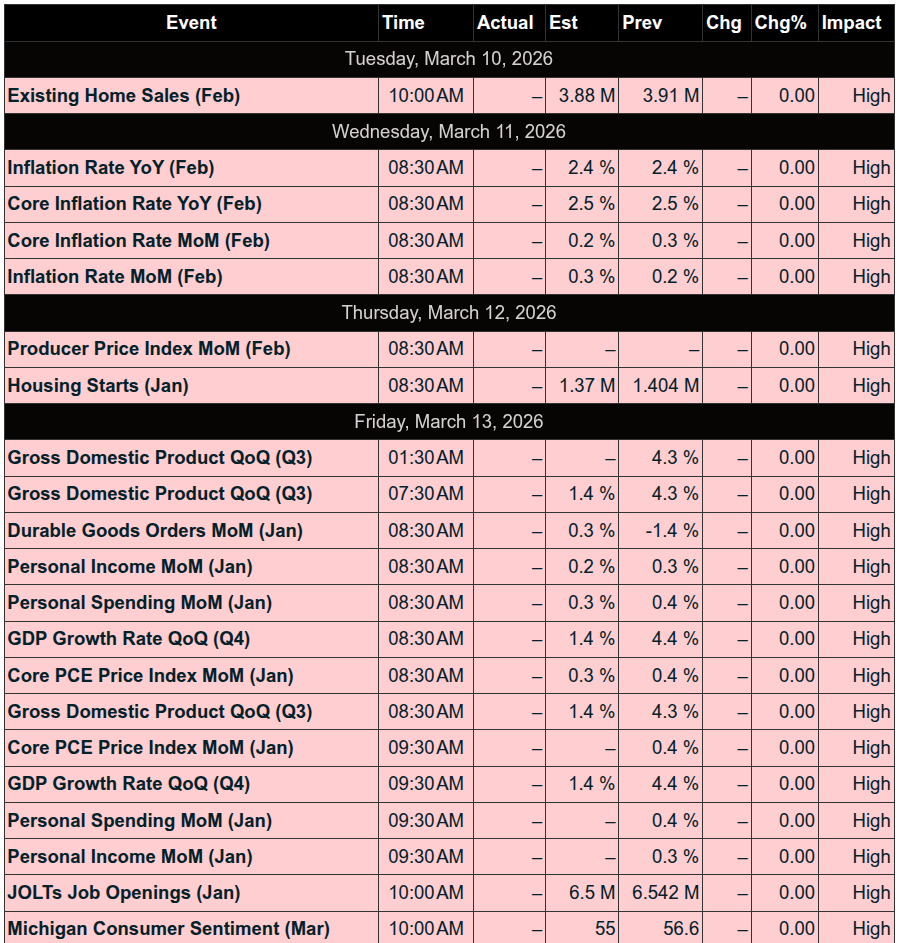
TUESDAY, MARCH 10
6:00 am: NFIB optimism index (Feb)
10:00 am: Existing home sales (Feb)
WEDNESDAY, MARCH 11
8:30 am: Consumer price index (Feb)
2:00 pm: Monthly U.S. federal budget (Feb)
THURSDAY, MARCH 12
8:30 am: Initial jobless claims (March 7)
8:30 am: U.S. trade deficit (Jan)
8:30 am: Housing starts (Feb)
8:30 am: Building permits (Feb)
FRIDAY, MARCH 13
8:30 am: GDP (first revision) (Q4)
8:30 am: Personal income (Jan)
8:30 am: Personal spending (Jan)
8:30 am: Durable-goods orders (Jan)
10:00 am: Job openings (Jan)
10:00 am: Consumer sentiment (prelim) (March)

Guest Posts
Trey Oglesby - Weekly Charts
Rich Miller: HandelStats
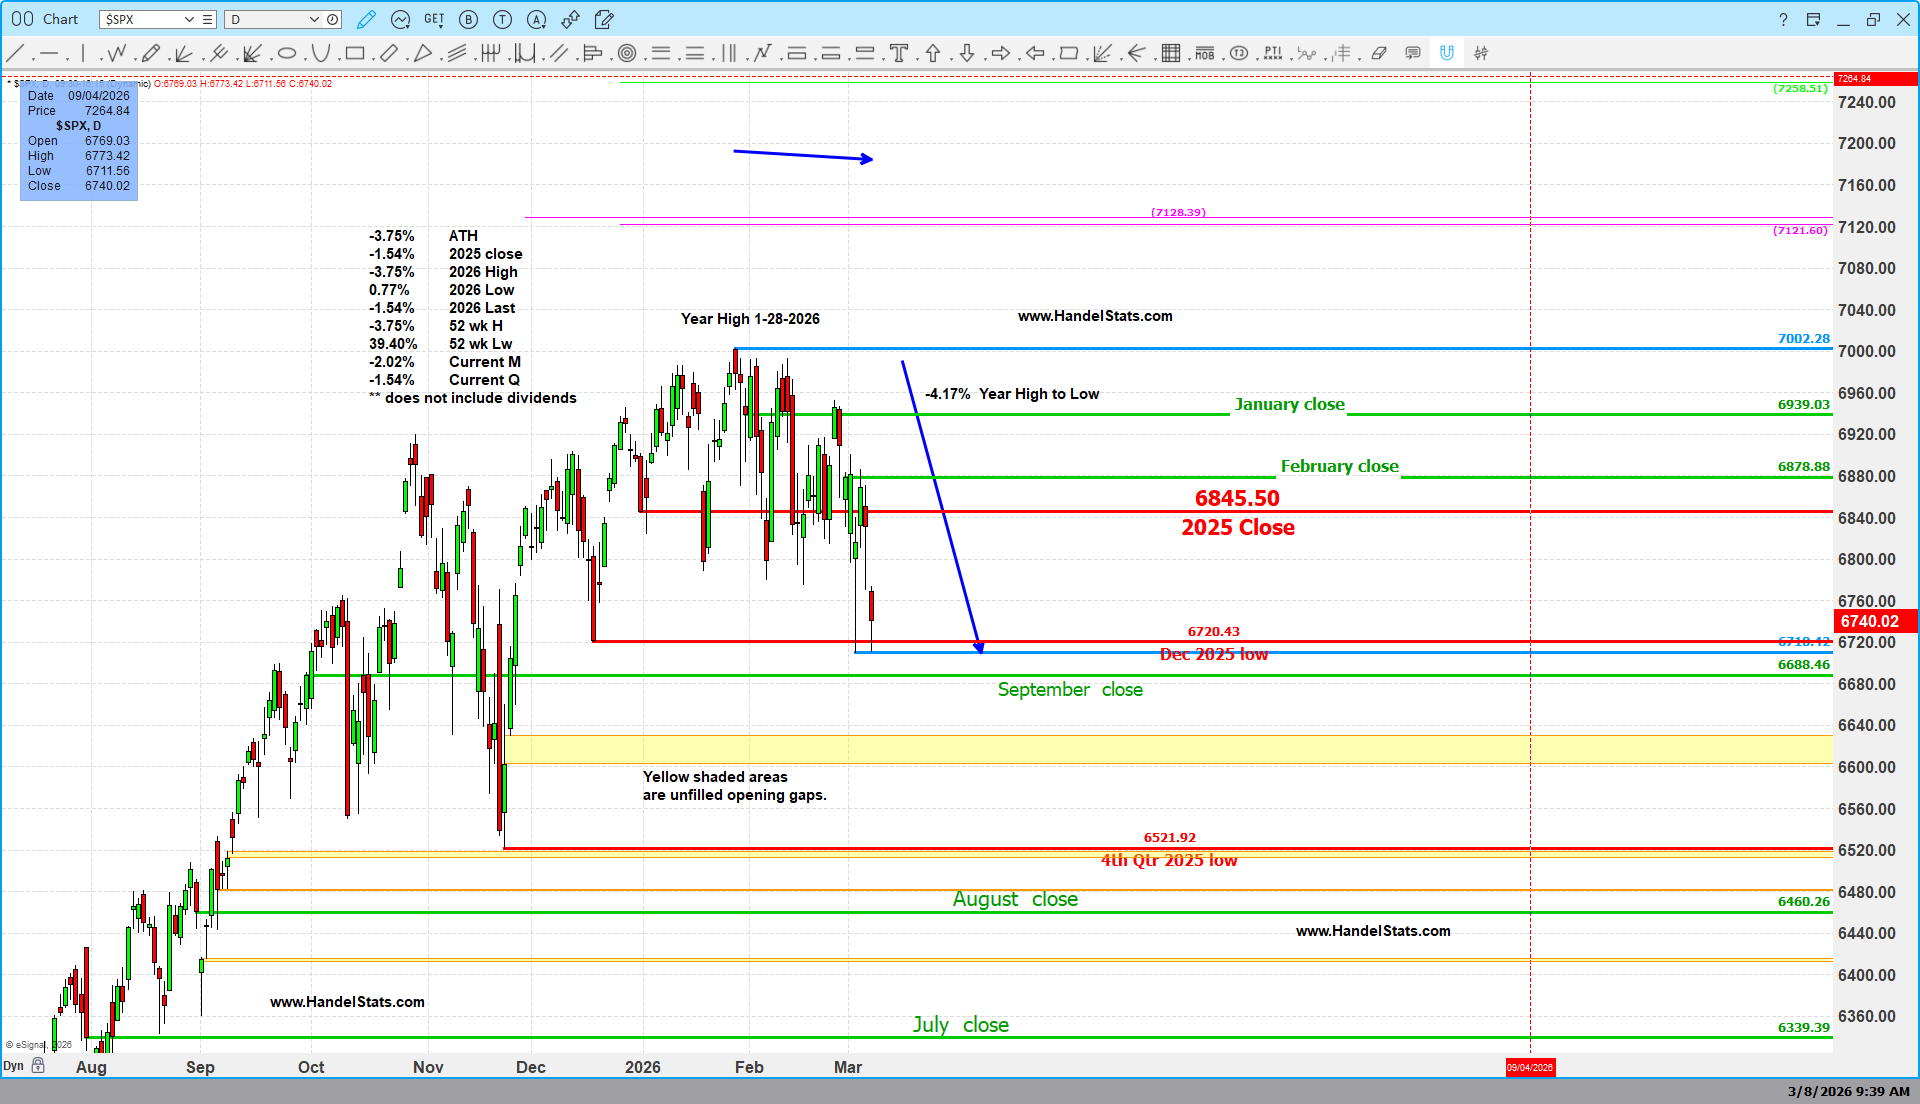
View Year to Date:
The S&P 500 pulled back from its late-January high and is currently trading 4.17% below the 2026 high, testing an important cluster of reference levels on the chart.
Despite the recent decline, the broader trend remains constructive. The index is still:
39.40% above the 52-week low
1.54% below the 2025 closing level
3.75% below both the all-time high and the current 52-week high
Year-to-date performance remains modestly negative, with the market currently:
-2.02% for the month
-1.54% for the quarter
From a structural standpoint, the market is now testing an important support zone near the December 2025 low (6720), while several prior monthly closing levels — including January and February closes — now act as overhead reference levels.
These levels help define the current trading range and provide key reference points as the market digests the early-year pullback.
Note: All returns shown are price returns and do not include dividends.
A Down First Quarter Doesn’t Necessarily Mean a Down Year
When the market starts the year weakly, one question quickly comes up:
Does a down first quarter signal a down year ahead?
History suggests the answer is not necessarily.
Since 1970, the S&P 500 has finished the year higher 42 times and lower 14 times, rising 80.77% of the time. The market’s long-term upward bias is clear, but the path the market takes throughout the year can vary significantly.
One early signal that has historically provided useful context is the performance of the first quarter.
First Quarter Performance vs Full-Year Outcome
First Quarter Result | Years | Year Finished Up | Probability |
|---|---|---|---|
Up Q1 | 35 | 31 | 88.57% |
Down Q1 | 21 | 11 | 52.38% |
When the first quarter finished higher, the S&P 500 went on to finish the year higher 88.57% of the time. A strong start to the year has therefore tended to reinforce the market’s broader upward trend.
When the first quarter finished lower, the outlook became much less certain. In those cases the market finished the year higher only 52.38% of the time, essentially reducing the probability of a positive year to little better than a coin flip.
But the real insight appears when we look more closely at the 21 years in which the first quarter declined.
Down First Quarters Since 1970
Year | Q1 Return |
|---|---|
1980 | -20.38% |
2020 | -19.60% |
2001 | -12.11% |
2009 | -11.67% |
1970 | -11.47% |
2008 | -9.44% |
2022 | -4.95% |
1982 | -5.28% |
1994 | -4.40% |
1977 | -3.09% |
1973 | -3.23% |
2003 | -3.22% |
2005 | -2.61% |
2002 | -2.26% |
1992 | -1.55% |
1993 | -1.47% |
2018 | -1.22% |
2015 | -0.75% |
2016 | -0.18% |
2024 | -0.13% |
2025 | -4.59% |
Down First Quarters That Still Ended in Up Years
Year | Q1 Return |
|---|---|
1980 | -20.38% |
2009 | -11.67% |
1982 | -5.28% |
2003 | -3.22% |
2005 | -2.61% |
1992 | -1.55% |
2018 | -1.22% |
2015 | -0.75% |
2016 | -0.18% |
2024 | -0.13% |
2025 | -4.59% |
Down First Quarters That Led to Down Years
Year | Q1 Return |
|---|---|
2020 | -19.60% |
2001 | -12.11% |
1970 | -11.47% |
2008 | -9.44% |
2022 | -4.95% |
1994 | -4.40% |
1977 | -3.09% |
1973 | -3.23% |
2002 | -2.26% |
1993 | -1.47% |
The Key Insight
Of the 21 down first quarters since 1970:
• 11 still finished with the S&P 500 higher for the year
• 10 finished with the market lower
In other words, more than half of all down first quarters still resulted in an up year.
Perhaps even more interesting is that the magnitude of the decline did not necessarily determine the outcome. The largest first-quarter decline in the entire sample — 1980, down about 20% — ultimately finished with the market higher by year-end.
This highlights an important point: while a weak first quarter clearly reduces the probability of a positive year, it does not determine the final outcome. Markets often recover over the remaining three quarters.
Looking Ahead
Statistics like these provide a useful historical framework, but markets rarely move in straight lines. The deeper insights often come from understanding how these historical tendencies interact with current market conditions as the year unfolds.
In the HandelStats room, we will be digging deeper into these and other insights as they manifest themselves throughout the year.
MiM
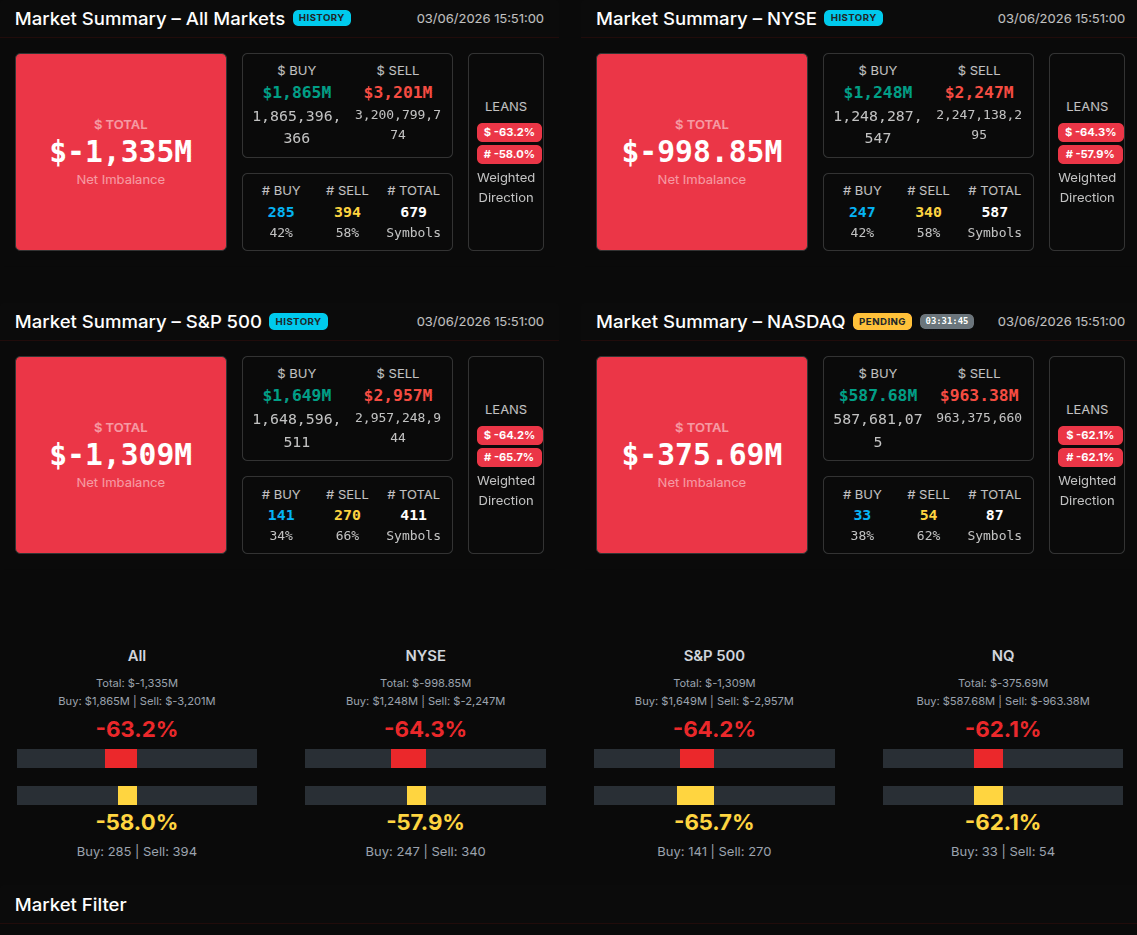
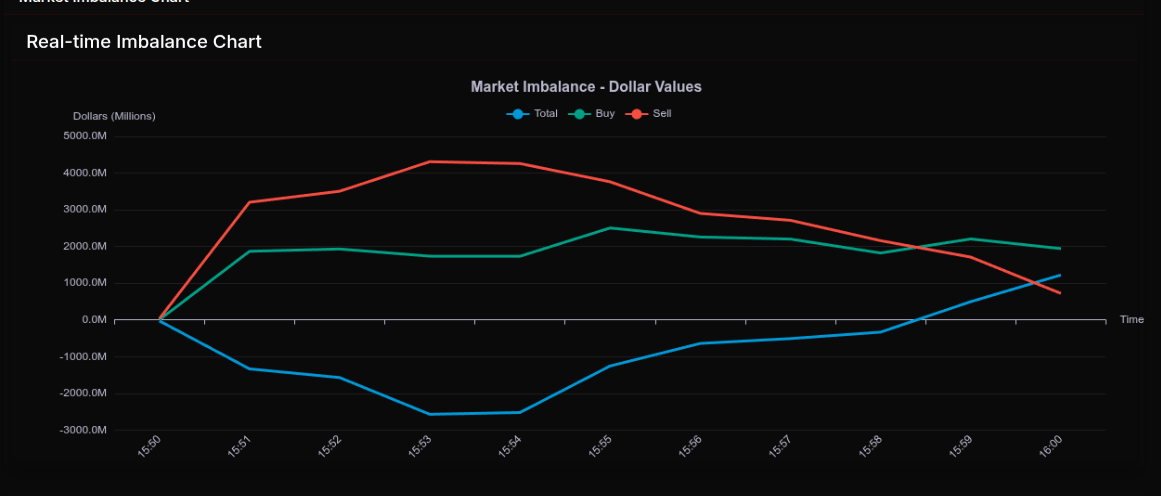
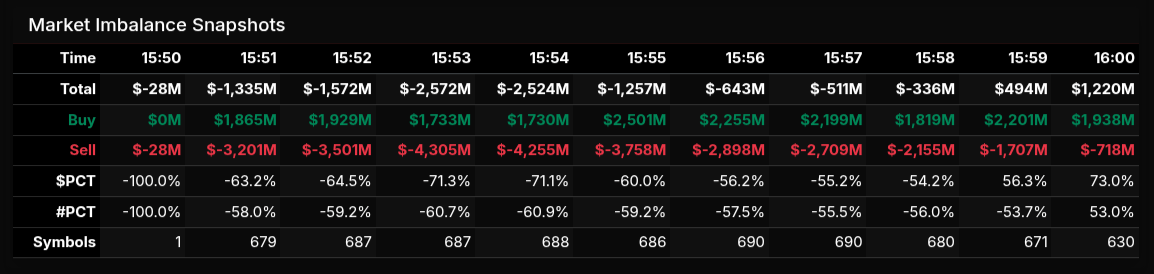
The MOC opened with clear sell-side pressure and quickly turned into a broad institutional liquidation phase before staging a sharp reversal into the bell. By 15:51, the all-market imbalance was already running at -$1.335 billion, with $1.865 billion to buy against $3.201 billion to sell. NYSE sat at -$998.85 million, the S&P 500 at -$1.309 billion, and Nasdaq at -$375.69 million, showing that the weakness was broad from the start rather than isolated to one venue. Early lean readings around -63% to -64% signaled firm selling, but not yet an extreme one-way tape.
That changed between 15:53 and 15:54, when the total imbalance deepened to roughly -$2.57 billion and -$2.52 billion, while the dollar lean hit -71.3% and -71.1%. By our framework, that was wholesale sell pressure. From there, the market steadily repaired. The imbalance improved to -$1.257 billion at 15:55, then to -$643 million, -$511 million, and -$336 million over the next three minutes. At 15:59 the tape flipped to a $494 million buy imbalance, and the final 16:00 print closed at +$1.220 billion with a +73.0% dollar lean, a wholesale buy finish after a heavily offered opening.
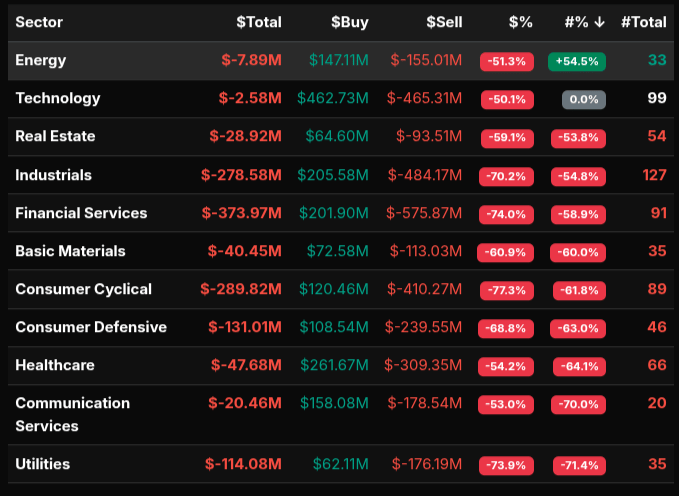
Sector flow was overwhelmingly defensive to negative on the sell side. Consumer Cyclical (-77.3%), Financial Services (-74.0%), Utilities (-73.9%), Industrials (-70.2%), and Consumer Defensive (-68.8%) were the clearest wholesale sells. Technology (-50.1%) and Energy (-51.3%) were far more rotational, while Communication Services (-53.0%) and Healthcare (-54.2%) also leaned sell without reaching extreme levels.
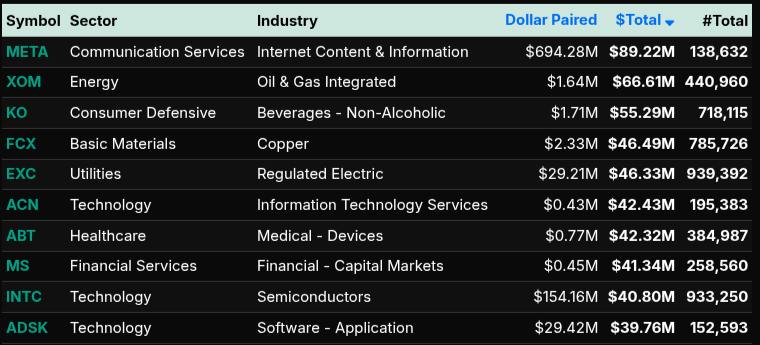
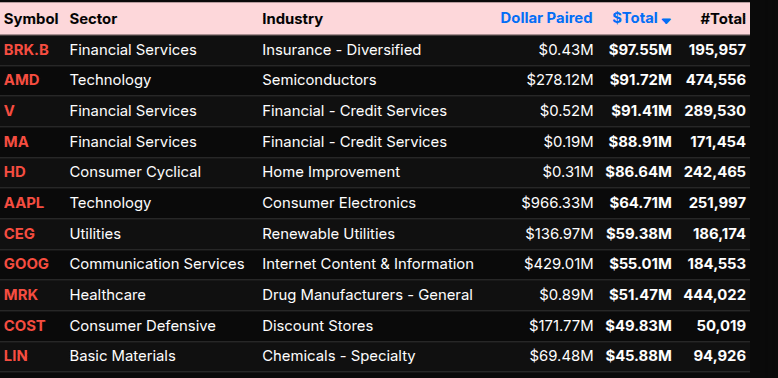
On the symbol level, the biggest sells included BRK.B, AMD, V, MA, HD, AAPL, CEG, GOOG, MRK, COST, and LIN. The strongest buy-side names were META, XOM, KO, FCX, EXC, ACN, ABT, MS, INTC, and ADSK. Taken together, the session showed broad early distribution, followed by aggressive late buy-side cleanup into the close.
Technical Edge
Fair Values for March 9, 2026
SP: 5.25
NQ: 27
Dow: 32.04
Daily Breadth Data 📊
For Friday, March 6, 2026
• NYSE Breadth: 28% Upside Volume
• Nasdaq Breadth: 37% Upside Volume
• Total Breadth: 34% Upside Volume
• NYSE Advance/Decline: 22% Advance
• Nasdaq Advance/Decline: 29% Advance
• Total Advance/Decline: 27% Advance
• NYSE New Highs/New Lows: 58 / 64
• Nasdaq New Highs/New Lows: 72 / 206
• NYSE TRIN: 0.71
• Nasdaq TRIN: 0.71
Weekly Breadth Data 📈
For Week Ending March 6, 2026
• NYSE Breadth: 39% Upside Volume
• Nasdaq Breadth: 54% Upside Volume
• Total Breadth: 48% Upside Volume
• NYSE Advance/Decline: 26% Advance
• Nasdaq Advance/Decline: 32% Advance
• Total Advance/Decline: 30% Advance
• NYSE New Highs/New Lows: 320 / 160
• Nasdaq New Highs/New Lows: 318 / 550
• NYSE TRIN: 0.54
• Nasdaq TRIN: 0.39
BTS Levels - (Premium Only)
Calendars
Today’s Economic Calendar
This Week’s Important Economic Events
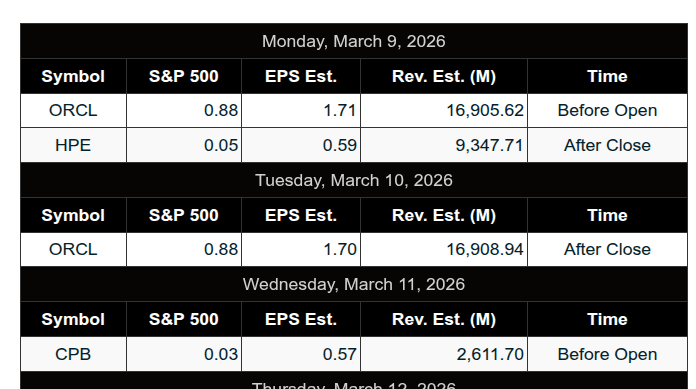
Upcoming Earnings - SP500
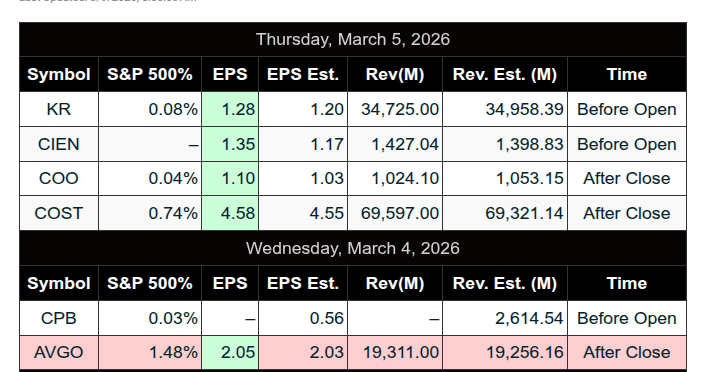
Recent Earnings
Room Summaries:
Polaris Trading Group Summary - Friday, March 6, 2026
The trading day began with significant macro news that set the tone for volatility. February payrolls came in at -92K vs +55K expected, a massive miss described as a six-sigma deviation from estimates. This immediately increased expectations for potential Fed rate cuts in 2026, contributing to sharp early market movement. David noted that both upside and downside targets from the prior evening’s Daily Trade Strategy had already been fulfilled, highlighting how quickly price expanded on the news.
Morning Session
Early trading reflected heavy selling pressure, with David describing sellers as “peppering the bids.” The market moved quickly lower in what some members described as an “elevator down” move, with expectations that a squeeze could eventually follow once the selling exhausted.
Key technical areas included:
CD2 violation levels
DLMB zone
Important gamma levels on ES and NQ
David emphasized that it was “Capital Preservation FRYday,” reinforcing the idea that Fridays often require tighter risk control and selective trading.
Notable Trades
The highlight trade of the day came from Crude Oil:
Crude Open Range Long
Hit two profit targets
Remaining position stopped out via trailing stop
David described the trade as “Very nice.”
Later in the afternoon, crude continued its strength with news that oil surged to $92, the highest since 2023, validating the earlier bullish trade bias.
Member Trade & Lesson
Peter shared a successful trade reclaiming a key level (around 6782). The trade reached its first target with multiple contracts before partial stop-outs.
A key lesson he emphasized:
Take the majority of profits at the first level and avoid letting a winning trade turn from green to red.
This reinforced a core PTG principle: locking in gains and managing position size around key levels.
Midday & Afternoon
The midday session slowed into consolidation around the VWAP midpoint, with the market rotating rather than trending strongly. David pointed out that reclaiming 6750 would put bulls back in command, highlighting an important level for directional control.
Later in the session:
Markets showed risk-off selling into the weekend
A $700M MOC sell imbalance appeared near the close, confirming the defensive tone heading into the weekend.
Key Takeaways from the Day
Major macro surprise (payroll miss) created early volatility.
Capital preservation mindset was emphasized due to Friday conditions.
Crude Oil Open Range Long was the standout trade, hitting multiple targets.
Profit-taking discipline was reinforced—take gains at first targets rather than risking a reversal.
Afternoon action shifted to VWAP rotation and risk-off positioning ahead of the weekend.
Overall, the day demonstrated the value of pre-planned levels from the DTS, disciplined profit-taking, and cautious Friday risk management.
DTG Room Preview – Monday, March 9, 2026
Geopolitics driving markets: Escalating Middle East conflict is the primary focus, pushing oil close to $120/barrel (highest since 2022) as the Strait of Hormuz remains closed and multiple countries reduce production.
Supply disruption concerns: Kuwait and the UAE are cutting output, Iraq reportedly reduced production ~70%, and Iran continues targeting regional energy infrastructure. The G7 and IEA are discussing a potential coordinated oil reserve release, which has temporarily eased some fears.
Risk-off sentiment: More than $6T in global market value has been erased since the US/Israel attacks on Iran. VIX > 30, showing elevated volatility and strong risk-off positioning.
US equities weak: Futures are lower following last week’s declines (Dow -3%, S&P 500 -2%, Nasdaq -1%).
Economic/Earnings calendar:
No major economic data today
After the close: HPE, CASY
Tuesday morning: NIO, KEP
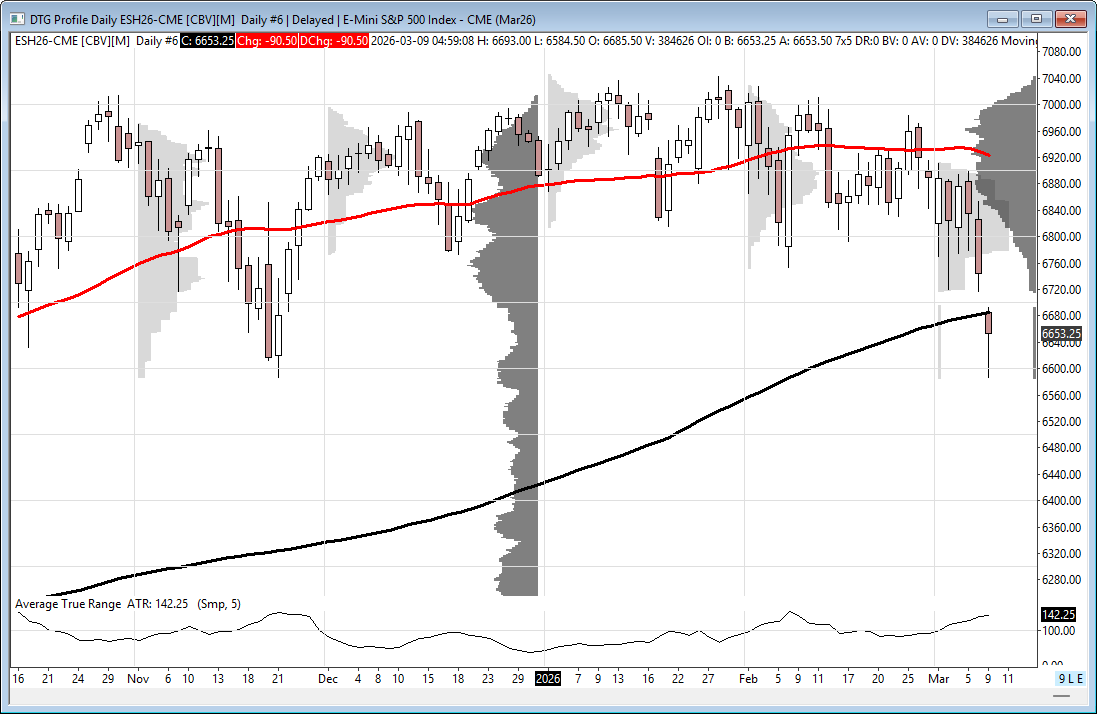
Volatility elevated: ES 5-day average range has expanded to 139 points as price continues consolidating below all-time highs.
Positioning: Large trader (“whale”) flow overnight shows a slightly bearish bias into the US session.
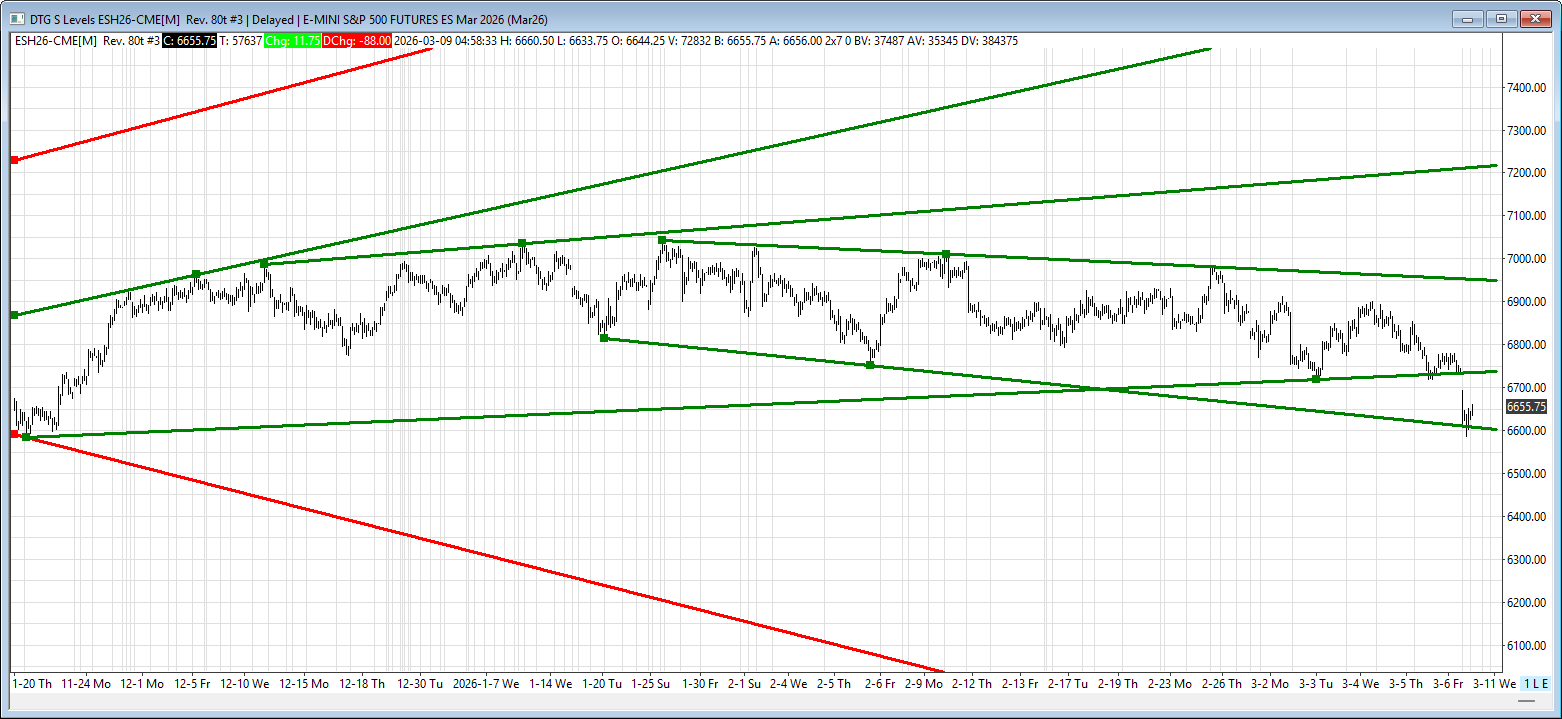
Key ES levels:
Resistance: 6737–6742 (trendline), 6944–6949
Major resistance: 200-day MA near 6685
Support: 6605–6600 (short-term channel)
Technical note: A close below the 200-day MA would be bearish for longer-term players, while the 6605–6600 area remains key near-term support.