- The Opening Print
- Posts
- No Data, Plenty of Drama: Fed Minutes + Santa Rally on the Ropes
No Data, Plenty of Drama: Fed Minutes + Santa Rally on the Ropes
Danny Riley
December 30, 2025
Follow @MrTopStep on Twitter and please share if you find our work valuable!
Our View
Yesterday @HandelStats did a post on silver and gold that he titled "Market Bubble," and the CME increased margin requirements on gold, silver, and palladium due to recent volatility. Silver had its largest one-day decline since February 2021, falling 8.7%.
While I was on the trading floor, I saw a lot of margin increases. One that stuck out was during the Gulf Wars, when oil volatility increased. I cannot tell you how many times I heard desk customers asking how the CME decides to raise margins. Back then, the primary focus was on the SPAN system, which gave clearing firms reports of their firm risk and individual account risk, but today it's much larger than that.
Today, CME Group utilizes a sophisticated suite of risk management tools to determine margin increases, primarily anchored by the SPAN and SPAN 2 frameworks, which calculate potential portfolio losses under various market scenarios. These methodologies are supported by the CME CORE (Clearing Online Risk Engine), an interactive web-based calculator for analyzing margin requirements, and Historical Value at Risk (HVaR) models that employ volatility forecasts for products like interest rate swaps.
To ensure seamless integration for clearing members, CME provides a Margin Services API and deployable software, all while the Risk Management Department incorporates qualitative expert analysis of macroeconomic conditions and implied volatilities to calibrate models against market shifts.
That said, one thing has not changed: most of the risk comes from futures contracts due to the high leverage and the potential for unlimited losses, and from option premium sellers, who can face substantial or unlimited losses, similar to a futures trader's risk profile.
A good example of how the SPAN system has improved was when the PitBull had over 30k big S&P options on, and how he could skirt the system by buying back cheap short call premiums that would kick off margin calls for short calls he sold for .5 cents, or buying puts that had unlimited risk. When we did a spreadsheet of the positions using a 2%, 5%, 10%, or 15% move, it showed his risks, with the latter risk being over $350 to $400 million.
Today, the exchange has tools that will alert the clearing firm of the increased risk and make the firm either cut the position or force it to liquidate.
My question: how many silver shorts were there established over the last 20 years?
Think about that!
Our View
There are no economic reports today, but we will get a look at the Federal Reserve’s December meeting that should shed insight into policymakers' disagreements and how those may affect rates next year. This is another wild card in the Santa Claus rally.
Below is a @Barcharts tweet they put out yesterday:
S&P 500 on track for its 3rd consecutive year with no Santa Rally 🚨
This would be the first time in history that has happened 😱👀

Our Lean — Danny’s Trade (Premium only)

Market Recap
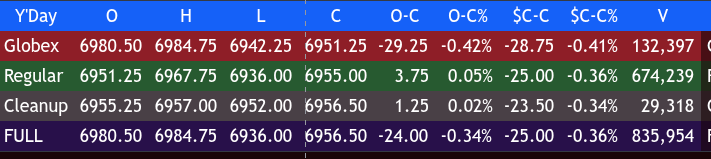
The ES traded down to 6942.50 at 9:15 AM and opened Monday’s regular session at 6951.25. After the open, the ES traded 6947.50, rallied up to 6967.75, then sold off down to 6943.50 at 10:10. It rallied to a lower high at 6959.75 at 10:30, then pulled back to 6944.25 at 10:50.
From there, it chopped in a small 5- to 7-point back-and-fill range until 11:40, then dropped down to 6936.25 at 12:25. It slowly rallied up to 6954.75 at 1:35, pulled back to 6944.25 at 2:10, rallied again to 6962.50 at 3:15, and then pulled back to 6955.00 at 3:44.
The ES traded 6956.75 as the 3:50 cash imbalance showed $851 million to buy, then pulled back to the 6952.25 level at 3:57, and traded 6955.00 on the 4:00 cash close. After 4:00, the ES chopped in a narrow range and settled at 6955.00, down 24.25 points or -0.35%.
The NQ settled at 25,739.75, down 123.50 points or -0.48% on the day, with both the ES and NQ down for two days in a row.
In the end, the weak seasonalities prevailed in the early part of the day, but the buyers showed back up after 2:00. In terms of the ES’s overall tone, it acted better than the NQ. In terms of the ES’s overall trade, volume was low at 836k contracts traded
MiM
Market-on-Close Recap – MiM
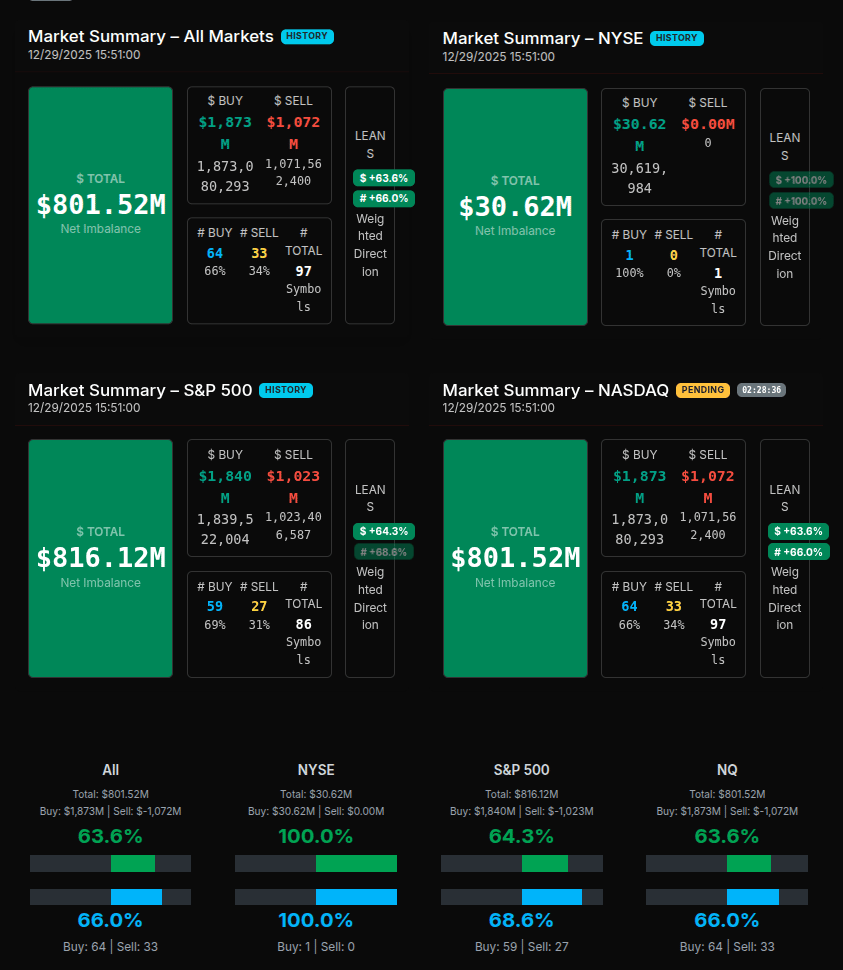
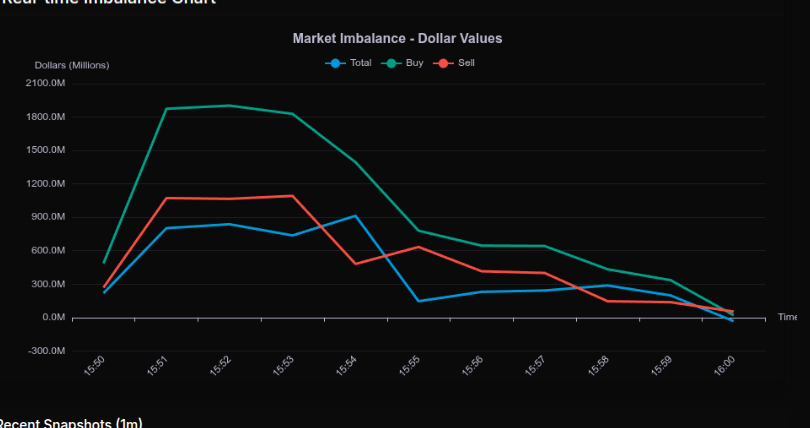
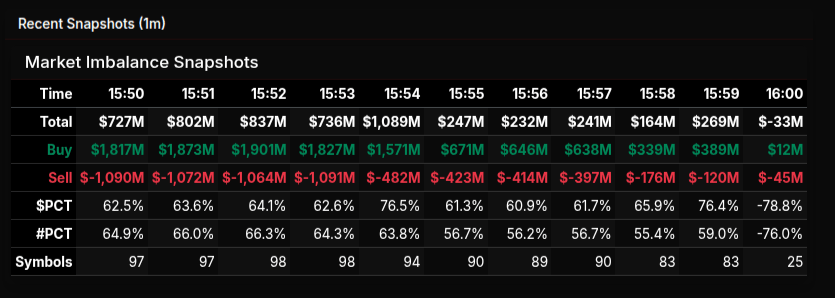
The Market-on-Close session reflected NASDAQ-only data, as the NYSE MOC feed was unavailable due to an outage, removing NYSE-listed stocks from the imbalance calculations. As a result, all flows, sector totals, and symbol activity referenced were derived exclusively from NASDAQ constituents.
Within that constraint, the auction opened with a clear buy-side imbalance. From roughly 15:50 to 15:54, net imbalances expanded quickly, peaking just above $1.0B as buy programs dominated. Buy participation held above 60% on both a dollar-weighted and symbol-count basis, signaling institutional involvement rather than isolated closing prints.
After 15:55, the auction shifted from expansion to compression. Total imbalance declined steadily as sell interest appeared, but the character remained rotational. Many symbols moved toward the ±50% lean zone, consistent with internal balancing rather than liquidation. A brief sell-side print in the final minute reflected typical NASDAQ closing mechanics and did not negate the broader buy structure.
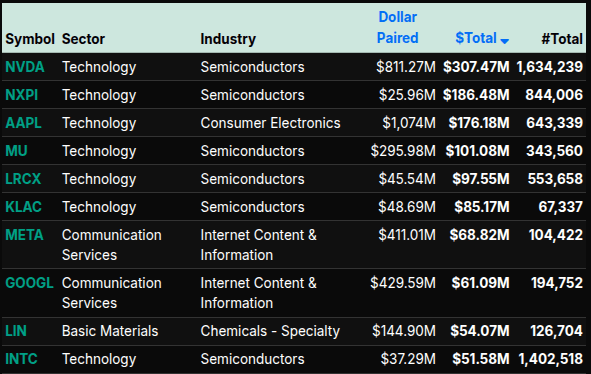
Sector activity, limited to NASDAQ names, was led by Technology with more than $429M in total flow and a +60% lean. Communication Services followed near $246M with a high-90s buy skew, driven by large-cap internet platforms. Consumer Defensive, Energy, and Basic Materials posted clean +100% buy leans, while Industrials and Healthcare were the primary sell-side offsets, both registering leans below -50%.
At the symbol level, semiconductors dominated. NVDA, AVGO, TXN, MU, and NXPI carried a disproportionate share of the dollar-weighted imbalance, several exceeding the +66% threshold that marks wholesale institutional buying. Overall, despite the NYSE outage, the NASDAQ MOC resolved as a buy-dominant auction with late-stage balancing, suggesting intentional positioning into the close rather than forced rebalancing.


Technical Edge
Fair Values for December 30, 2025:
SP: 46.6
NQ: 200.62
Dow: 266.7
Daily Market Recap 📊
For Monday, December 29, 2025
NYSE Breadth: 41% Upside Volume
Nasdaq Breadth: 41% Upside Volume
Total Breadth: 41% Upside Volume
NYSE Advance/Decline: 37% Advance
Nasdaq Advance/Decline: 30% Advance
Total Advance/Decline: 33% Advance
NYSE New Highs/New Lows: 41 / 27
Nasdaq New Highs/New Lows: 69 / 292
NYSE TRIN: 0.87
Nasdaq TRIN: 0.61
Weekly Breadth Data 📈
For Week Ending Friday, December 26, 2025
NYSE Breadth: 58% Upside Volume
Nasdaq Breadth: 50% Upside Volume
Total Breadth: 53% Upside Volume
NYSE Advance/Decline: 59% Advance
Nasdaq Advance/Decline: 52% Advance
Total Advance/Decline: 55% Advance
NYSE New Highs/New Lows: 232 / 82
Nasdaq New Highs/New Lows: 350 / 413
NYSE TRIN: 1.00
Nasdaq TRIN: 1.05
ES & NQ Levels (Premium only)
Calendars
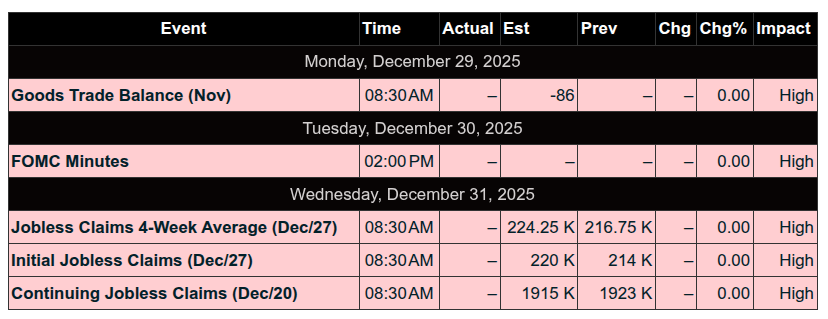
Economic Calendar
Today

Important Upcoming
Earnings
NONE
Recent
NONE
Trading Room Summaries
Polaris Trading Group Summary - Monday, December 29, 2025
Monday brought a low-volatility, post-holiday session where the best trading opportunities emerged early in the day. After initial downside targets were met, the market settled into a typical Cycle Day 2 pattern with limited movement and a choppy tone.
Key Trade Highlights
Early Target Fulfillment:
The market quickly reached the 6950 ES / 6900 SPX level outlined in the Daily Trade Strategy (DTS). This move aligned with Dynamic DLMB levels and provided clean, actionable setups for prepared traders.On the Nasdaq, all lower NQ targets were not only fulfilled but exceeded, confirming the bearish lean right out of the gate.
"Bear Lean P / Whopper" Setup:
Around 10:00 AM, David called out a strong bear lean setup dubbed the “Whopper.” It was validated by several members in the room and described as “slick” — signaling it had good follow-through for those who participated.
Market Behavior & Lessons
Cycle Day 2 Characteristics:
After the early drop, the session transitioned into choppy, two-sided oscillations, typical of a Cycle Day 2. David emphasized that it was a “normal, low-volatility” session, and noted that opportunities were limited as the day progressed.Post-Holiday Lull:
David humorously referenced a “post-Xmas hangover”, adding that perhaps the Santa Rally had paused to refuel the reindeer. While seasonal optimism lingered, price action remained muted throughout most of the session.Options Activity:
In the afternoon, David noted a steady increase in call buying, suggesting positioning may have been quietly shifting — something to watch heading into year-end.
Afternoon Observations
The afternoon session continued to drift lower, with sellers maintaining control into the lunch hour.
Heat maps from MAGS7 and SPDRs confirmed a lack of broad sector strength.
The MOC buy imbalance came in at $851M, which David called “mice nutz” — another nod to the day’s lackluster tone.
Takeaways
Preparation Paid Off:
The early moves to DTS targets offered the day’s best trades. Those who followed the premarket plan were rewarded.Know When to Step Back:
As volatility dried up, the room stayed focused but didn’t force trades. David's commentary helped manage expectations and reinforce trading discipline.
Summary:
December 29th played out as a textbook low-volatility Cycle Day 2, with strong early follow-through to downside targets, followed by narrowing ranges and fewer opportunities. Traders who acted early and respected the environment likely had the best outcomes.
Discovery Trading Group Room Preview – December 30, 2025
Market Overview:
S&P 500 slipped 0.3% Monday; Santa Claus rally in doubt for third year.
Precious metals reversed sharply:
Gold: -4% Monday, +1% overnight
Silver: -7% Monday, +5% overnight
Volatility remains low in holiday trade; potential spike expected post-FOMC minutes.
Economic Highlights:
Pending Home Sales (Nov): Biggest jump since early 2023, signaling housing strength.
Today’s Key Data:
9:00am ET: HPI, S&P/CS Composite-20 HPI
9:45am ET: Chicago PMI
2:00pm ET: FOMC Meeting Minutes (main event)
FedWatch: ~80% odds of no rate change in January.
Trump suggests he may fire Fed Chair Powell, timing TBD.
Energy Update:
Venezuela cuts oil output by 25% (500,000 bpd) amid U.S. blockade.
Storage maxed out; biggest buyer is China.
Trump using sanctions to pressure President Maduro on cartel activity.
Corporate Earnings:
No significant earnings scheduled this week.
Technicals – ES (S&P Futures):
Resistance: 7085/90s, 7504/09s
Support: 6828/33s, 6670/65s, 6332/27s
50-day MA: 6876
ES remains within its short-term uptrend channel; bulls and bears have room to operate.
Flow & Sentiment:
Whale bias: Bearish into U.S. open
Overnight: Heavier than expected large trader volume
Stay sharp — the FOMC minutes could shake up the tape this afternoon.

