- The Opening Print
- Posts
- No Bids Into the Weekend — Who’s Got the Guts to Hold Risk Here?
No Bids Into the Weekend — Who’s Got the Guts to Hold Risk Here?
Danny Riley
March 27, 2026
Follow @MrTopStep on Twitter and please share if you find our work valuable!
Our View
There is a very basic pattern here: when crude goes up, the stock market and gold go down, which was exactly the case yesterday. Trump’s comments about the war being over are just that—noise. Iran is unlikely to agree to U.S. conditions to end the conflict and appears willing to escalate.
So far, no major Arab nations in the Middle East are actively backing the U.S. militarily, and Iran has pushed the U.S. out of several Gulf positions. My question to you is simple: if you were Iran, would you negotiate with Trump?
Our Lean
Sometimes it’s OK not to trade, and sometimes it’s best to sit on the sidelines. I could be 100% wrong, but I still think the markets are going lower, gold will continue to struggle, and oil will remain bid.
There are two trading days left in March—today is Week 4 options expiration, and Monday is the last trading day of the quarter, along with the JPM collar (JPM put).
Our lean: As I’ve said, Trump doesn’t like falling markets. Since the Middle East conflict began, he has posted over 130 times on Truth Social, effectively narrating events in Iran with a mix of threats and diplomacy. Say what you want, but silence isn’t his approach.
I can’t rule out a rally, but it feels like the market is heading lower—every rally, every dead cat bounce, has failed. I’m leaning toward NLOTC (new lows on the close). Who wants to go home long over the weekend?
You can buy early weakness and sell the dead cats, or stay patient and sell into squeezes.
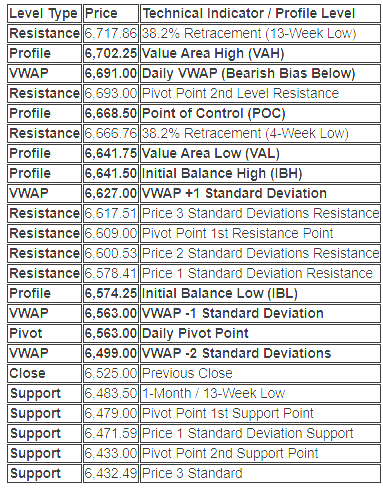
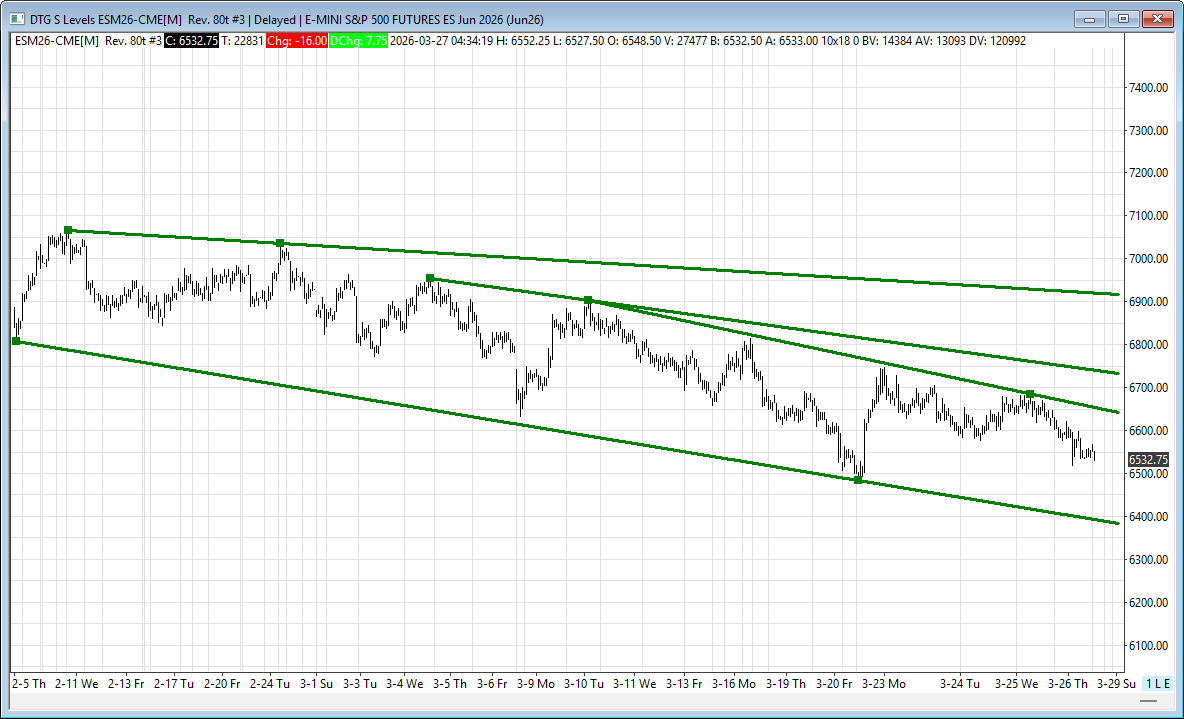
For the current March 26 session, the Initial Balance (IB)—representing the high and low of the first hour of trade—is established between 6641.50 and 6574.25.
Comprehensive Market Profile & Technical Map
Market Profile Commentary
Balance vs. Extension: The market established an Initial Balance (IB) range of 67.25 points. Price action below 6,574.25 (IBL) would indicate a "Range Extension" to the downside, confirming a trend day lower.
VWAP Sentiment: Trading below the Daily VWAP (6,691.00) maintains a bearish intraday bias. The confluence of the Daily Pivot and VWAP -1SD at 6,563.00 acts as a critical "gravity" point for mean reversion if the current selling exhausts.
Confluence Alert: Notice the tight cluster at the top of the value area—VAL (6,641.75) and IBH (6,641.50) are nearly identical, making this a heavy "Shelf" of resistance on any rally.
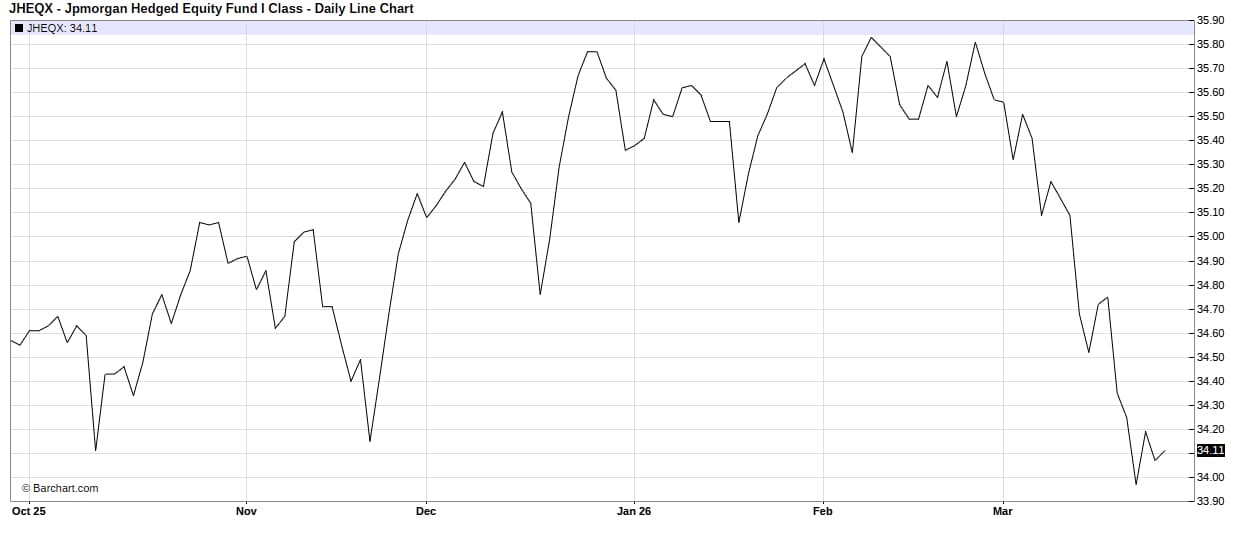
The final trading day (usually March 31 or the last business day) tends to show a small positive bias—often part of "quarter-end" and "month-end" window dressing, rebalancing, and portfolio adjustments, but it's also the JP Morgan put end-of-quarter roll (also known as the JPM Collar Roll), which refers to the mechanical quarterly reset of a large options collar strategy used by the JPMorgan Hedged Equity Fund (JHEQX) and related institutional vehicles.
What the strategy is
JHEQX is a large (~$12–15 billion range historically) fund that holds a basket of S&P 500 stocks while using an options collar to hedge downside risk at a relatively low net cost. The collar typically works like this each quarter:
Long put (around 5% out-of-the-money) → Provides protection if the market drops moderately.
Short lower put (around 15–20% out-of-the-money) → A put spread that reduces the cost of the hedge.
Short call (around 3–5% out-of-the-money) → The premium from selling the call helps pay for (or fully offsets) the cost of the put protection.
This structure caps upside in strong rallies but limits losses in moderate declines, while the fund still participates in most normal equity upside.
The "end-of-quarter roll"
Every quarter, on or near the last trading day of the quarter (this quarter: Monday, March 31, 2026), the fund lets the expiring options (March 2026 expiry) roll off and establishes a new collar for the next quarter (June 2026 expiry).
What actually happens during the roll:
They close out (or let expire) the old short calls, long puts, and short lower puts.
They initiate a fresh set of options at new strikes based on the current S&P 500 level.
For Q1 2026 (just rolled recently), the new strikes were approximately:
Short call at 7155
Long put at 6475 (roughly 5% OTM at the time)
Short put at 5470 (the lower leg of the put spread)
This involves tens of thousands of contracts per strike (often 30,000–35,000+ per leg), representing billions in notional exposure.
Market impact ("the invisible hand")
Because of the size, dealers and market makers who take the other side of these trades must hedge their own gamma and vega exposure. This creates predictable flows:
Near expiry/roll day → Often increased volatility or "pinning" action around key strikes as gamma expires or flips.
When rolling → Large selling of volatility (the fund is effectively a net seller of options in the structure), which can suppress implied vol temporarily.
The new strikes become important technical levels for the next 90 days—many traders watch the long put strike (~6475 this quarter) as potential support and the short call as resistance.
The roll is often discussed in trading communities because it’s one of the largest known recurring institutional options flows on the S&P 500. It doesn’t “control” the market, but it can amplify moves or create chop around quarter-end.
Current context (March 26, 2026)
The March 31 roll is coming up in just a few trading days. With the S&P 500 sitting in the mid-6400s–6500s amid oil volatility and geopolitical noise, the new collar strikes (especially the 6475 long put) are already being watched closely.
Here’s a clear, step-by-step explanation of how the JPM put end-of-quarter roll (the JPM collar roll for the JHEQX Hedged Equity Fund) actually works.
1. What the Collar Strategy Is
JHEQX holds a large basket of U.S. large-cap stocks (designed to behave similarly to the S&P 500). To reduce downside risk while keeping the cost low, the fund overlays a zero-cost (or near zero-cost) put-spread collar on the S&P 500 index options.
Typical structure each quarter:
Buy a put option ≈ 5% out-of-the-money (OTM) → This provides the main downside protection if the market drops moderately.
Sell a lower put option ≈ 20% OTM → This finances part of the cost of the long put (creating a put spread).
Sell a call option ≈ 3–5% OTM → The premium collected from selling this call pays for the remaining cost of the put spread, making the whole package roughly zero-cost.
Result: The fund participates in most normal upside moves but gives up some upside above the short call strike. It gets protection between roughly -5% and -20% drawdowns. Below -20%, protection drops off.
2. The Quarterly Roll Process
The roll happens mechanically every quarter on or very near the last business day of the quarter (this quarter: Monday, March 31, 2026).
Here’s exactly what occurs:
Step A: Old collar expires or is closed
The current quarter’s options (e.g., March 2026 expiry) reach expiration or are unwound. This removes the old short call, long put, and short lower put.
Step B: New collar is established
The fund simultaneously:
Sells a new call struck ~3–5% above the current S&P 500 level (for June 2026 expiry).
Buys a new put struck ~5% below the current S&P 500 level.
Sells a new lower put struck ~20% below the current S&P 500 level.
The strikes are chosen so the net premium is close to zero (the short call funds the put spread).
Size: This involves tens of thousands of contracts per leg (recent quarters have seen ~34,000–45,000 contracts per strike). That’s billions of dollars in notional exposure.
For the current Q1 2026 collar (which was rolled at the end of December 2025), the strikes were approximately:
Short call: 7155
Long put (protection): 6475 (~5% OTM at the time)
Short put: 5470 (~20% OTM)
On March 31, they will let those expire and roll into a new June 2026 collar based on where the S&P 500 is trading that day.
3. Why the Roll Can Move the Market
Because the position is so large, market makers and dealers on the other side of these trades have to hedge their own exposure (gamma, delta, vega). This creates predictable flows:
As the old options approach expiry, there can be pinning or chop around key strikes.
During/after the roll, the fund is effectively a net seller of volatility (selling more calls and lower puts while buying the protection put).
Dealers re-hedge by buying or selling futures/index, which can amplify moves or create temporary support/resistance at the new strikes.
The new long-put strike (the ~5% OTM level) often becomes watched as potential support for the next 90 days.
The actual roll execution can happen at or after the close on March 31 to minimize market impact, but the anticipation and gamma unwind often affect trading in the final days of the quarter.
Bottom Line for Traders
The roll is mechanical and predictable—it happens the same way every quarter.
It doesn’t “control” the market, but its size makes it one of the biggest recurring institutional options flows on SPX.
Many traders watch the new long-put strike as a technical level and monitor volatility changes around the roll date.
Join us FREE in the PIT daily - Signup Here

Guest Posts:
 |
Get instant access to our partners’ real-time market data and insights not available anywhere else. Here is last night's Founder’s note getting you ready for today’s market and explaining the constraints in yesterday’s market. - MrTopStep
Futures are down 50bps, indicating an SPX open near 6,450. Crude is +2 points to ~97, and the VIX is a few ticks under 30.
TLDR: We are assuming crash positions.
Trump yesterday tweeted about a 10-day hold on US operations, which boosted futures to 6,600 just after yesterday's close, but we now see ES back to 6,500 as the Middle East sees significant conflict ongoing today. The upside situation remains based on an actual deal being made - and if that happens its apparent the equity market will rally 3-5% in very quick fashion. When a deal happens is anyones guess, but the right-tail risk is real. You can position for this "who knows when" upside with OTM call ratios. We flag this upside potential (which at the moment seems low-probability) more because being short this market with hard deltas/long vol could be a widow-maker - just as being long hard deltas could be due to left tail crashing.
Before me move on, we want to talk JPM 6,475 which expires on Tuesday (3/31): assuming things don't materially escalate (i.e. Crude >100) over the weekend, we think the idea of a move back to the JPM 6,475 strike into 3/31 expiration is real, and a legitimate play. Given this, we have some trades on that are "soft pin" plays into this strike for Monday. We say "soft pin" because we are playing for the ~6,475 area (i.e. wide condor/fly), not a 6,475 strike pin (ex: no cute, 5 point wide iron fly).
Now for the downside view...
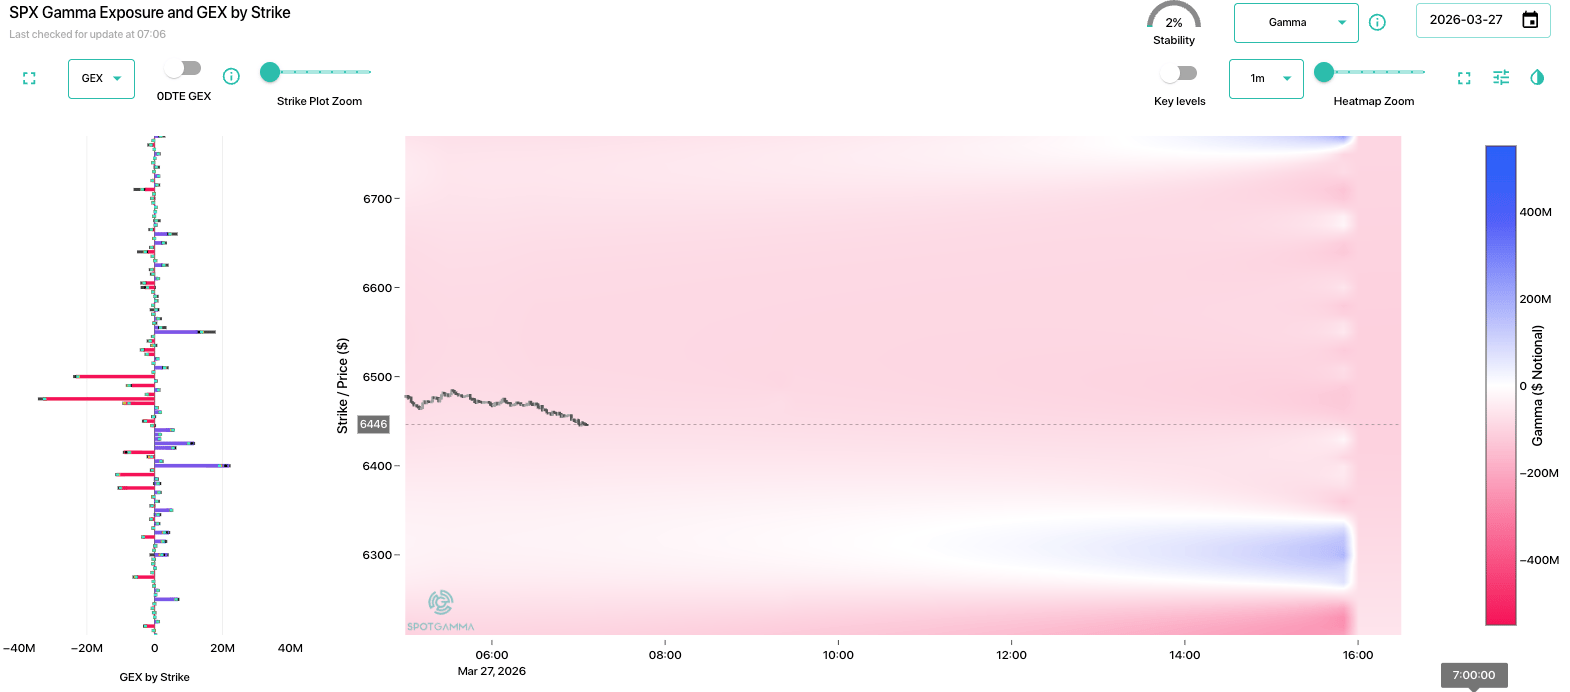
As you can see above in TRACE, its still negative gamma across nearly the entire SPX range, with the exception of a pocket of short 0DTE puts near 6,330. That area near 6,300 is quite frankly the only excuse of support we could make - but its a fairly weak zone given its smaller 0DTE positions (several strikes in the ~7.5k contract range). We cannot imagine why anyone would want to hold short vol risk into the weekend, and so that likely keeps a downside bid into this market.
Let's also again be very clear here: This is the type of stuff major crashes are made of.
We do not state this lightly, but there is a real lack of faith in resolution to a "known unknown" (Iran), and the VIX is about to go >30, which is a signal that convexity is about to enter the market. This past Monday AM wrote about the chain risk-reaction that seemed to have been set in motion, detailing the higher oil->higher rates->higher equity vol (read here), and a pre-market Trump tweet about pausing operations ripped futures +3%. The somewhat scary thing here is that the market is seemingly no longer believing these tweets, as the half life of equity-bounces related to them is dropping.
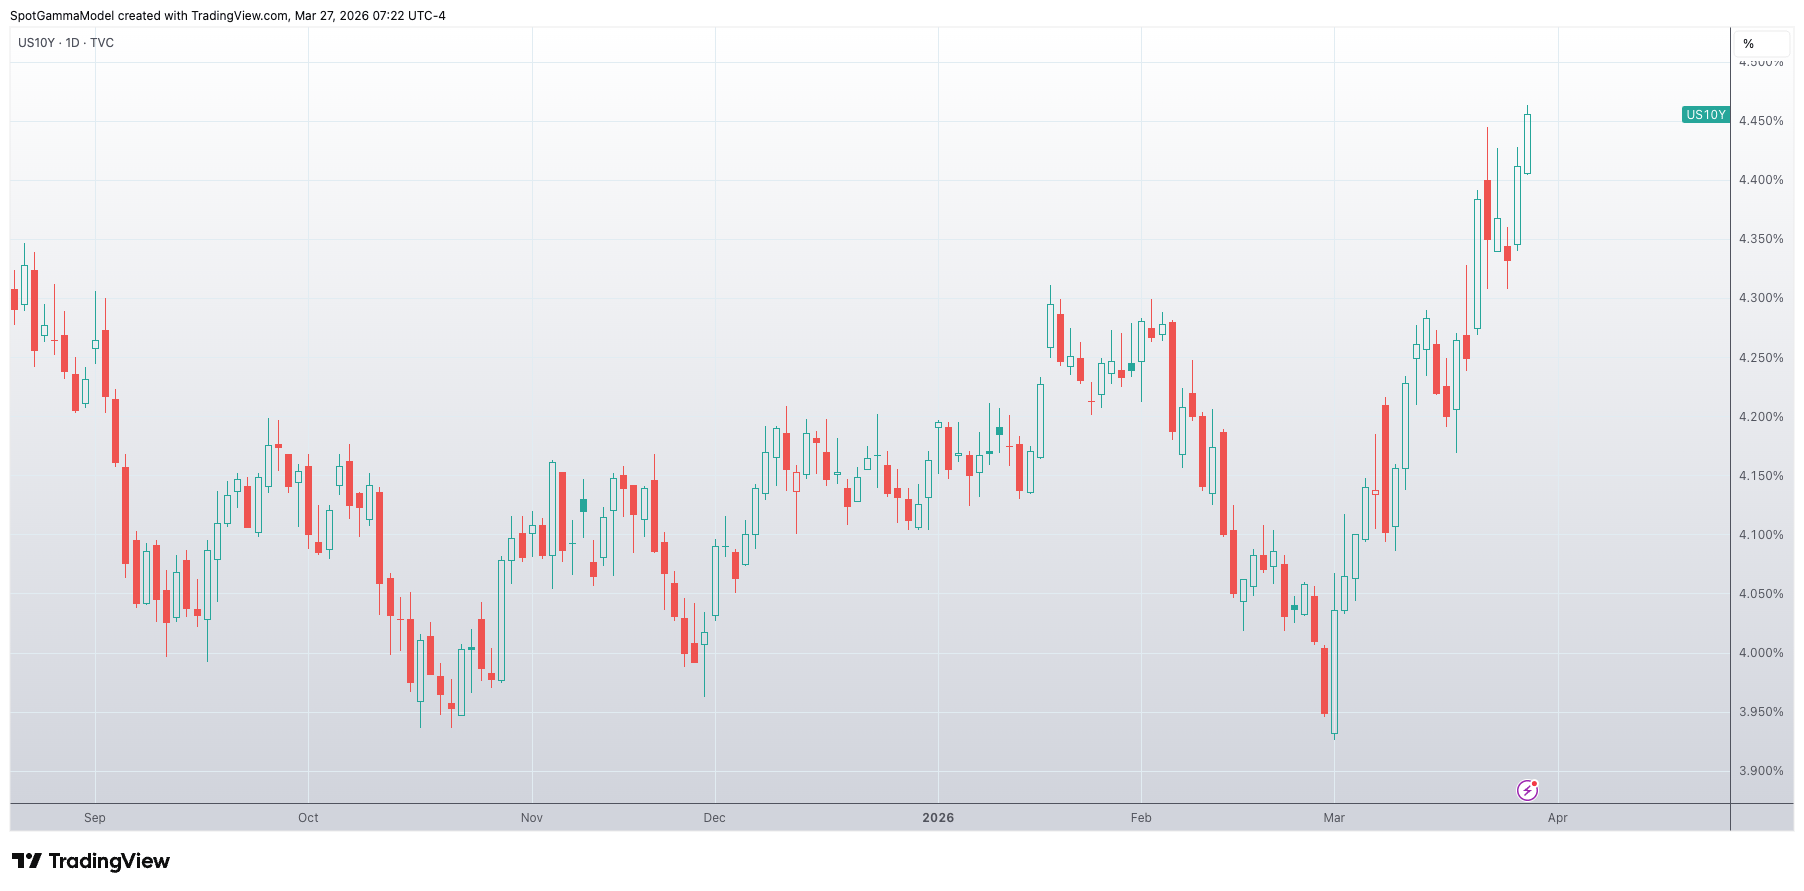
So now we are staring down CL about to go +100, VIX about to go +30, and US rates about to "pop off" with the 10Y +4.45% (8-month highs).
Let's talk about the risk of convexity. Yesterday we flagged the very odd movement in equity vol, relative to oil movement and a relative lack of obvious headline risk. In other words: we couldn't find an obvious reason for equity vol to be bid like it was. Low-and-behold yesterday was the largest SPX down-day in the last 30. This is not us spiking a ball on a call, its an acknowledgement that "something was/is up".
On this point it remains fairly surprising that the VIX is at ~30 given SPX realized vol is near 13% (go here to review this topic).
All TenTen Capital LLC DBA SpotGamma materials, information, and presentations are for educational purposes only and should not be considered specific investment advice nor recommendations. Futures, foreign currency and options trading contains substantial risk and is not for every investor. An investor could potentially lose all or more than the initial investment. Risk capital is money that can be lost without jeopardizing one's financial security or lifestyle. Only risk capital should be used for trading and only those with sufficient risk capital should consider trading. Past performance is not necessarily indicative of future results. VIEW FULL RISK DISCLOSURE https://spotgamma.com/model-faq/disclaimer/
Market Recap
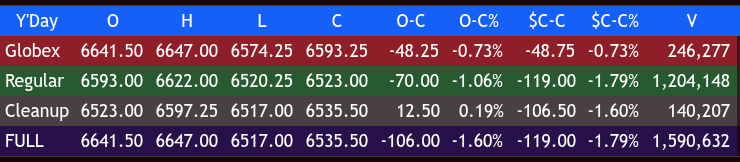
The ES made a high at 6641.50 and sold off to 6574.25 on Globex with 245K contracts traded, and opened Thursday’s regular session at 6593.00, down 49 points (-0.74%).
After the open, the ES traded 6594.00, then moved down to 6579.75 at 9:40, rallied to 6622.00 at 10:15, pulled back to 6607.00, then shot up to a 6722.00 double top as Trump started talking, before dropping sharply to a higher low at 6580.75 at 10:55. It then rallied to 6602.00 at 11:05, sold off to a new low at 6560.75 at 12:20, and back-and-filled until 1:05 before breaking down again to another new low at 6550.00 at 1:40 after the weak U.S. 7-Year Note auction (High Yield 4.255%, Tail +0.8 bps, Bid-to-Cover 2.43, $44B sold; awards: 24.47% at high, Primary Dealers 12.4%, Direct 25.0%, Indirect 62.6%).
The ES then traded down to 6536.00 at 1:55, bounced to 6547.25, sold off again to 6536.25 (1 tick above the low), rallied to 6548.50, and around that time, a Bloomberg headline hit: “A wave of redemption requests across the private credit industry has left more than $4.6 billion of investor capital trapped…”
Price then sold off to 6525.25 at 3:45 and traded 6529.25 as the 3:50 cash imbalance initially came out small to sell, then flipped to $3B to sell. The ES pushed to a new low at 6517.00, traded 6523.00 on the 4:00 cash close—and that’s when the fun began.
After 4:00, the ES traded up to 6525.25 at 4:05, and at 4:11, Trump posted this on Truth Social:
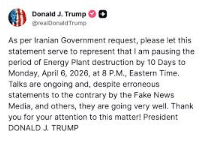
It's obvious that Trump hates it when the stock market sells off, and after the headline, the ES rallied 75.25 points up to 6597.25 in one minute, sold off 65.50 points down to 6531.75 at 4:25, rallied back up to 6554.75, sold off down to 6533.75, and settled at 6535.50, down 119 points or -1.52%. The NQ settled at 23,877, down 572 points or -2.34%, the YM settled at 46,404, down 469 points or -1.00%, and the RTY settled at 2523.90, down 44 points or -1.79% on the day.
In the end, I think the only thing I have to say is... Trump pulled another TACO yesterday, but I don't think it's going to change the Middle East war. In terms of the ES’s overall tone, it was not great on Wednesday and got worse on Thursday. In terms of the ES’s overall trade, volume was low for the size of the range at 1.6 million contracts traded.
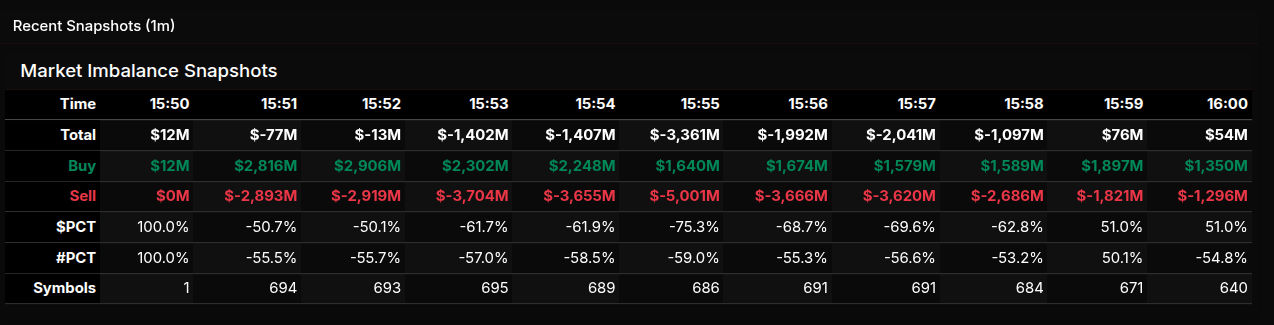
MiM
Market-On-Close Recap
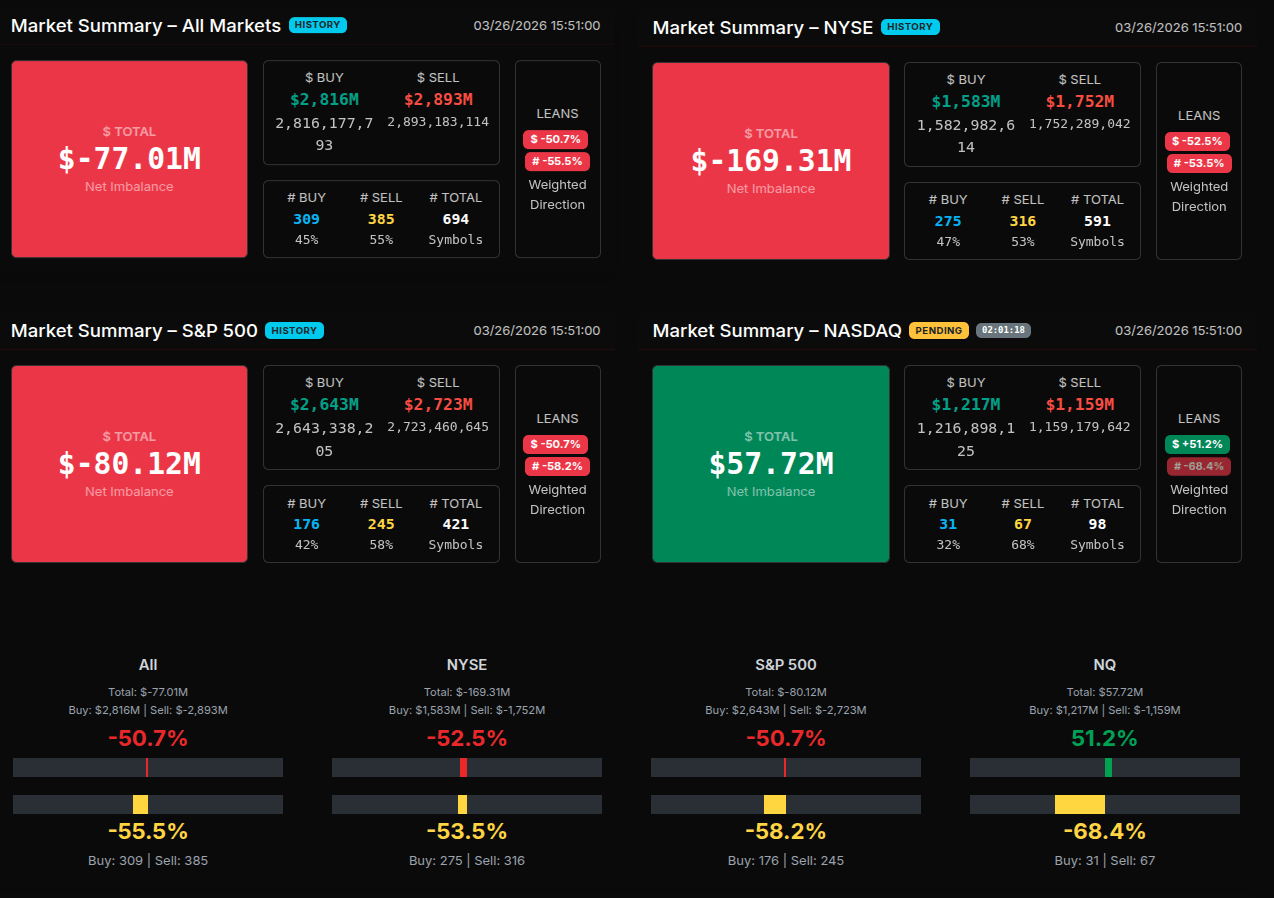
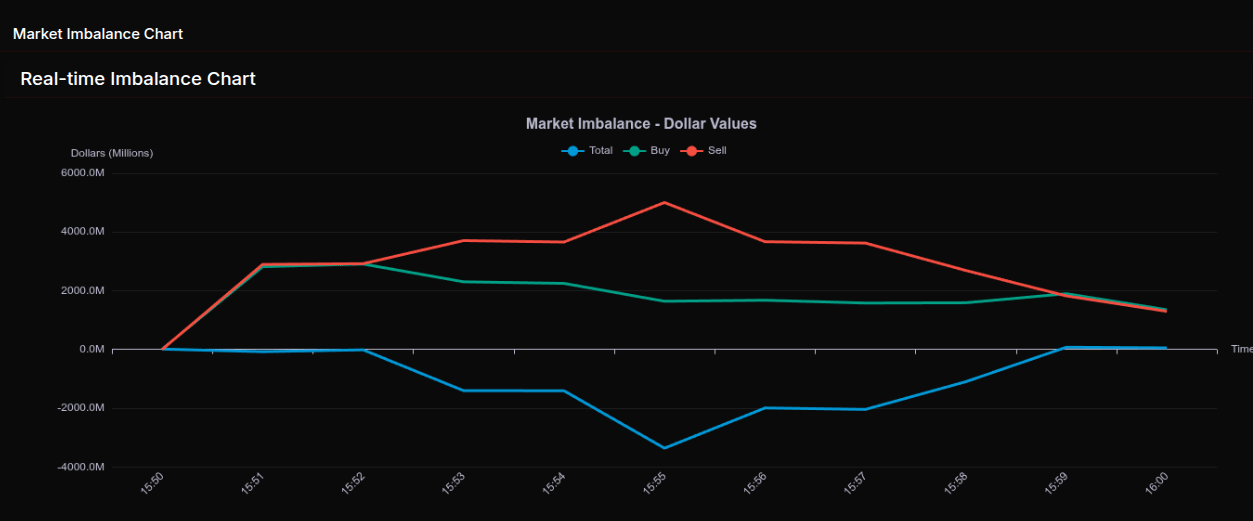
The March 26th MOC session developed into a clear sell-driven close, though the path there was defined by an initial attempt at balance before sustained institutional supply took control.
The open at 15:50 printed a small +$12M buy imbalance, but this quickly flipped. By 15:51, the market expanded to -50.7%, and importantly held near that threshold through 15:52, signaling more rotational activity rather than outright liquidation. However, this condition deteriorated rapidly. From 15:53 through 15:58, sell pressure accelerated and became dominant, with readings pushing into -61% to -75% territory. The -75.3% print at 15:55 stands out as a wholesale sell program, confirming aggressive institutional distribution rather than passive rebalancing.
Into the close, there was a late reversal. At 15:59 and 16:00, the imbalance snapped back to +51%, indicating a sharp offsetting buy program, but not enough to undo the earlier damage. Net result finished modestly negative (-$77M), masking the severity of the mid-auction sell pressure.
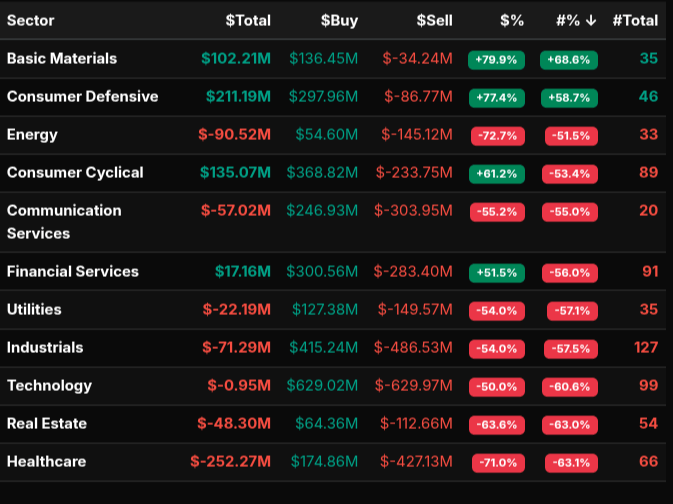
Sector flows reinforce this. Healthcare (-71%) and Energy (-72.7%) both registered extreme sell-side imbalances, signaling broad liquidation. Real Estate (-63.6%) and Communication Services (-55%) also leaned heavily offered. Industrials and Utilities both printed near -54%, confirming cyclical and defensive sectors alike were being sold.
On the buy side, Basic Materials (+79.9%) and Consumer Defensive (+77.4%) showed strong accumulation, both exceeding the 66% threshold—indicative of targeted institutional buying. Consumer Cyclical (+61.2%) and Financials (+51.5%) were more rotational in nature.
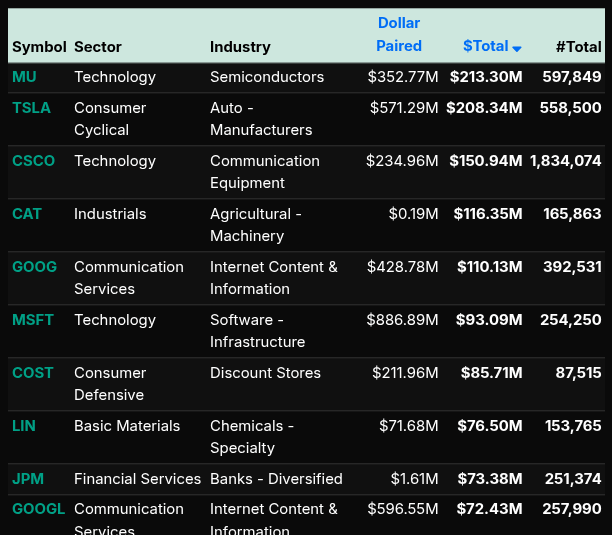
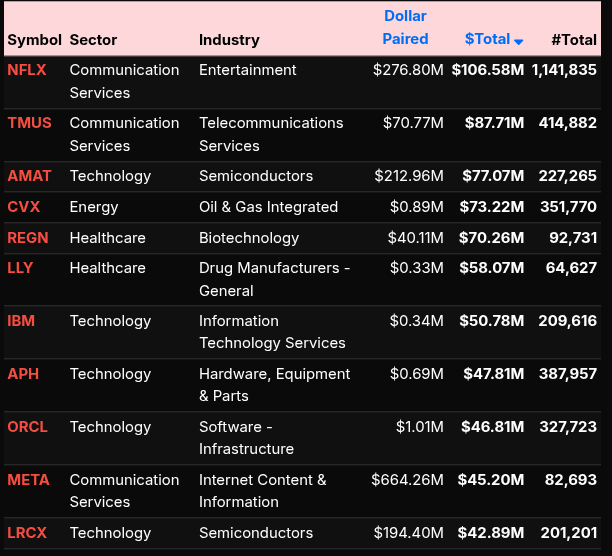
At the symbol level, flows were mixed. Strong buys concentrated in MU, TSLA, and CSCO, while notable sells included NFLX, TMUS, and AMAT. Technology was particularly split, reflected in its near -50% sector reading, highlighting internal rotation rather than directional conviction.
Overall, this was a sell-dominated MOC with clear institutional distribution mid-auction, partially offset by late buy programs, and characterized by sharp sector divergence and internal rotation beneath the surface.
ES Levels
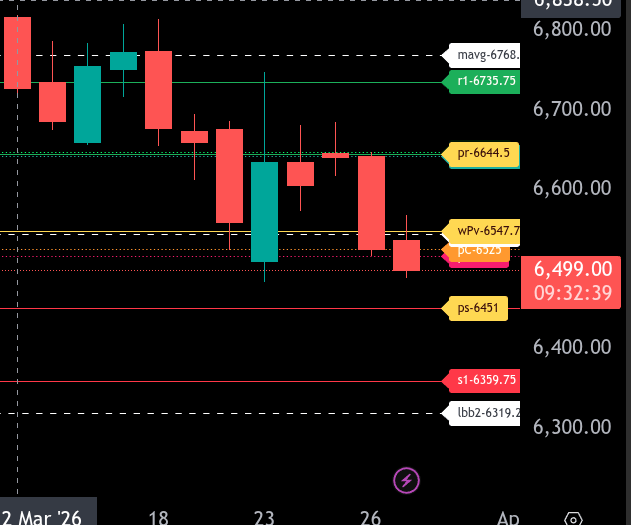
The bull/bear line for the ES is at 6547.75. This is the key pivot for today. Price is currently trading below this level around 6497.50, keeping the market in a bearish posture unless buyers can reclaim and hold above it.
With price below 6547.75, downside pressure remains in control. Initial support comes in at 6525.00 and 6517.00, which have already been breached, opening the door for continuation lower toward 6451.00, the lower range target. If 6451.00 fails to hold, the next major downside level sits at 6359.75.
On any bounce, 6547.75 is the first level bulls must reclaim. Acceptance back above this level would shift momentum and open the path toward 6644.50, the upper range target. Additional resistance above comes in at 6735.75.
Overall, the structure remains bearish below 6547.75. Traders should expect sell-the-rip behavior unless price can reclaim and sustain above the bull/bear line, which would be the first indication of a shift in control.
NQ Levels
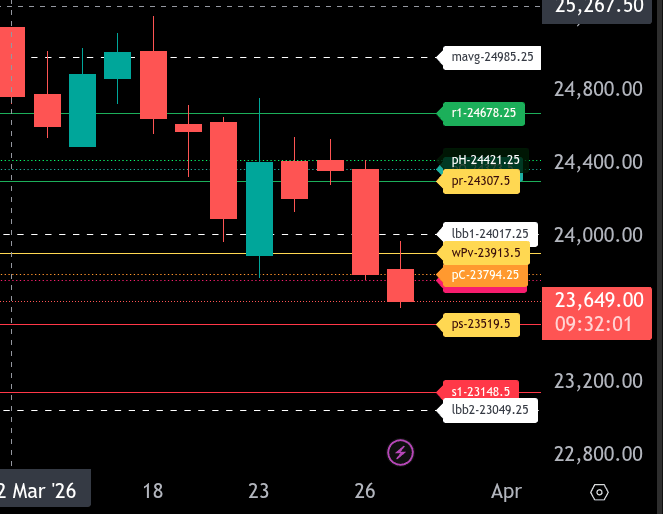
The bull/bear line for the NQ is at 23913.50. This is the key inflection level for today. Acceptance above this level would shift momentum back to the upside, while continued trade below keeps the market in a bearish posture.
NQ is currently trading around 23651.50 after a sharp downside move, showing clear weakness below the bull/bear line. As long as price remains below 23913.50, sellers are in control and continuation lower is favored.
On the downside, initial support comes in at 23519.50, which is the lower range target for today. A break and hold below this level opens the door to 23148.50, followed by 23049.25. Given the strength of the recent selloff, these levels are in play if downside momentum persists.
On the upside, resistance is stacked overhead starting at 23763.25 and 23794.25. Above that, 23913.50 is the key reclaim level. If bulls can push price back above this level and hold, we look for a move toward 24017.25 and then 24307.50, which is the upper range target.
Overall, the trend remains bearish below 23913.50. Any rallies into resistance should be viewed as potential selling opportunities unless price can reclaim and hold above the bull/bear line. Sustained acceptance above 24307.50 would be required to shift the broader tone back to bullish..
Technical Edge
Fair Values for March 27, 2026
SP: 44.75
NQ: 191
Dow: 251.29
Daily Breadth Data 📊
For Thursday, March 26, 2026
• NYSE Breadth: 34% Upside Volume
• Nasdaq Breadth: 32% Upside Volume
• Total Breadth: 32% Upside Volume
• NYSE Advance/Decline: 29% Advance
• Nasdaq Advance/Decline: 30% Advance
• Total Advance/Decline: 30% Advance
• NYSE New Highs/New Lows: 76 / 104
• Nasdaq New Highs/New Lows: 76 / 320
• NYSE TRIN: 0.81
• Nasdaq TRIN: 0.92
Weekly Breadth Data 📈
Week Ending Friday, March 20, 2026
• NYSE Breadth: 41% Upside Volume
• Nasdaq Breadth: 45% Upside Volume
• Total Breadth: 44% Upside Volume
• NYSE Advance/Decline: 28% Advance
• Nasdaq Advance/Decline: 29% Advance
• Total Advance/Decline: 28% Advance
• NYSE New Highs/New Lows: 155 / 291
• Nasdaq New Highs/New Lows: 194 / 716
• NYSE TRIN: 0.53
• Nasdaq TRIN: 0.48
Calendars
Economic Calendar Today
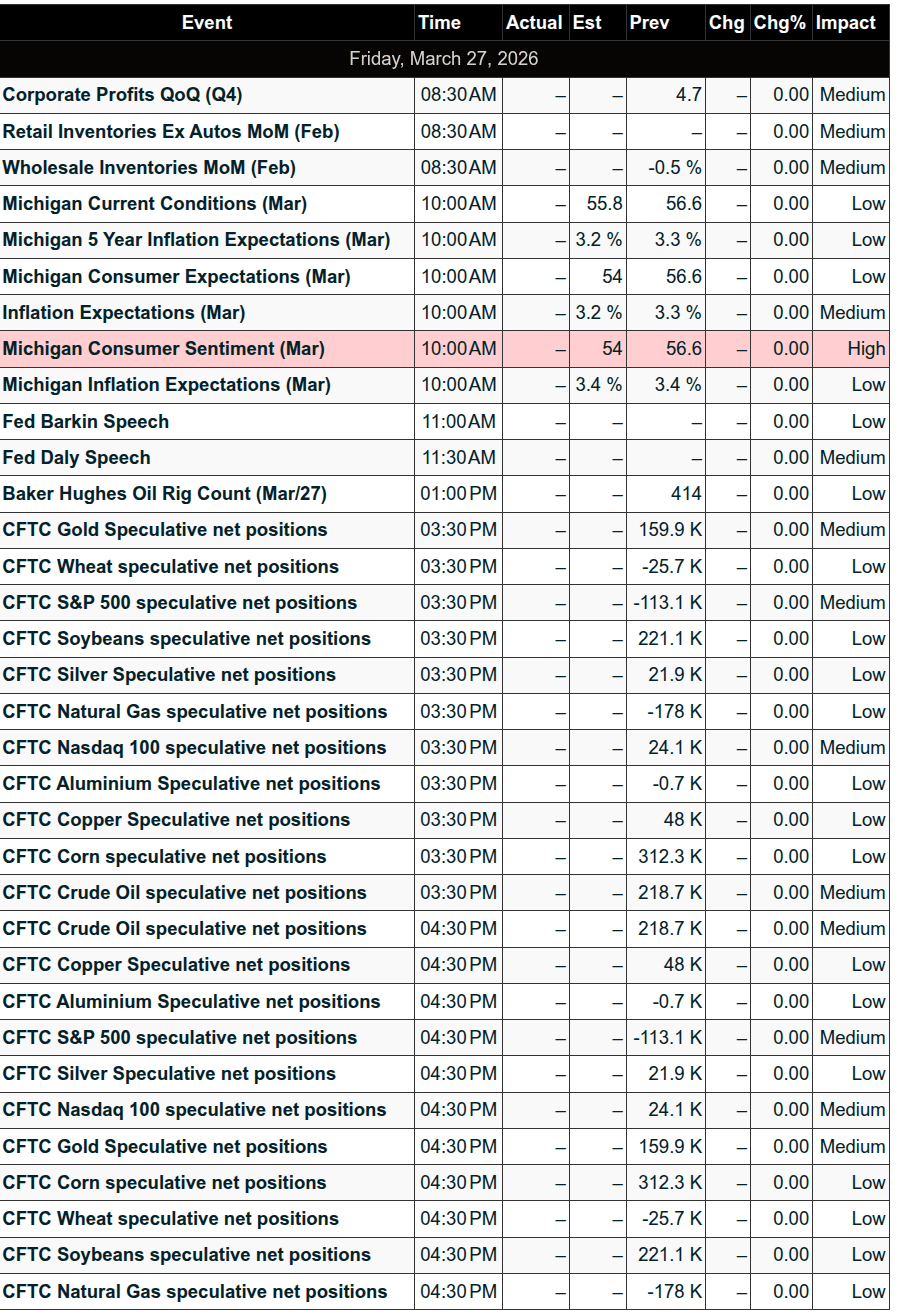
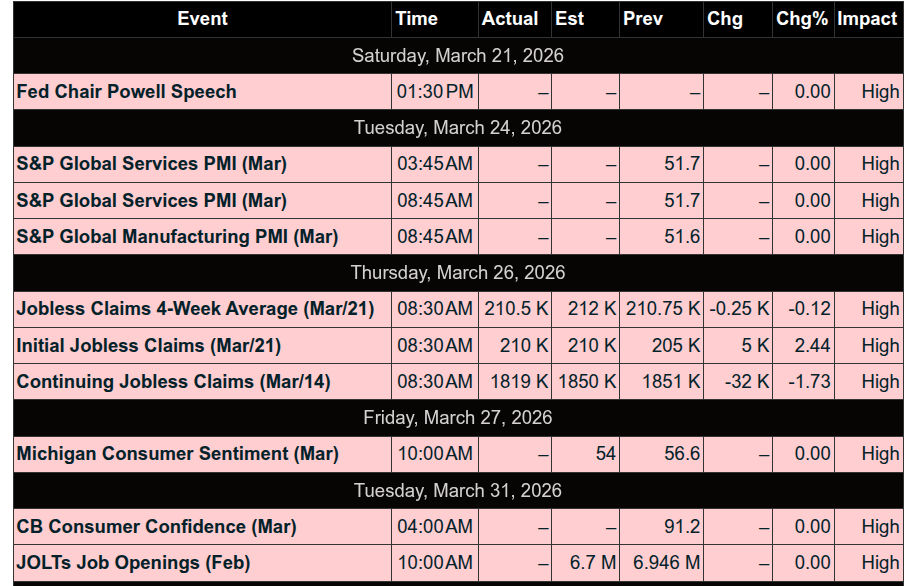
This Week’s High Importance
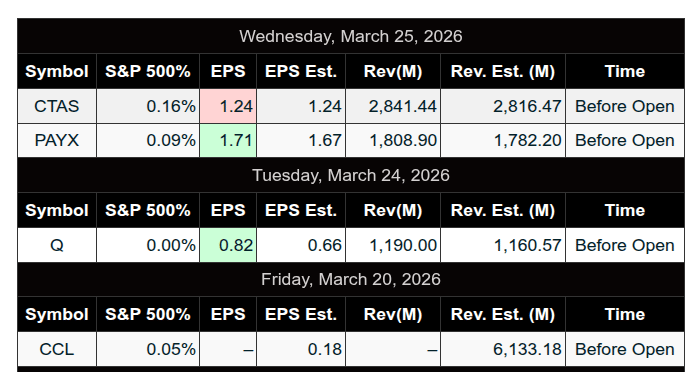
S&P 500 Earnings:
Upcoming:
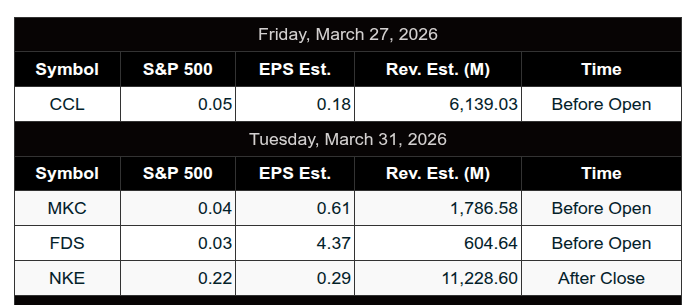
Recent:
Trading Room News:
Polaris Trading Group Summary - For Thursday, March 26, 2026
The session started with a relatively structured and technical tone, with David outlining key levels and emphasizing the importance of the dynamic “line in the sand” at 6600. Early on, bulls showed some strength by clearing and converting that level, setting up pullback opportunities for longs, with the next key test at 6615 (prior low).
Morning Trades & Execution
The team identified a high-quality A10 setup around 95, confirmed as a valid extreme.
A strong teaching moment came from members noting confluence (VWAP + A7 + 200 extreme)—highlighting how the best trades aligned multiple factors.
These setups were described as fast but effective, reinforcing the importance of readiness and execution speed.
Open Range Results (Key Focus)
CL (Crude Oil):
The standout trade of the day.
Open Range short worked very well, allowing for:
Multiple scales
Trailing stop management
Demonstrates strong adherence to the system and trade management.
ES & NQ:
Both Open Range trades failed and were stopped out (-1R each).
Important reminder: not all correlated markets will perform equally, and discipline in taking losses is key.
Midday to Afternoon – Market Narrative
Price action began to weaken significantly.
David called for a Cycle Day 1 downside scenario, targeting:
6565 violation level
Sunday Globex breakout level retest
The market followed this roadmap closely, showing the strength of the cycle framework and pre-planning.
Afternoon Breakdown & Precision Calls
Continued weakness led to a move toward:
Prior week’s low: 6523.75
This level was accurately anticipated well in advance, reinforcing confidence in:
The PTG calculator
Higher timeframe context
The day ultimately became a full round-trip from the Sunday Globex rally, completely retracing the earlier “pump.”
Closing Action
Strong sell imbalance (~$2B) into the close.
Market closed near the lows of the day, confirming:
A “perfect Cycle Day 1” bearish structure
Clear institutional pressure into the close
Key Takeaways & Lessons
Confluence matters: The best trades came when multiple signals aligned.
Execution speed is critical: High-quality setups moved quickly.
Risk management worked: Losses in ES/NQ were controlled and offset by CL performance.
Trust the framework: Cycle Day analysis and key levels mapped the day exceptionally well.
Stay directional when structure confirms: The shift from early bullish potential to sustained weakness was identified and traded effectively.
DTG Room Preview – Friday, March 27, 2026
Geopolitics / Macro Focus
Market attention centered on Middle East tensions
Trump delays potential strike on Iran energy infrastructure by 10 days → short-term de-escalation tone
Iran still not engaging diplomatically → conflict risk persists
Oil supported on expectations disruption (Strait of Hormuz) could extend into April+
Policy / Washington
Senate passed TSA funding bill (excluded ICE) after pressure from extreme airport delays
Major congestion reported in Atlanta, Houston, NYC
Bill now heads to House; Trump expected to sign
Tech / Regulation
Landmark ruling: YouTube (GOOGL) + Meta platforms liable for user addiction
$3M damages awarded → potential broader implications for social media sector
Equities / Flow
Thursday selloff hit Mag 7 (Apple only name green)
Drawdowns from highs:
MSFT -33% (weakest; slowing growth + heavy AI spend)
META -25%, TSLA -22%, AMZN -18%, GOOGL -16%, NVDA -15%, AAPL -12%
Google AI developments cited as catalyst for disrupting AI trade expectations
Volatility elevated (ES 5-day ADR: 148.5)
Whale flow: bearish bias into US open
AI / Industry
OpenAI ad pilot generating ~$100M annualized revenue in 6 weeks
Strong advertiser demand (600+ advertisers, 80% SMB)
Ads limited to free + Go tiers, separate from core output
Consumer / Media
Netflix raising prices across all tiers
ARPU expected to rise ~6% YoY (TD Cowen)
Continued push into live sports + video podcasts
Earnings / Events
Premarket: Carnival (CCL)
Monday: KT
Data: UoM Sentiment + Inflation Expectations (10:00 ET)
Fed: Daly (11:30), Paulson (11:40)
Technical / Levels (ES)
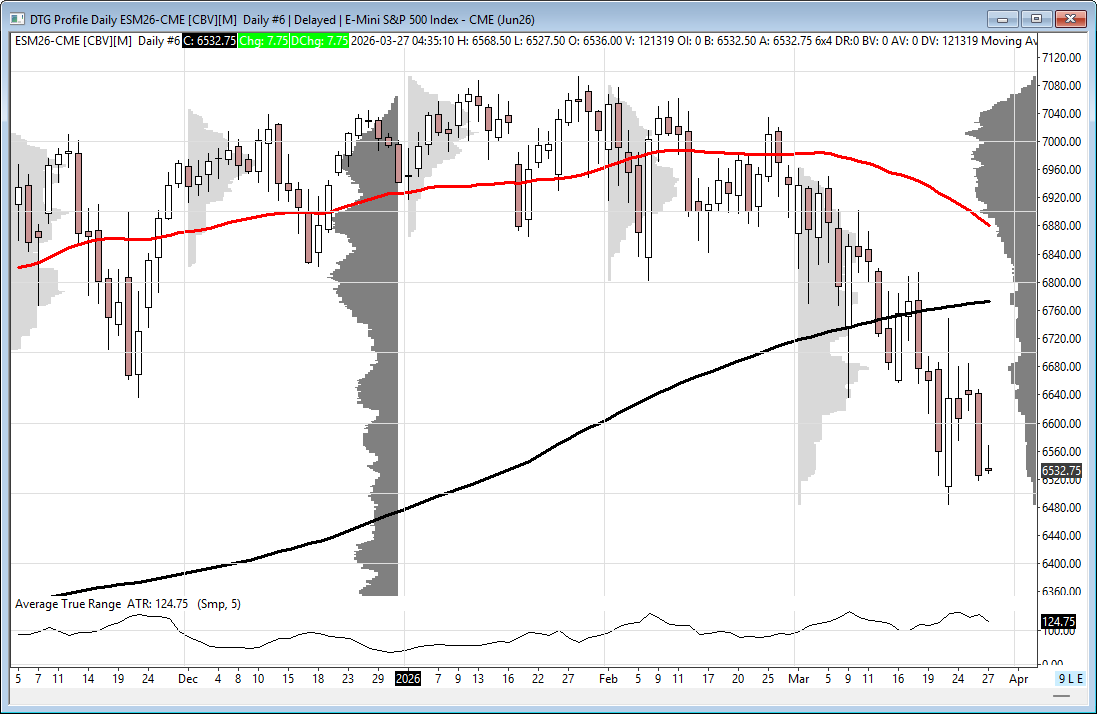
Trading mid-range within short-term downtrend channel
200-day MA: 6772 (resistance, likely out of play today)
50-day MA: 6881 (closing gap with 200-day)
Resistance Levels
6651/46
6737/32
6920/15
Support Levels
6390/85
Affiliate Disclosure: This newsletter may contain affiliate links, which means we may earn a commission if you click through and make a purchase. This comes at no additional cost to you and helps us continue providing valuable content. We only recommend products or services we genuinely believe in. Thank you for your support!
Disclaimer: Charts and analysis are for discussion and education purposes only. I am not a financial advisor, do not give financial advice and am not recommending the buying or selling of any security.
Remember: Not all setups will trigger. Not all setups will be profitable. Not all setups should be taken. These are simply the setups that I have put together for years on my own and what I watch as part of my own “game plan” coming into each day. Good luck!!
Follow @MrTopStep on Twitter and please share if you find our work valuable!