- The Opening Print
- Posts
- Just another manic monday. Chart topper.
Just another manic monday. Chart topper.
End of February, positioning for March
Danny Riley
February 26, 2024
Follow @MrTopStep on Twitter and please share if you find our work valuable!
Every week, MrTopStep invites traders to an “Own the Close” contest where the closest guesstimate where the SPX will settle on Friday’s 4:00 cash close.
The winners get a free week's access to the MrTopStep Chat and trading tools. Enter your guess now!
Congratas to Friday’s winner Sean L. See you in the room, Sean!
Make sure you sign up forour partner SpotGamma’s 4-day event for a better understanding of volatilty and its impact on Options and the overall Market:

Our View
Danny is taking a much needed rest. Today’s post is written mostly by Marlin doing a poor job filling in. Any feedback ([email protected]) would be greatly appreciated.
Today's market outlook is marked by a blend of anticipation and caution as U.S. index futures have recently hit new all-time highs, driven by various factors, including last week's remarkable Nvidia earnings which reignited the AI stock frenzy. The Emini S&P, Nasdaq, and Emini Dow Jones futures have all shown significant movements, pointing to a complex market environment that traders and investors need to navigate carefully.
Starting with the Emini S&P March futures, they've not only beaten the previous all-time high of 5066 but also reached new heights, peaking at 5120/25 last Friday. This bullish trend is expected to continue with potential further gains towards 5140/45. However, any downside correction should find solid support at 5065/60, with a crucial stop-loss point below 5050.
In contrast, the Nasdaq March futures displayed a slight increase but reversed after hitting a new all-time high at 18144, closing lower on the day. This development suggests that the Nasdaq might experience a dip towards the 17800/750 support level, with a more substantial support zone at 17600/500. Investors should place stop losses below 17700 and 17400, respectively, to manage risk. A breakout above 18120/145 could signal a buying opportunity, targeting 18200/220 and potentially extending to 18320/340.
The Emini Dow Jones March futures also surpassed their all-time highs, reaching a peak at 39343. The market maintains a positive outlook as long as it holds above the 39000/38900 support zone, eyeing targets at 39450/500. Yet, caution is advised, with stop losses recommended below 38750 to protect against potential downturns.
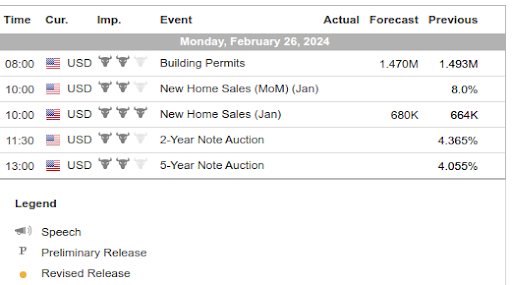
This week, inflation data is poised to take center stage again, with the Personal Consumption Expenditures (PCE) index release on Thursday. The economic calendar is packed with significant data releases every day, including New Home Sales, Durable Goods, and various PMI readings, which could influence market sentiment and trading strategies.
Market commentary suggests that despite the potential for a tech bubble fueled by AI advancements, there's optimism. Companies like Microsoft and Nvidia are leading the way with profitable AI business models, though the market remains vigilant for any signs of overextension. Furthermore, the expectation of Fed rate cuts in 2024, amidst a backdrop of supportive comments from Fed officials, adds another layer of complexity to market dynamics.
Corporate earnings also continue to be a focal point, with major companies like Salesforce, Lowe’s, and Best Buy among those reporting this week. These earnings could provide further insights into the market's direction, especially in sectors poised for growth or facing challenges.
Our Lean — Danny’s Trade
This is Danny Riley’s personal trading plan for the day.
To get this delivered daily, please consider upgrading to a paid membership.
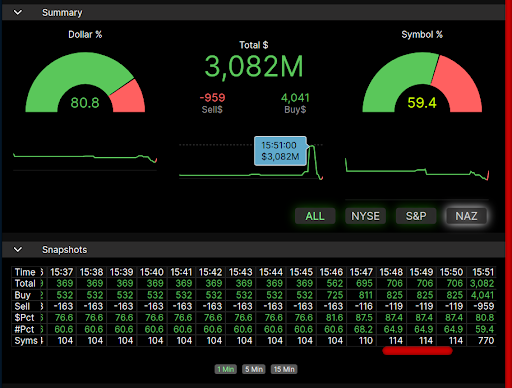
MiM and Daily Recap
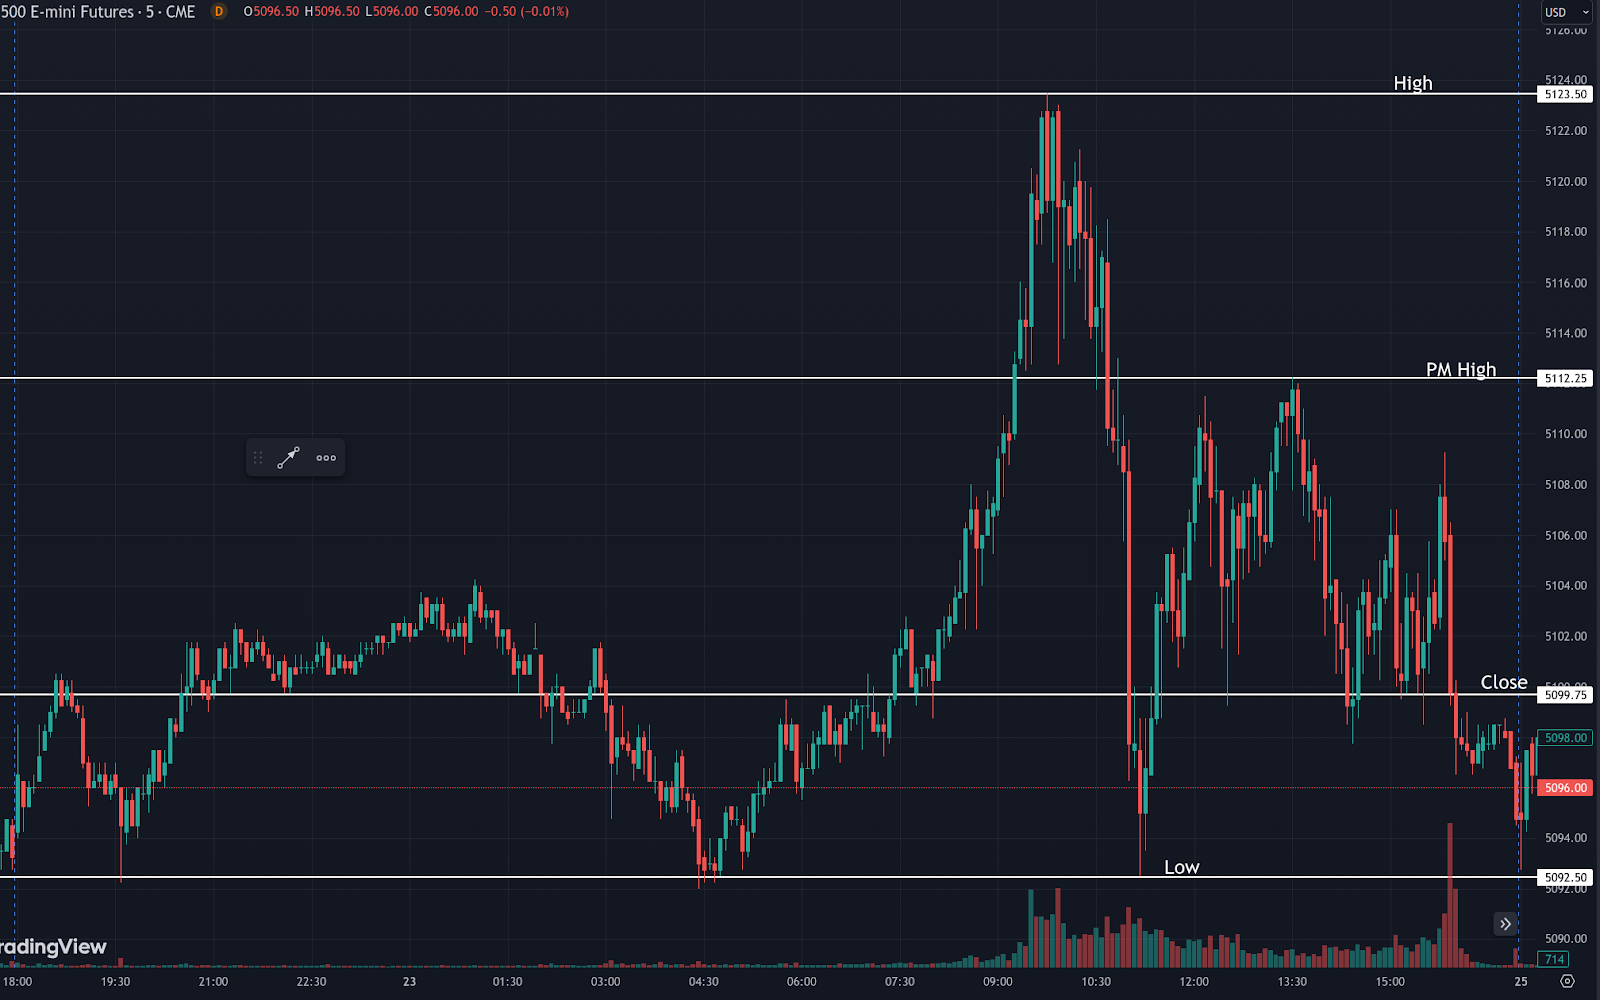
The ES futures experienced a notable range on Friday. The day began with a gradual uptrend, followed by a consistent rise during early trading hours, reaching a market high of 5123.50 @ 9:45 ET, just 15 minutes into cash trading. However, this peak was short-lived as prices faced a sharp reversal, descending swiftly to mark the day's low of 5092.50 @ 11:10 ET. This downturn represented a significant shift in market sentiment and a reaction to new highs.
Subsequently, prices recovered somewhat, embarking on a zigzag trajectory with several smaller peaks and troughs, indicating a volatile trading session with active buying and selling pressures. The market struggled to regain the earlier highs, oscillating within a narrower 13-point range as the day progressed.
Towards the 4pm ET close of 5099.25, prices seemed to stabilize, consolidating near the lower end of the day's trading range, ending with a final dip. The closing price was markedly lower than the PM high, suggesting bearish control or a lack of positive momentum to drive a recovery. The volume bars accompanying the price movements suggest that significant trading activity coincided with both the sharp decline and the ensuing recovery attempts, reflective of the market's attempt to find equilibrium after the initial sell-off.
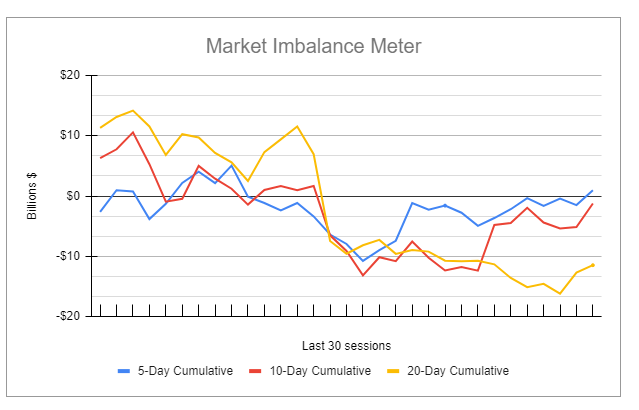
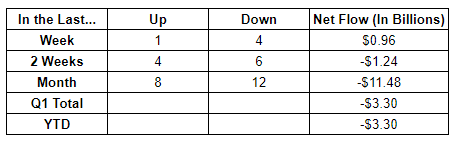
For more info on accessing the MIM, please visit here.
Technical Edge
Last week we introduced a new feature, MTS Levels. We will expand this over time and improve their posting so you can download them into your favorite charting package.
Today’s trading ranges for ES, YM, NQ are 35, 190, and 209, respectively.
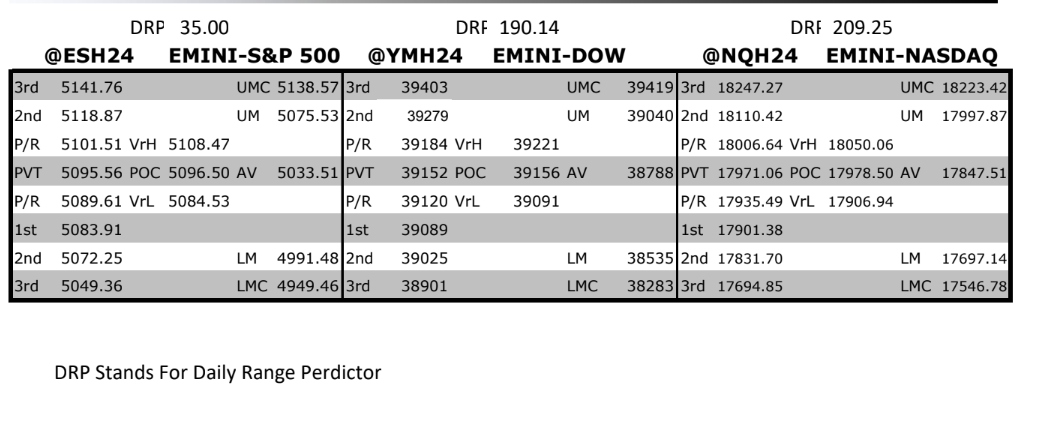
To better understand the levels and how to use them read this: How to use MTS levels
Economic Calendar