- The Opening Print
- Posts
- If the Econ Data Behaves, December’s First Licks Could Be Straight-Up
If the Econ Data Behaves, December’s First Licks Could Be Straight-Up
Follow @MrTopStep on Twitter and please share if you find our work valuable!
Our View
I don't need the Wall Street Journal to tell me why the S&P and Nasdaq rallied. I’ve learned over the years not to pat myself on the back, but after all the hoopla and AI bubble scare tactics, the ES is back where it was when the sell-off started.
I never fell for any of the "AI Bubble" BS, and after the 6525.00 low on 11/20, the ES has rallied 338.55 points. Over the last five sessions, it has rallied +239.25 points or +3.62%, and is 91 points off its all-time contract high of 8954.75.
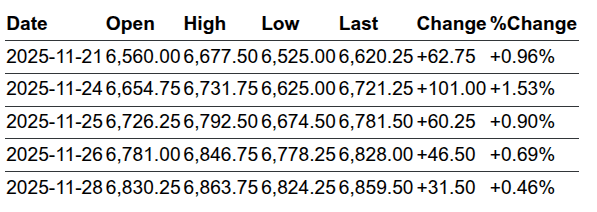
ESz
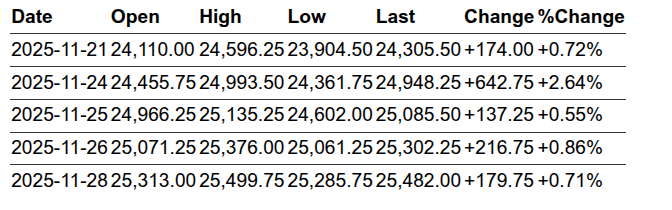
NQz
The NQ made its low on 11/20 at 24,073.27 and made a high on Friday at 25,499.75 — that’s a gain of 1,426.50 points or +5.93%. Over the last five sessions, the NQ has gained 1,176.50 points or +4.84%, and is now 899.25 points off its 26,399.00 all-time contract high.
JPMorgan and Goldman Sachs Rate Cut Reversal
J.P. Morgan and Goldman Sachs now forecast a 0.25% bps Federal Reserve rate cut during the December 9–10 FOMC meeting, which would lower the federal funds target range from the current 3.75–4.00% to 3.50–3.75%.
J.P. Morgan reversed its earlier January call after recent Fedspeak—notably from New York Fed President John Williams—tilted the balance, while Goldman Sachs says the soft September jobs report effectively “sealed” the move, especially with no major data releases left before the meeting.
Both banks cite cooling labor-market trends and moderating inflation (near the 2% target, excluding tariff effects) as justification, following the Fed’s back-to-back 0.25% bps cuts in September and October.
Market pricing on the CME FedWatch Tool has jumped to roughly 85% odds of a December cut (up from 30% in mid-November), even as Chair Powell insists there is “no preset course,” and some officials remain wary of inflation risks. With the Fed also ending balance-sheet runoff on December 1, attention is squarely on this potential final cut of 2025.
The Week Ahead
Fed Blackout, Economic Reports, and Earnings Key Events
The Fed's Blackout period started Saturday, November 29, and ends on December 11. To learn more about the Fed Blackout Period, you can find the official blackout calendar on the Federal Reserve Board website.
Day | Date | Highlight Event (Time ET) | Notable Earnings (Time ET) |
|---|---|---|---|
Monday | December 1 | ISM Manufacturing PMI (10:00 AM) | CrowdStrike (CRWD) (~7:00 AM) |
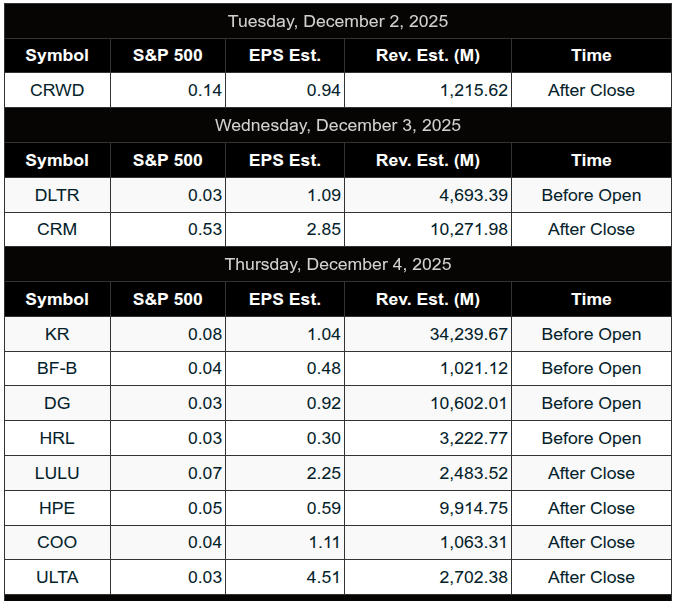
Tuesday | December 2 | Construction Spending MoM (10:00 AM) | Salesforce (CRM) (~4:30 PM) |
Wednesday | December 3 | ISM Non-Manufacturing PMI (10:00 AM) | – (no major large-cap earnings confirmed) |
Thursday | December 4 | International Trade Balance (8:30 AM) | – (no major large-cap earnings confirmed) |
Friday | December 5 | Personal Income & PCE Price Index (8:30 AM) | – (no major large-cap earnings confirmed) |
After Salesforce on Tuesday, the rest of the week is very quiet for big-cap earnings reports.
Our View
Despite the 5-day rally, the ES still closed down 2.82% and the NQ closed down 1.92%. That said, the end-of-month rotation favored buying, and I think that's what we’ll see in the first trading days of December, barring some past-due, negative economic reports, which could cause some type of temporary sell-off.
As of last Friday’s close, 95% of the S&P have reported their third-quarter earnings, with 83% of the companies beating analysts’ earnings per share (EPS) estimates—higher than the long-term average—and marking one of the strongest quarters since 2021.
Our Lean
Market Recap
In true fashion, the ES traded up to 6810.75 on Globex and opened Wednesday's regular session at 6805.00, up 24.75 points or +0.36%. What did the ES do next? It rallied 18.75 points up to 6823.75 at 9:50, sold off down to the RTH low at 6795.75, rallied 50.75 points up to 6846.50 at 11:40, traded down to 6833.50, rallied up to a lower high at 6844.50 at 1:25, sold off down to 6824.75 at 1:45, rallied up to 6843.25 at 2:30, and then rallied up to 6845.25 at 3:15.
After the high, the ES and NQ both started going offered, the ES traded down to 6835.50 as the 3:50 imbalance showed $1.7 billion to sell, then sold off down to 6825.25 at 3:55.
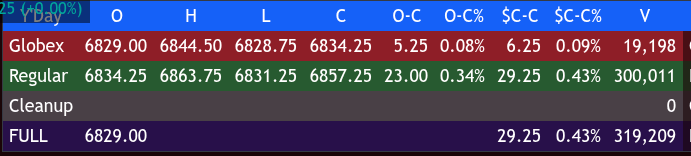
On Wednesday night’s Globex session into Thursday’s Globex session, the ES traded up to 6846.67 and settled at 6828.00, up 46.50 points or +0.69% on a total volume of 1.459 million contracts traded. On Friday, the ES traded up to 6863.75 and settled at 6857.25, up 29.25 points or +0.43%. The NQ settled at 25,085.50, up 131,590 points or +0.55% on the day.
In the end, the market powered higher. In terms of the ES and NQ’s overall tone, they did exactly what they did Monday and Tuesday: they gapped higher, rallied, sold off, and then rallied again.
During Friday's holiday extended Globex trade, the CME experienced an outage from a CyrusOne data center cooling failure that halted trading until 8:30 a.m. Friday and thinned post-Thanksgiving volume. Stocks closed at two-week highs and up five sessions in a row. The semiconductors and energy stocks rallied, with WTI crude up over 1%. The big November month-end rebalance, plus the index markets pricing in an 83% probability of a 25 bps Fed rate cut at the December 9–10 FOMC meeting, came even as October jobs and CPI data were scrapped and folded into delayed November reports due December 16 and 18.
It takes days and weeks to knock the S&P down—and only one to bring it back.

MiM
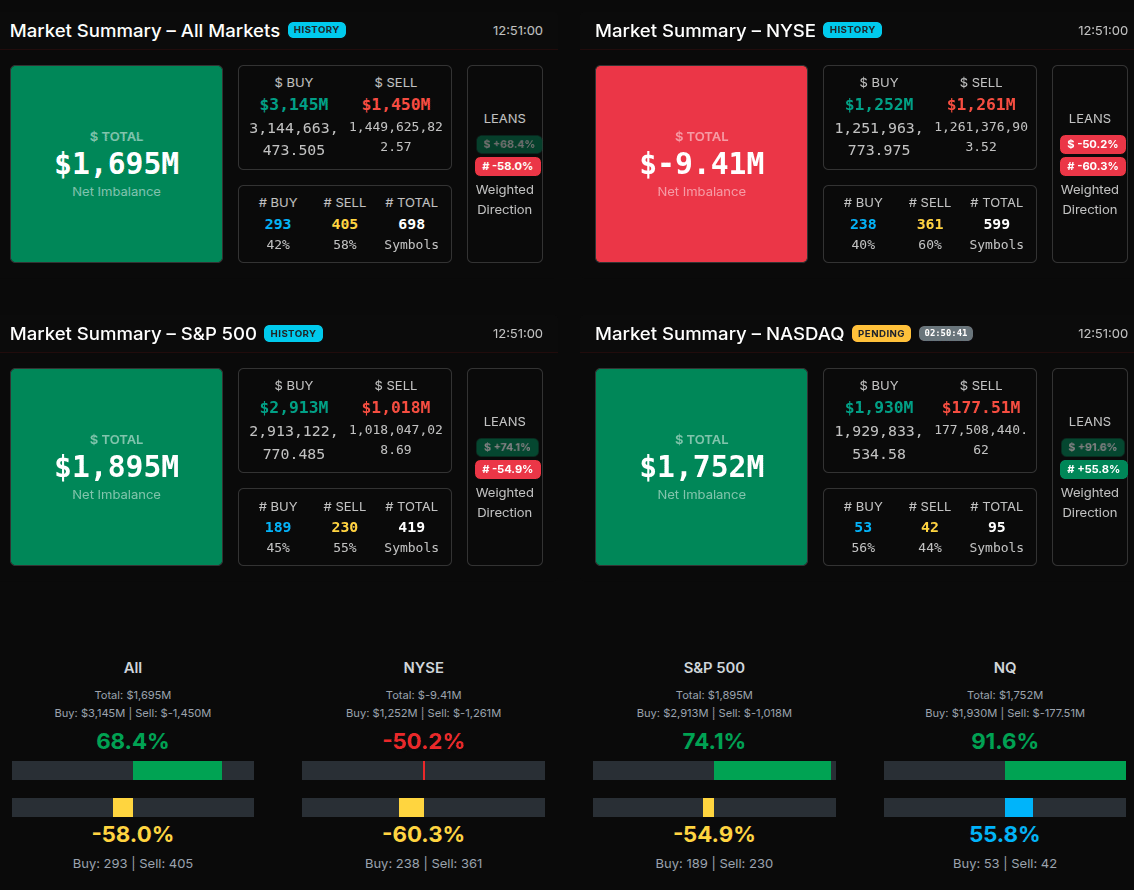
The market-on-close flow opened the 12:50 early-close window with an end-of-month buy imbalance at +$1.695B, with $3.145B buy vs. $1.450B sell. From there, the auction held a steady buy-side tone, though it gradually decayed into the close.
Across the major groups, the S&P 500 showed the strongest and most persistent appetite, opening at $2.913B buy vs. $1.018B sell, a 74% lean — a decisive wholesale-level skew (66%+). NASDAQ was even more one-sided, posting a +91.6% buy lean, supported by mega-cap tech inflows. NYSE, in contrast, stayed negative all the way through with a –$9.41M net and a –50% lean, signaling rotation out of older-economy names while the index-heavy tech and growth complex carried the bid.
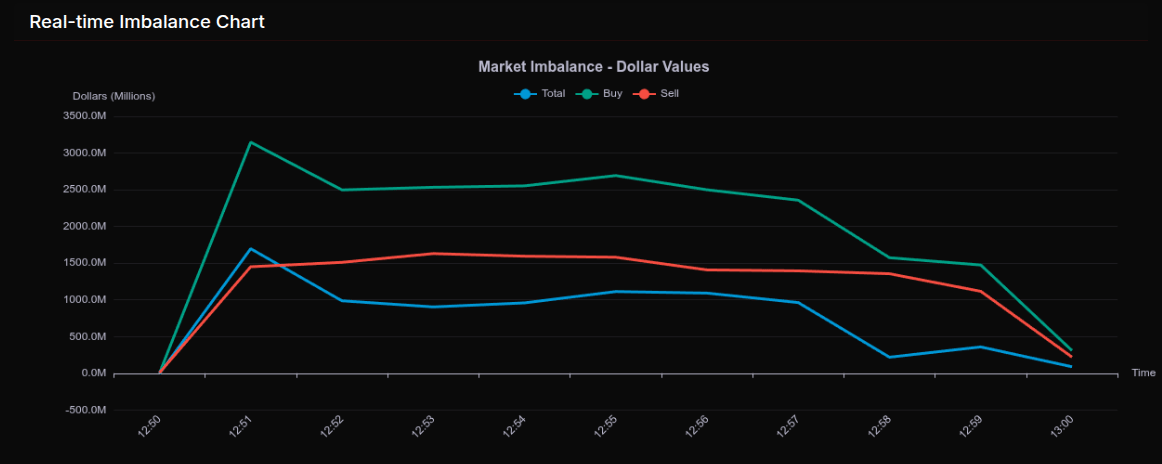
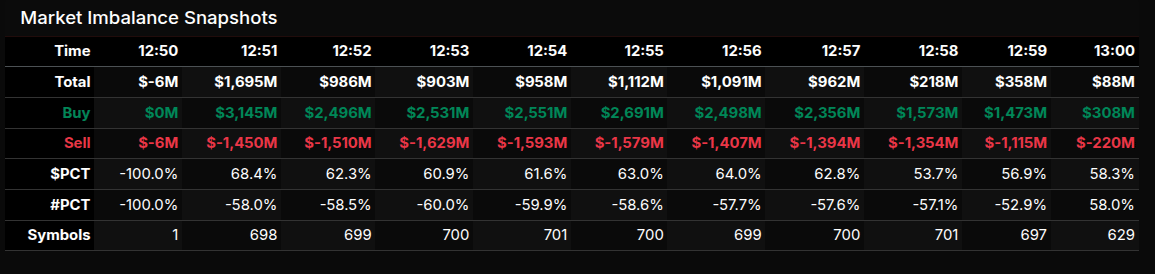
From 12:50 to 13:00, the time-series shows buy pressure peaking at 12:51 ($3.1B), then steadily fading toward $308M by 13:00. Total imbalance fell from $1.695B to just $88M, confirming that the early burst of demand was met with paired liquidity into the final prints. The lean percentages stayed tight, with most slices registering between +62% and +68%, reflecting directional buying but increasingly rotational behavior as paired sellers stepped in.
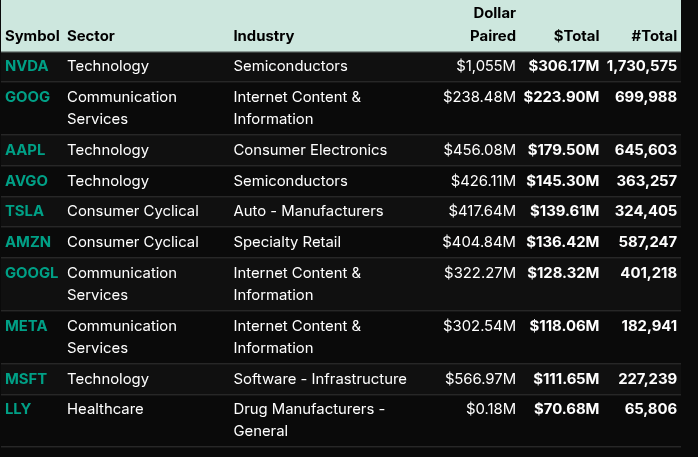
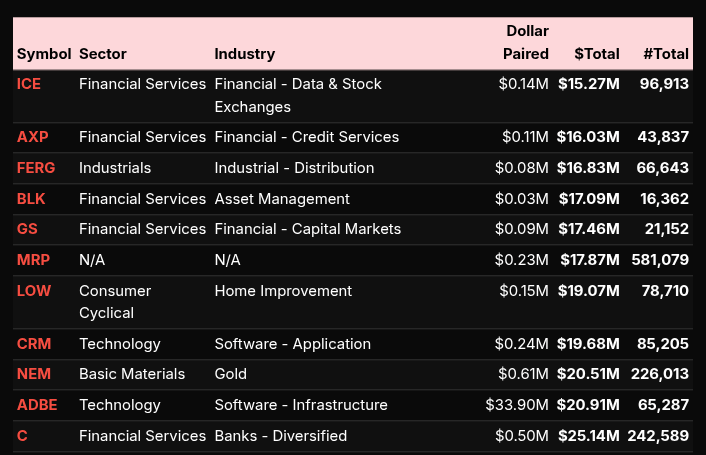
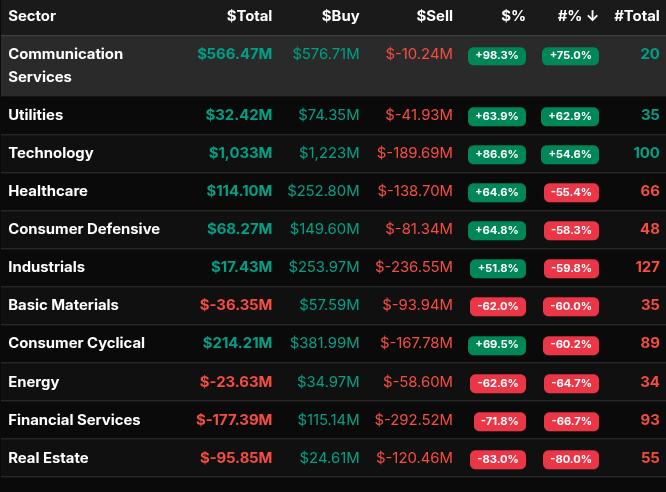
Sector flow was dominated by Technology ($1.033B total) and Communication Services ($566M) — both posting strong buy skews of +86.6% and +98.3%, respectively. Heavyweights led the tape: NVDA ($306M), GOOG/GOOGL ($224M / $128M), AAPL ($180M), MSFT ($112M), and META ($118M).
On the sell side, Financial Services (–$177M), Real Estate (–$95M), and Energy (–$23M) showed deep negative leans, with Financials the standout at –71.8%, indicating broad liquidation.
Overall, the MOC opened with a sharp buy imbalance, held a directional tech-led bid, then transitioned into moderation as liquidity paired off into the close.
Technical Edge
Fair Values for December 1, 2025:
SP: 10.77
NQ: 45.84
Dow: 38.16
Daily Breadth Data 📊
For Friday, November 28, 2025
NYSE Breadth: 71.7% Upside Volume
Nasdaq Breadth: 68.9% Upside Volume
Total Breadth: 70.2% Upside Volume
NYSE Advance/Decline: 65.0% Advance
Nasdaq Advance/Decline: 64.9% Advance
Total Advance/Decline: 65.0% Advance
NYSE New Highs/New Lows: 106 / 5
Nasdaq New Highs/New Lows: 178 / 47
NYSE TRIN: 0.52
Nasdaq TRIN: 0.80
Weekly Breadth Data 📈
For Week Ending November 28, 2025
• NYSE Breadth: 43% Upside Volume
• Nasdaq Breadth: 46% Upside Volume
• Total Breadth: 45% Upside Volume
• NYSE Advance/Decline: 33% Advance
• Nasdaq Advance/Decline: 34% Advance
• Total Advance/Decline: 33% Advance
• NYSE New Highs/New Lows: 115 / 282
• Nasdaq New Highs/New Lows: 236 / 787
• NYSE TRIN: 0.63
• Nasdaq TRIN: 0.60
BTS Levels - (Premium Only)

Calendars
Today’s Economic Calendar
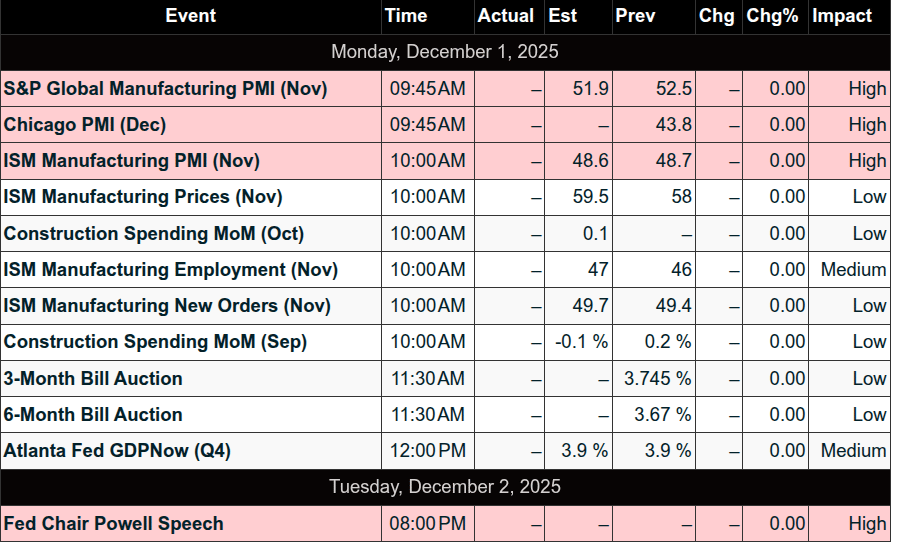
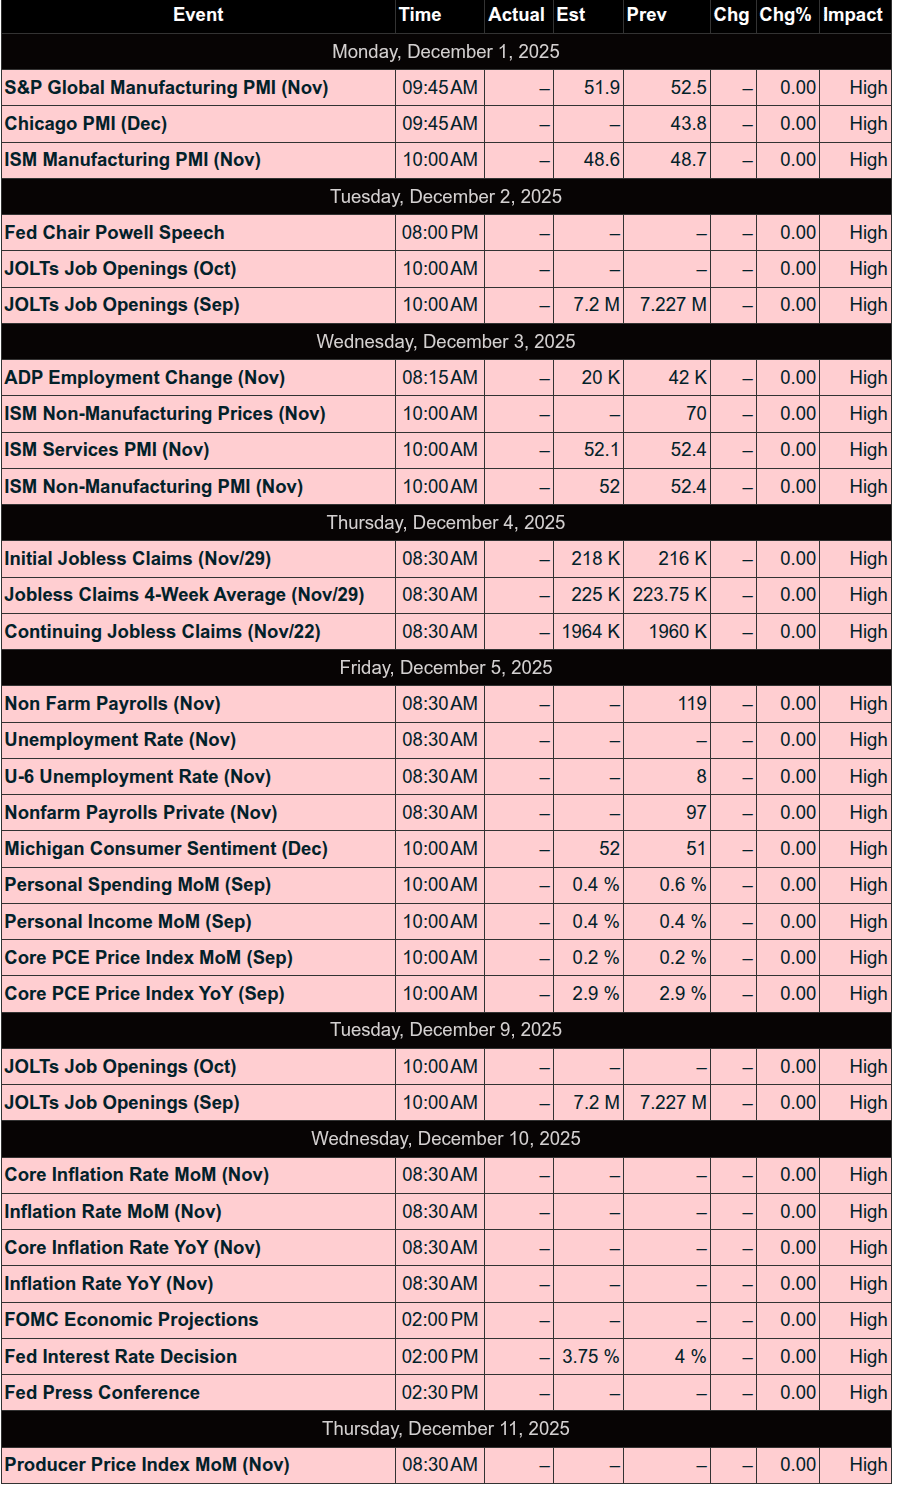
This Week’s Important Economic Events
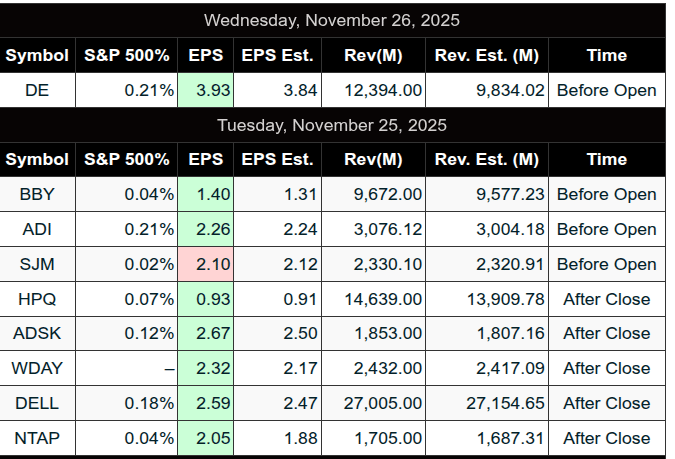
Upcoming Earnings
Recent Earnings