- The Opening Print
- Posts
- Gold Gets Dumped, Crude Gets Love — Meanwhile Witching Hour Looms
Gold Gets Dumped, Crude Gets Love — Meanwhile Witching Hour Looms
Follow @MrTopStep on Twitter and please share if you find our work valuable!
Our View
Other than missing some of the constant headlines, I'm not sure there's much else to talk about. The only real focus is the 'mega' March Quad Witching expiration, which we all know will add to the already volatile trading environment.
In most cases, quarterly expirations tend to see big volume prints on the open. They usually stay busy for the first hour and a half and again in the last hour. I doubt the session can go without some market-moving headlines in between.
Our Lean
There were more rotations out of stocks and gold and into oil yesterday. A friend who trades crypto and had me take time to sell some very old gold coins and gold was shocked at the "spread" between where spot gold was trading on Thursday (which was above $4,900) and what they were offering (which was around $4,100).
When I mentioned that gold had been down 5 out of the last 6 days, I noted that traders long gold were selling and buying crude. Yesterday, it was down another -5.93%.
Below is a 5-day comparison chart of the rotation out of gold and into crude oil.
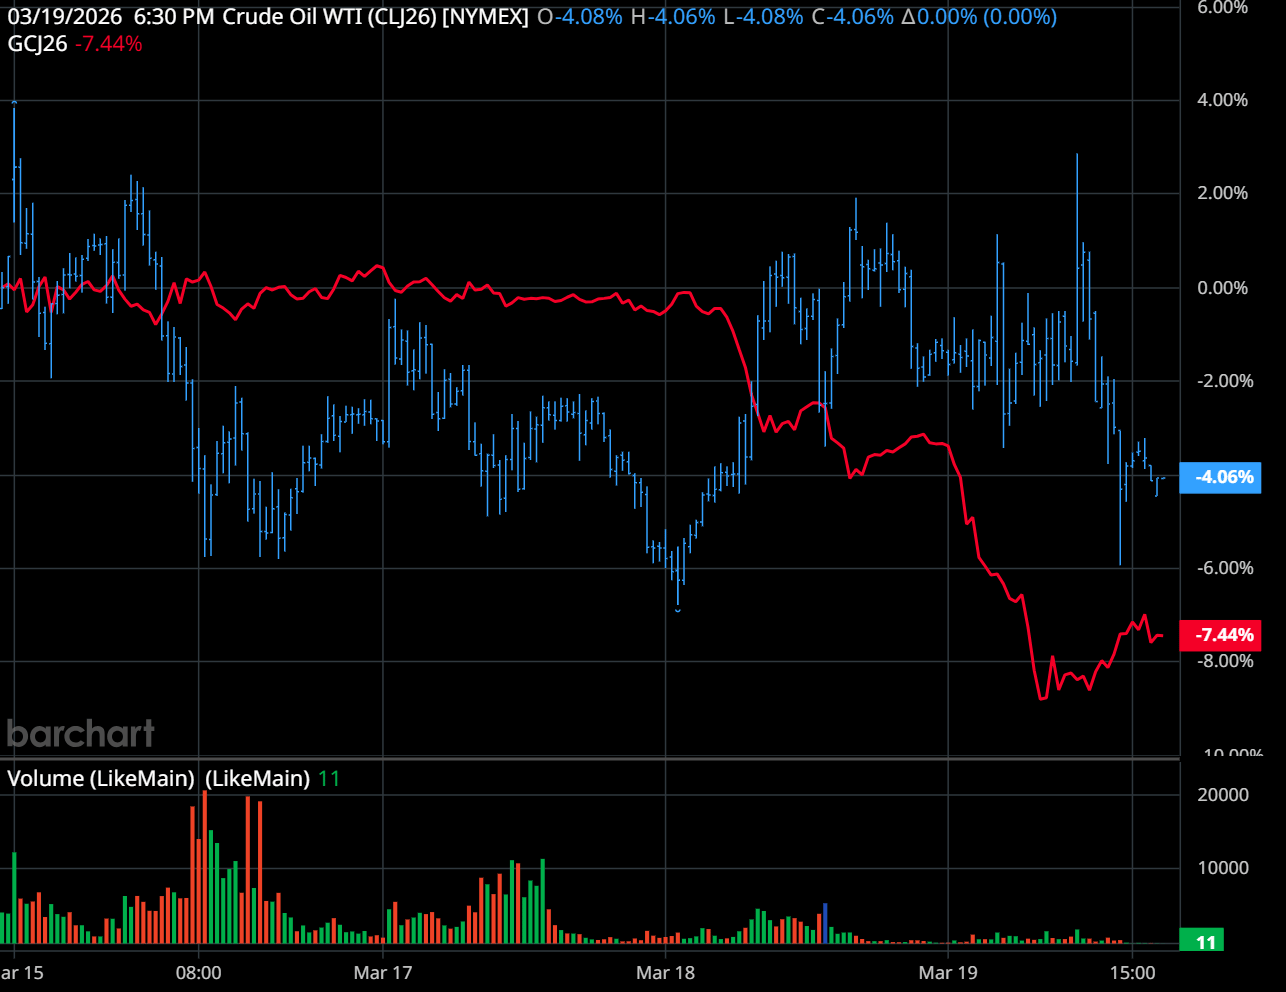
Our Lean: expect the unexpected today. That means we could see big swings in both directions.
I asked Grok what to expect for today's record quarterly quad witching, and this is what it said:
Quadruple (or triple) witching days, like today's event, typically drive elevated trading volume. Traders, institutions, and market makers close, roll over, unwind, or hedge expiring stock index futures, options, single-stock options, and related contracts. This often leads to higher-than-normal activity.
It can also bring increased volatility, especially in the final "witching hour" from 3:00–4:00 PM ET. Sharp price swings, potential pinning near key option strikes or max pain levels, and erratic moves from gamma hedging unwinds are all common. Though there's no inherent directional bias, outcomes depend more on mechanics than fundamentals. Markets can close higher, lower, or flat.
For today specifically, this coincides with spring portfolio rebalancing and S&P 500 changes amid the ongoing US-Israel-Iran war (now ~20+ days in, with high oil prices around $118/barrel, inflation worries, and risk-off sentiment). Analysts from Bloomberg, Morningstar, Wedbush, and others warn of a potentially "wild" or "doozy" session. That includes choppy trading, amplified volatility from the large expiry (estimates around $5.7–6.4 trillion notional), possible squeezes in heavily optioned names, and extra sensitivity to any breaking news like war updates, Fed signals, or energy developments. Traders often advise caution with tighter risk management.
As I said, big volume prints on the open and close. It is usually busy for the first and last hour, with big moves in both directions. Adding to the quad expiration will be the non-stop headlines out of the Middle East.
I have no idea where SpotGamma came up with the ES 6500 and 6350 levels, but as you know, I put this out last week. It doesn't matter to me, but the levels align with what I was thinking about when I looked at the ES chart and said there was no support under 6500.
I am going to end this by saying the same thing: the dead cat bounces continue to get sold. I believe they will again today, and there should be further risk-off going into the weekend.
Keep an eye on crude oil and gold. If they reverse today, the ES could get bid up, but even if it does, that doesn't make me bullish. Lastly, they say retail traders have been getting killed. I'm not sure why unless they are not using stops and are buying into the rips, but that doesn't make sense to me because everyone is seeing the same thing.
We have been partners with SpotGamma pretty much from the beginning, and I think they are one of, if not the best, options firm on the street. This is the link to Brent’s live video he did on March 18th: https://www.youtube.com/watch?v=k8WGHTblyjM
March OPEX (Options Expiration) Live with Brent Kochuba | SpotGamma

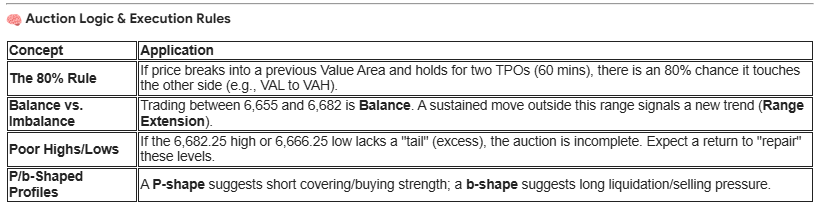
Claude Ai Market Profile Technical Levels: ESM26
Current State: In Balance (Range: 6,655 – 6,682)
Current State: In Balance (Range: 6,655 – 6,682)
Upper Resistance: Supply & Auction Rejections
6,782.67 (Pivot R3): Extreme Extension; exhaustion territory.
6,743.41 (Structural Wall): 9-Day Moving Average & High-Volume Node (HVN).
6,713.27 (VAH Estimate): The Value Area High; the ceiling of "Fair Value."
6,699.42 (Pivot R1): Potential Single Print start; area of aggressive selling/imbalance.
6,682.25 (Session High/IBH): Initial Balance High. If there is no sharp rejection here, it is a Poor High (unfinished business).
The Equilibrium (The Magnet)
6,671.00 (POC): The Point of Control. This is the "fairest price" with the most TPOs. Think of this as the session's gravity.
Lower Support: Demand & Value Transitions
6,666.25 (Session Low/IBL): Initial Balance Low. Watch for Excess (buying tails) here to confirm floor strength.
6,660.00 (nPOC): Naked POC. An untouched level from a prior session; a primary downside magnet.
6,655.58 (VAL / Pivot): Value Area Low. The floor of the current auction.
6,634.50 (Target/LVN): Low Volume Node. Expect "thin" trading and fast movement through this zone.
6,611.75 (Structural Floor): Multi-day support and 13-week low.
6,532.92 (Pivot S3): Major Demand Zone.
Current Execution Summary
Above 6,671 (POC): Buyers are in control. Targets are 6,682 (IBH) and 6,713 (VAH).
Below 6,671 (POC): Sellers are in control. Targets are 6,660 (nPOC) and 6,655 (VAL).

Join our trader Niels Koops live today on our PitbullTraders channel. He'll be demonstrating how he successfully trades the opens using his unique DeltaTraderapp. The show begins at noon ET—grab some lunch and join the event!
Guest Posts:
 |
Get instant access to our partners’ real-time market data and insights not available anywhere else. Here is last night's Founder’s note getting you ready for today’s market and explaining the constraints in yesterday’s market. - MrTopStep
The stock market pared some losses as oil pulled back from its highs. WTI traded at $94 and Brent at $104 at the time of writing. Gold and silver prices declined amid market volatility, with spot gold bouncing near the $4,500 level.
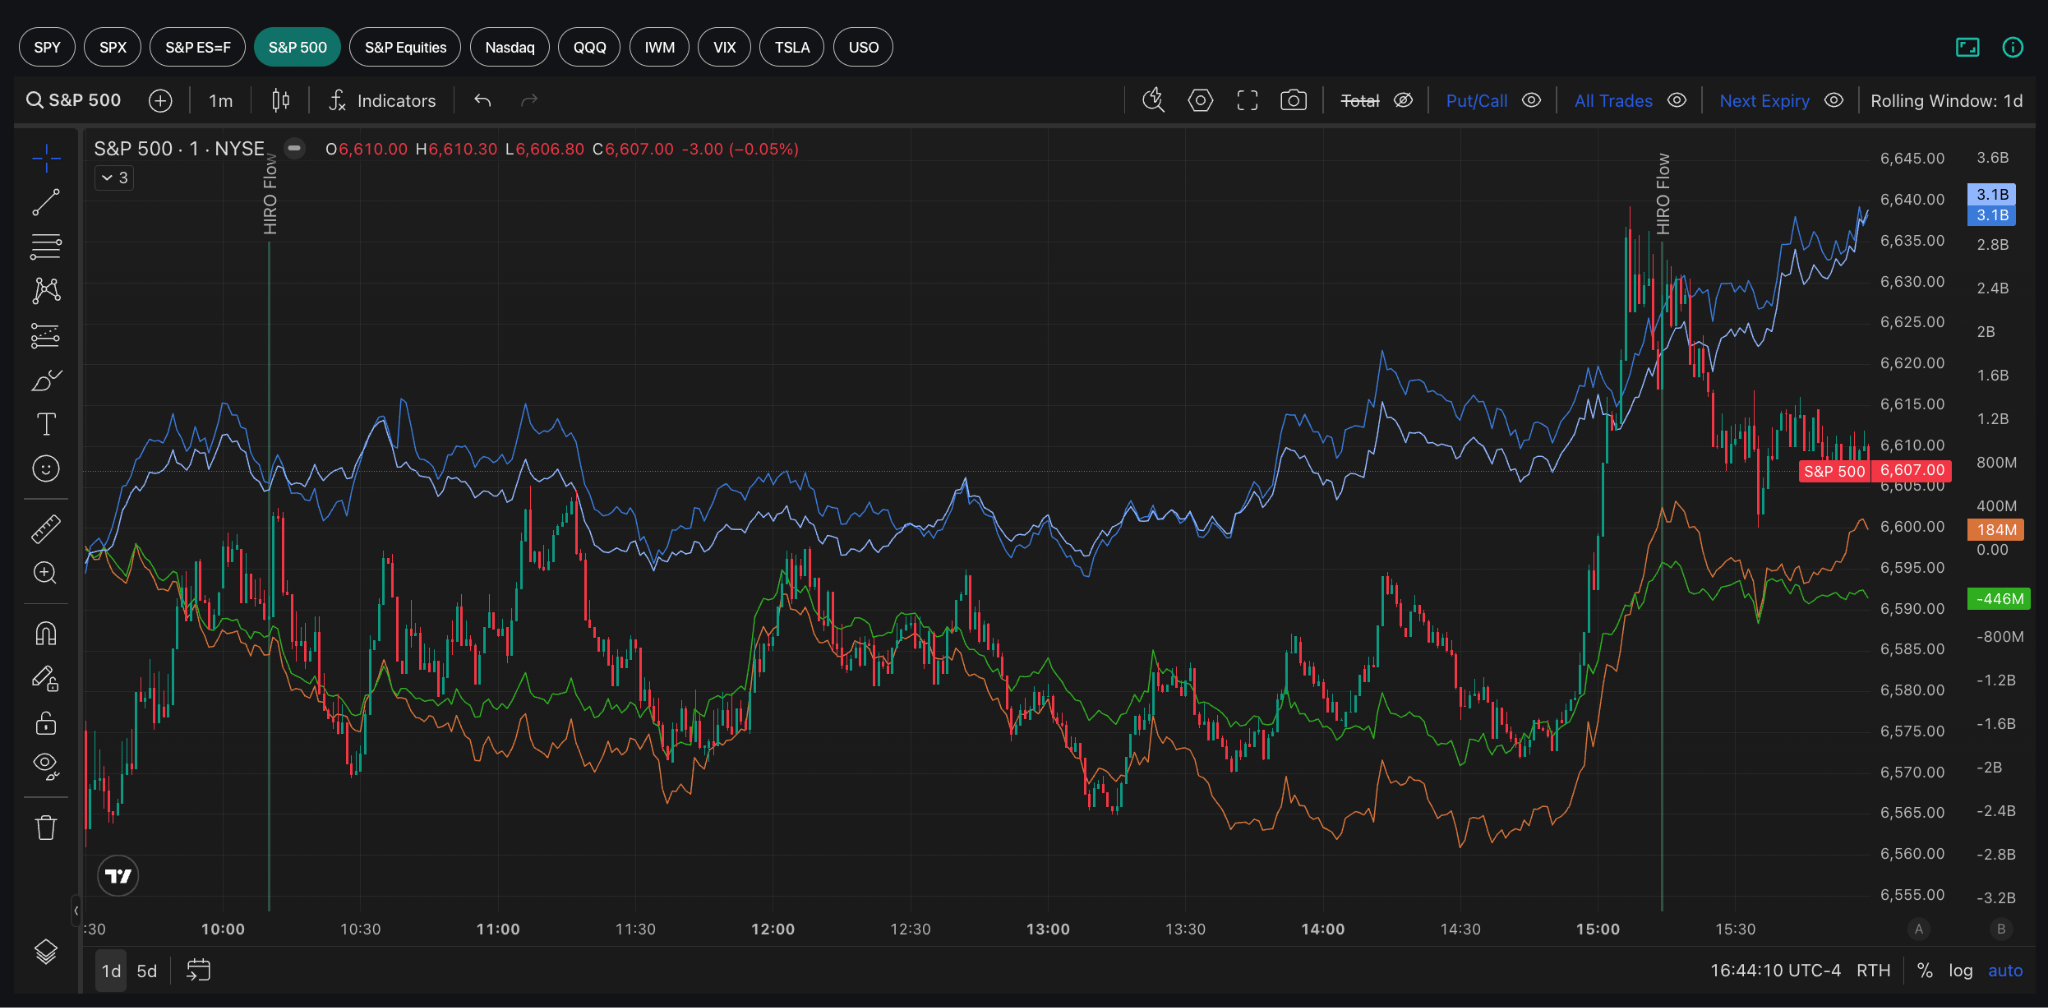
SPX closed at 6,607 (-0.28%), above the Put Wall at 6,500. QQQ showed relative weakness and closed at 593 (-0.32%), above its Put Wall at 590. IWM showed relative strength and closed at 248 (+0.65%), also above the Put Wall of 240.
The volatility complex reset lower on the day. VIX closed at 24.05 (-4.11%), while VVIX closed at 108.09 (-6.65%).
As noted in the AM Note, “negative gamma all over means that dealers should be chasing prices both higher and lower, which should exacerbate volatility.” That’s exactly why we see some big intraday movement. It’s also notable that the 0DTE put sellers around 6,530 provided support of the day, as we see HIRO flows stalled when price hit that zone.
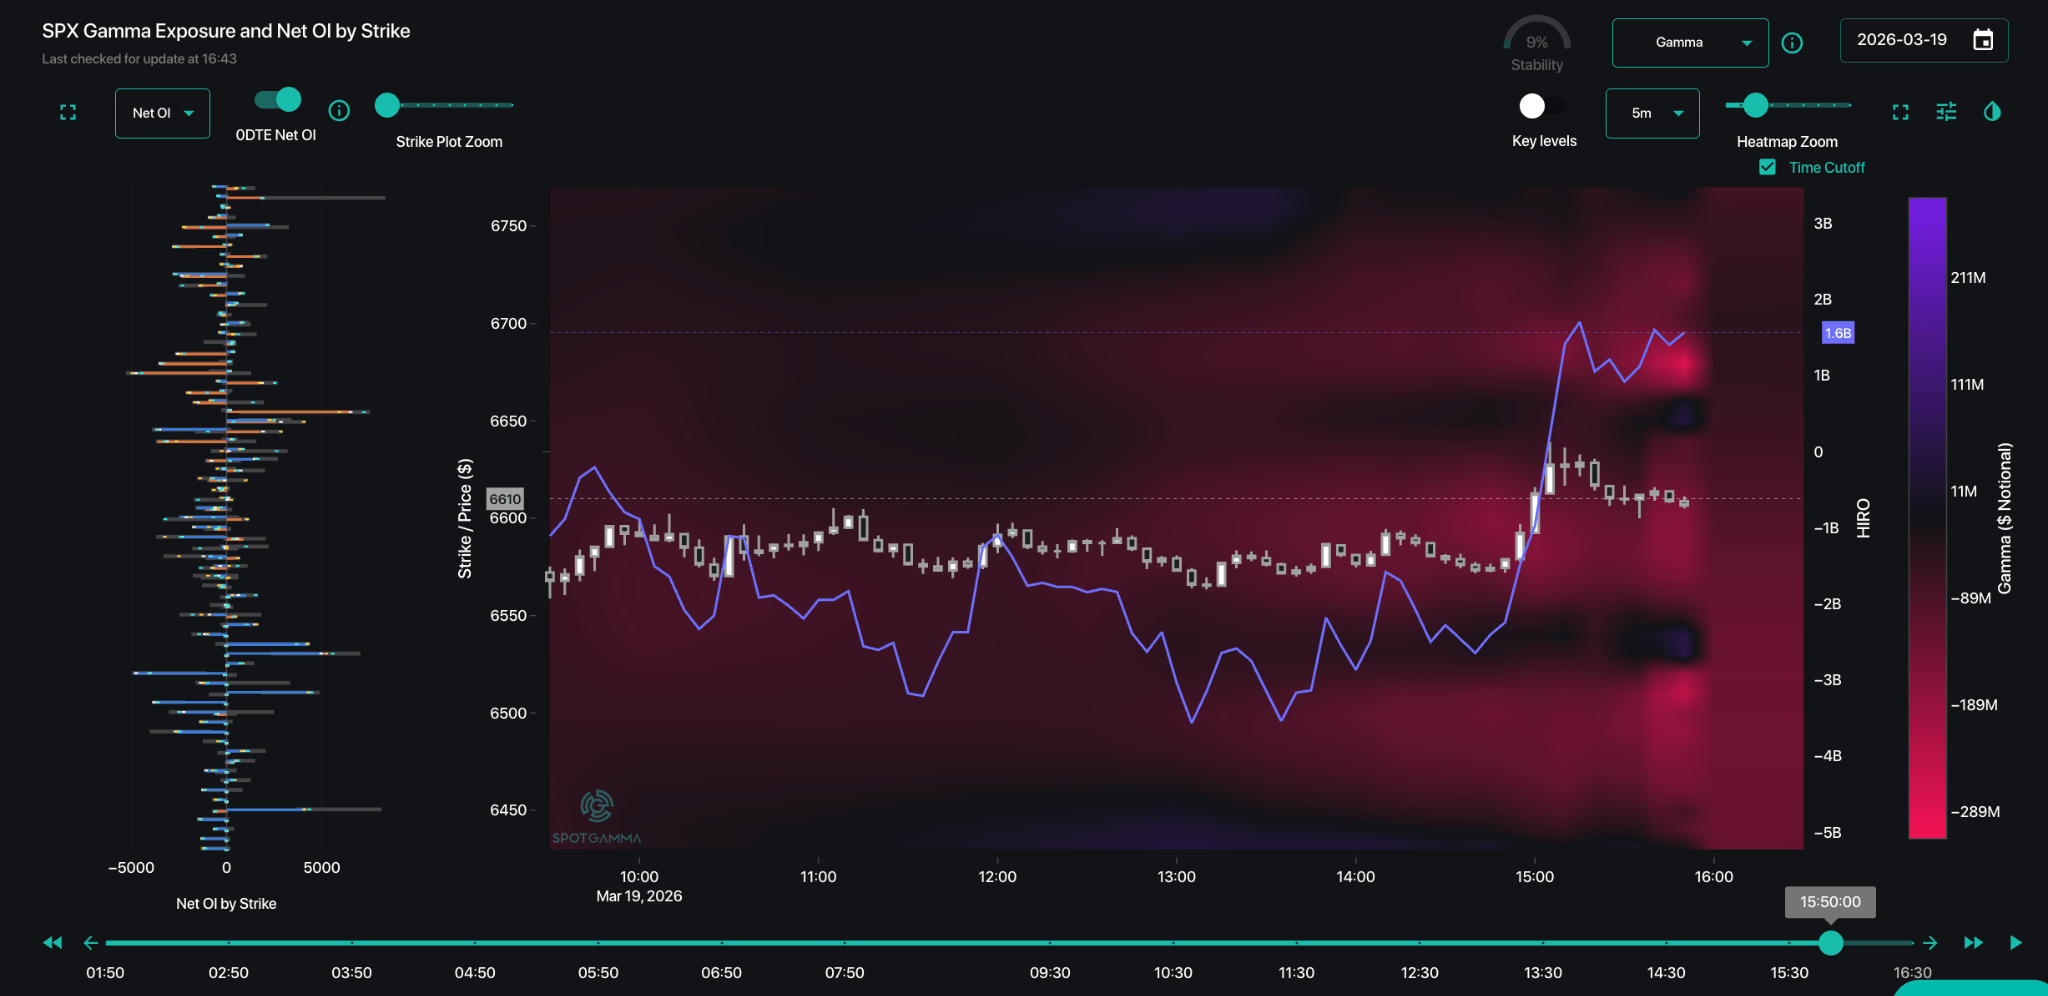
S&P 500 HIRO showed approximately +$2B in net delta on the day, driven primarily by ~$3B of 0DTE put selling (light blue line). These short-dated volatility sellers injected positive delta into the market, requiring dealers to buy underlying as their hedging flows.
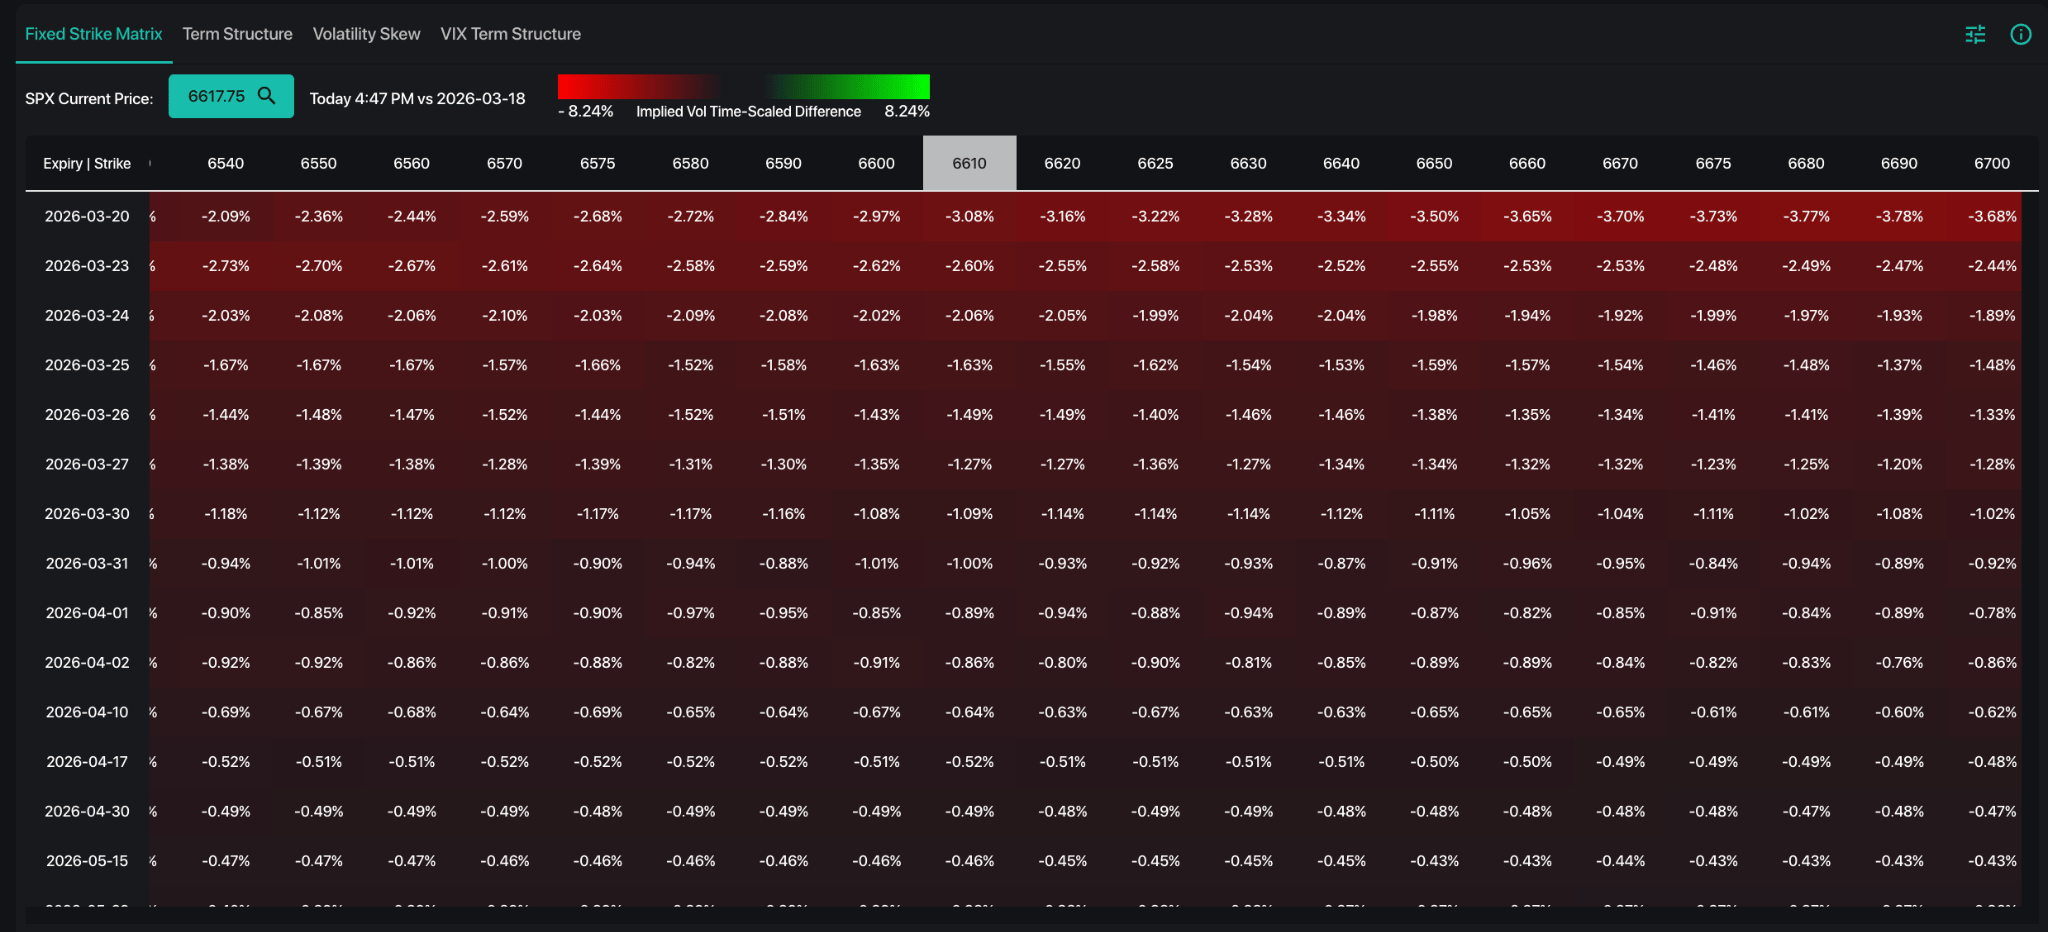
Fixed strike vols leaked lower across the board, especially the short dated ones (<=3DTE) down 2-3 vol points on the day. The “spot down, vol down” dynamic suggests that short-dated hedges were monetized, as the hedgers’ put delta decayed further. While market makers positioning implied net buying pressure, other market participants were net sellers.
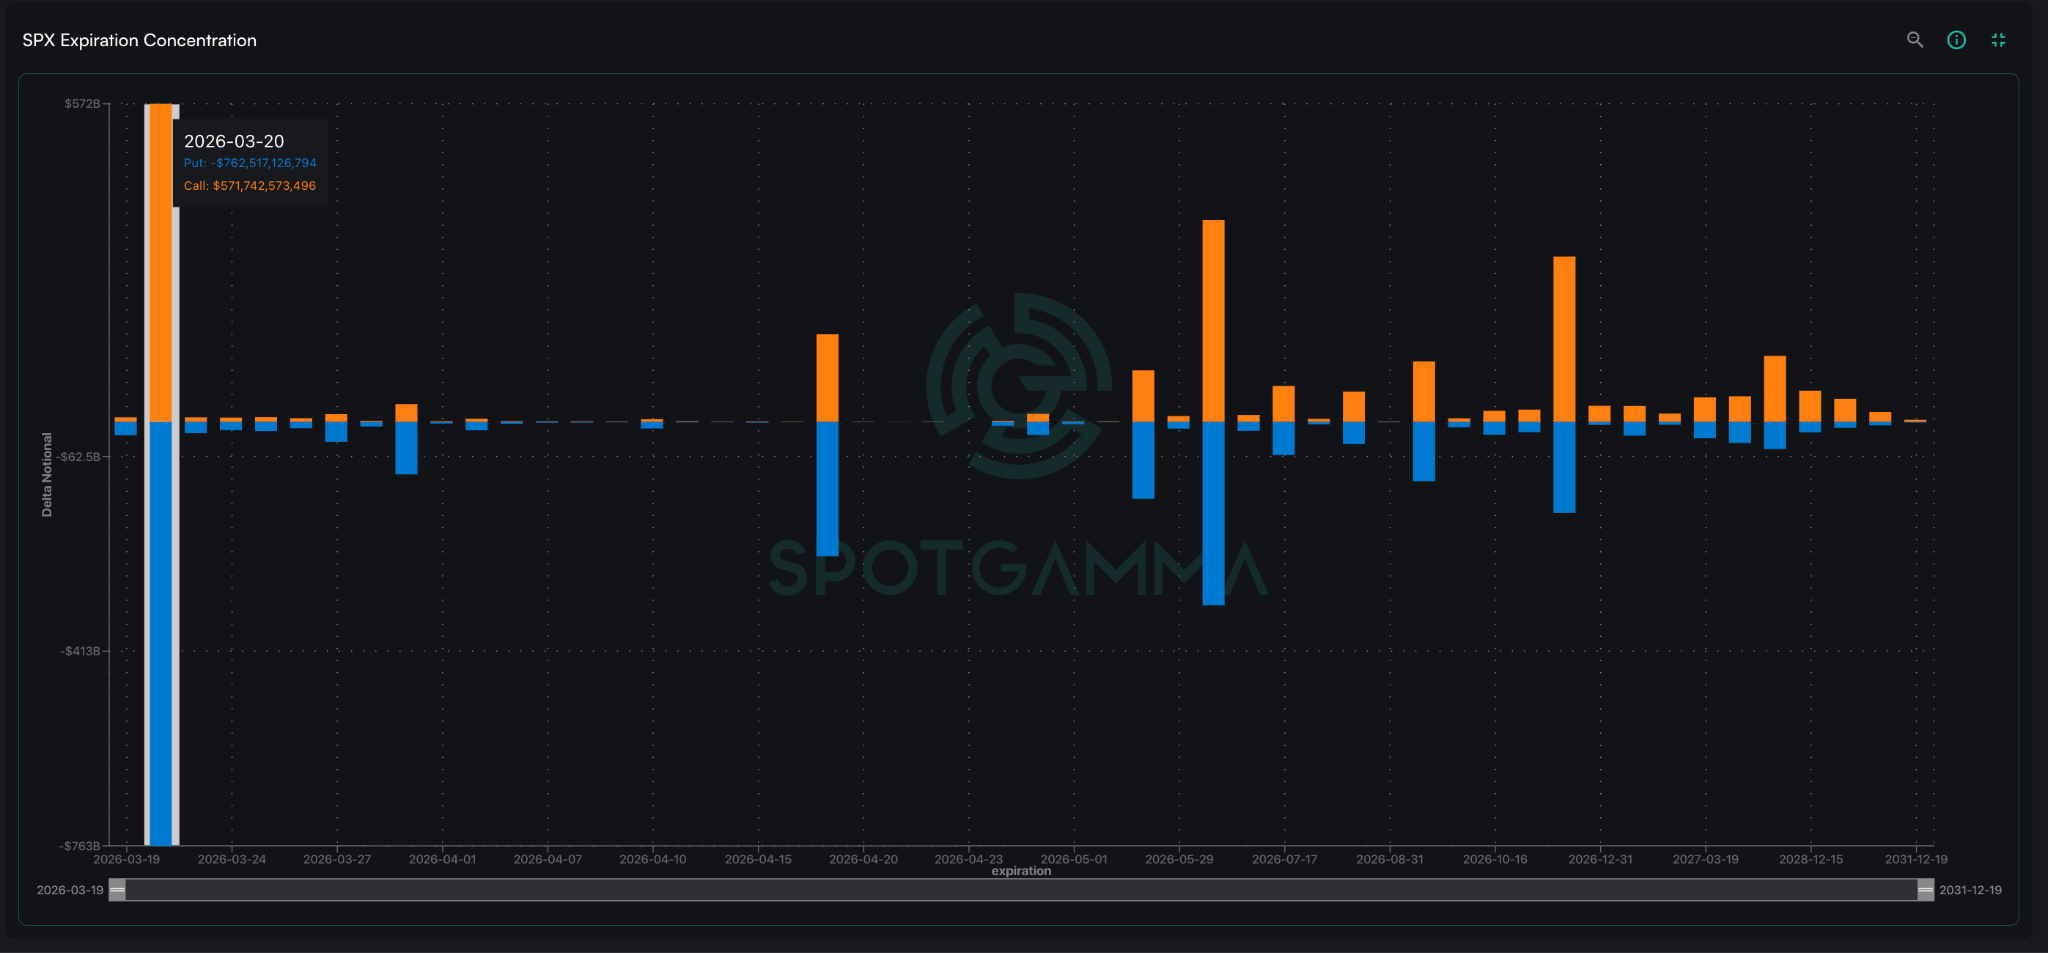
Tomorrow is March Triple Witching OPEX, where a large amount of index options, single stock options, and futures will expire. This expiration is notably larger than recent ones and may have an outsized impact on market dynamics. From a delta notional perspective, approximately $763B in puts (57%) and $572B in calls (43%) are set to expire, indicating a slightly higher concentration in puts.
Notable flows of the day:
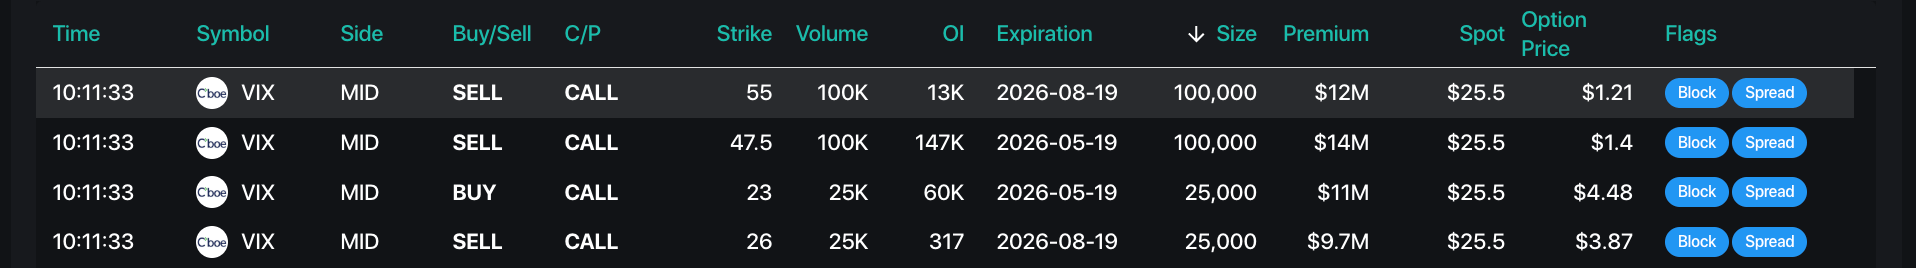
We observed short VIX call activity, with 100k contracts of VIX August 55 calls sold at $1.21 around 10:11am ET. This size exceeded existing open interest, and VIX moved lower following the trade.
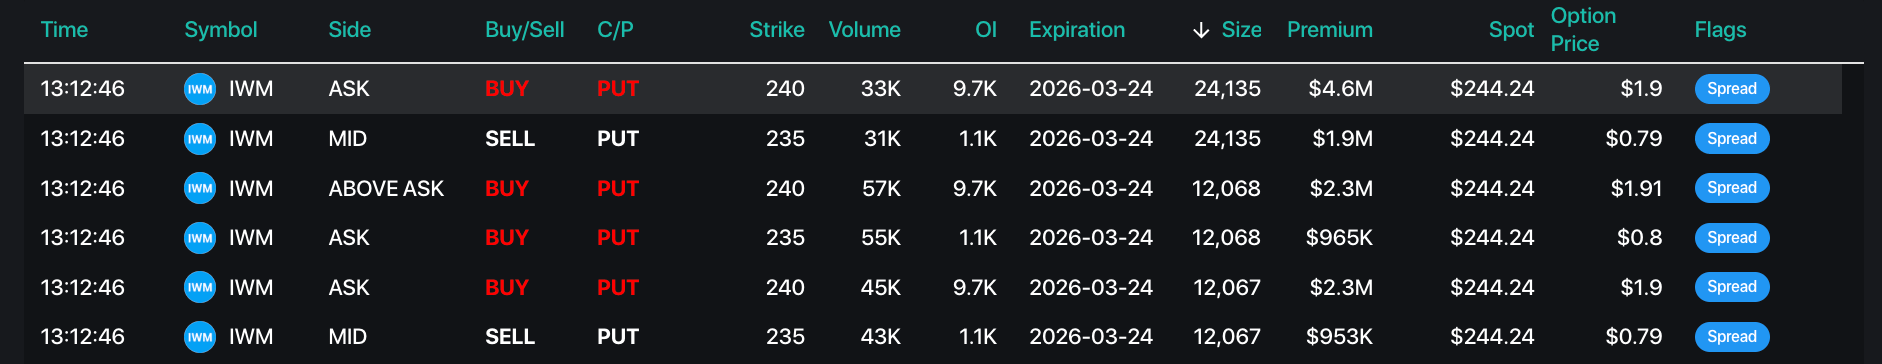
Bearish IWM flow was also notable, potentially tied to shifting rate expectations following the FOMC. Approximately 48k contracts of the IWM March 24th 235/240 put spread traded for $1.10, with size exceeding existing open interest.
Founder's Note:
All TenTen Capital LLC DBA SpotGamma materials, information, and presentations are for educational purposes only and should not be considered specific investment advice nor recommendations. Futures, foreign currency and options trading contains substantial risk and is not for every investor. An investor could potentially lose all or more than the initial investment. Risk capital is money that can be lost without jeopardizing one's financial security or lifestyle. Only risk capital should be used for trading and only those with sufficient risk capital should consider trading. Past performance is not necessarily indicative of future results. VIEW FULL RISK DISCLOSURE https://spotgamma.com/model-faq/disclaimer/
Market Recap
It was another night of bombs across the energy complex in the Middle East. The ES made a high at 6632.00, sold off down to 6618.75 at 9:15, and then this headline hit: NEW: UK, France, Germany, Italy, the Netherlands, and Japan joint statement on Strait of Hormuz—"We express our readiness to contribute to appropriate efforts to ensure safe passage through the Strait. We welcome the commitment of nations who are engaging in preparatory planning." The ES rallied up to 6646.25 at 9:20 and opened Thursday's regular session at 6629.25, down 48 points or -0.72%.
After the open, the ES sold off down to 6611.75 and then rallied up to 6655.50 at 10:10, before selling off down to 6620.75 at 10:20. The ES rallied again up to 6651.50 at 10:35, and then pushed higher to 6658.25 at 11:05. It sold off down to 6622.00 at 11:45, then rallied up to 6652.00 at 12:05, sold off again to 6631.75 at 12:20, before rallying up to 6648.00 at 12:40. It then sold off down to 6616.25 at 1:10.
The ES rallied up to 6639.50, dropped to 6627.00, and then a bunch of headlines hit the tape: [3:03 PM]: US AUTHORIZES DELIVERY, SALE OF CRUDE OIL FROM RUSSIA and Russia-Ukraine talks to resume on Saturday.
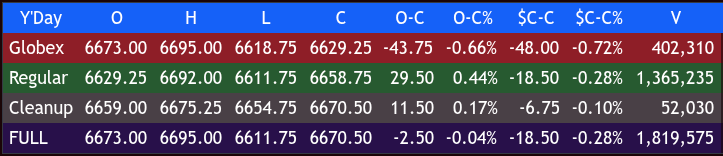
The ES rallied 65 points up to 6692.00, sold off 40.50 points down to 6651.50 at 3:35, rallied back up to 6668.75 at 3:43, and traded 6661.75 as the 3:50 cash imbalance showed $420 million to sell, sold off down to 6654.75, and traded 6658.75 on the 4:00 cash close.
After 4:00, the ES rallied up to 6675.25 and settled at 6660.00, down 17 points or -0.25%. The NQ settled at 24,580, down 71.25 or -0.29%; the YM settled at 46,341, down 194 points or -0.42%; and the RTY settled at 2512.10, up 16.60 points or +0.67% on the day.
In the end, the 'mish mash' of headlines continues. In terms of the ES's overall tone, it was weak and made new lows for the move, but didn't go without a few rips. In terms of the ES's overall trade, volume was high at 1.987 million contracts traded.
Stocks declined, and Brent crude pulled back after trading up to $119; global bond yields rose as a surge in energy prices, fueled by Middle Eastern conflict, intensified inflation fears, with the 10-year Treasury reaching 4.281% and the 2-year hitting 3.83%. This volatility caused gold to tumble and European and Asian stocks to decline, wiping out the Stoxx Europe 600's yearly gains.
While the Federal Reserve and other major central banks held rates steady, policymakers warned they are prepared to hike rates further if the geopolitical instability persists. It's FRYday, and the Middle East war has been raging for 20 days. Israel admitted that the US was not told it was going to attack Iranian oil infrastructure, and Pakistan, which has a NATO-style agreement with Saudi Arabia that if one is attacked, it's an attack on both, remains in the mix.
MiM
Market-On-Close Recap
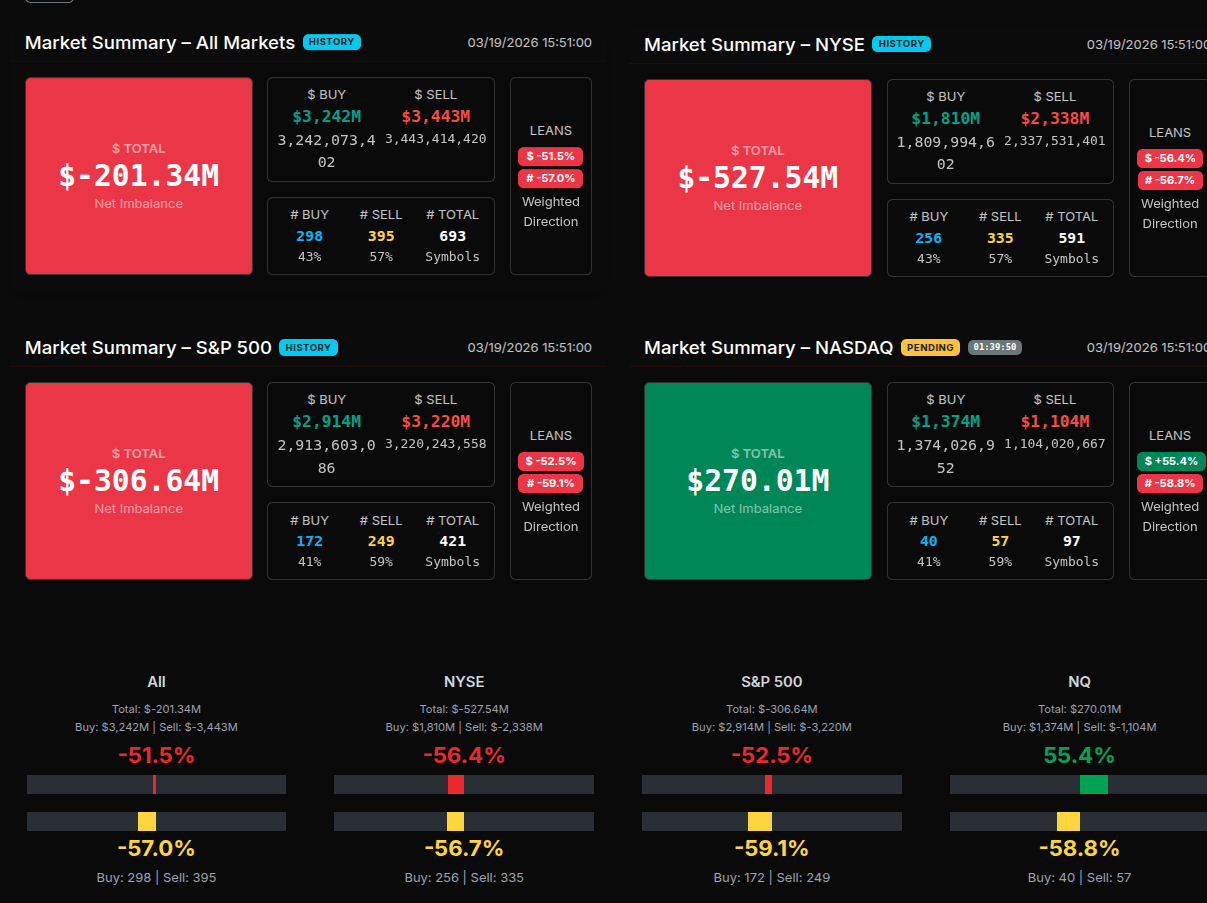
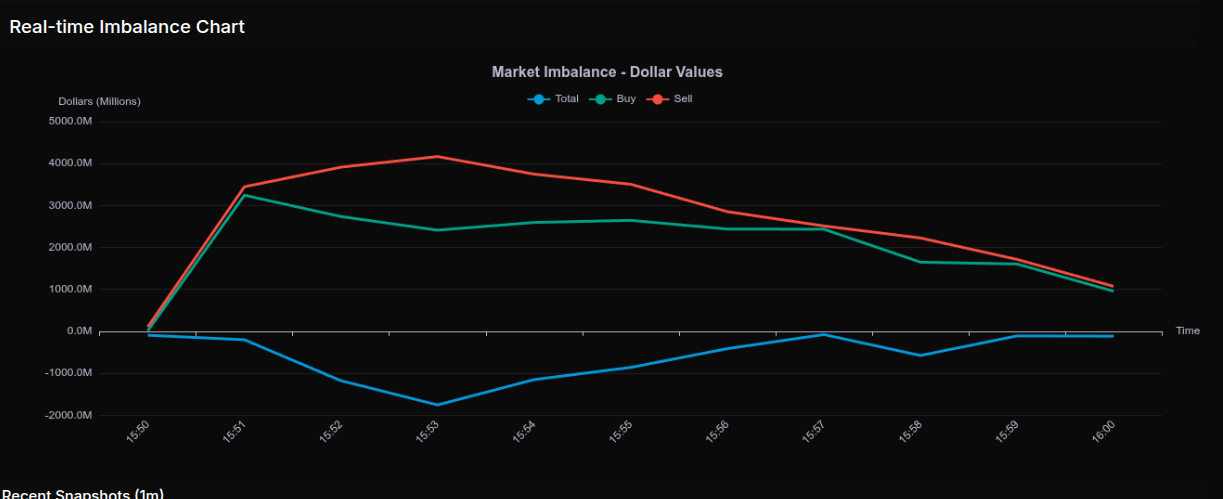
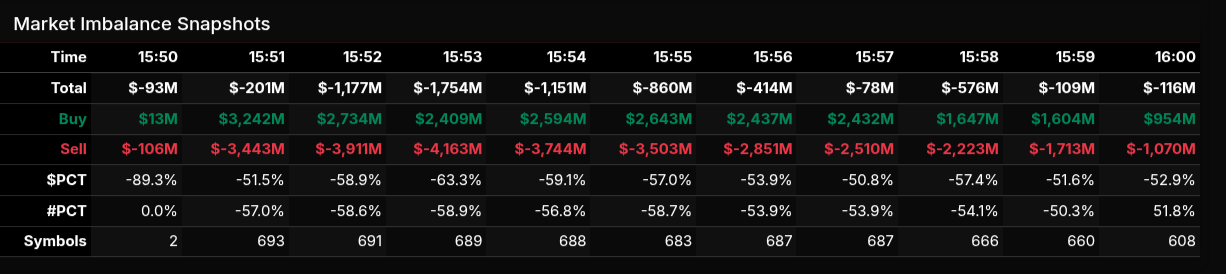
The MOC session developed with a clear sell-side tone that intensified quickly after the initial imbalance prints. At 15:50, the market opened modestly negative at -$93M, but within one minute expanded aggressively to -$1.17B and ultimately bottomed near -$1.75B by 15:53. This early expansion established a decisive sell program, with $PCT readings pushing as low as -63.3%, indicating broad and directional institutional supply rather than rotational flow.
From there, the auction stabilized but remained persistently offered. Sell pressure steadily moderated into the close, finishing around -$116M, but never flipped into sustained buy territory. The trajectory shows a classic “peak imbalance then bleed” profile, where early MOC urgency fades, but underlying bias remains intact.
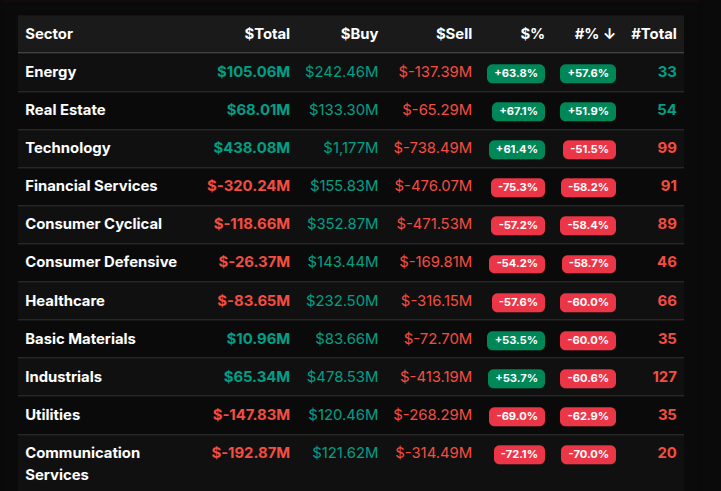
Sector flows confirmed this sell-side dominance. Financials (-75.3%), Communication Services (-72.1%), and Utilities (-69.0%) all registered extreme negative leans, signaling wholesale distribution rather than two-way trade. These sectors drove the directional character of the close. Consumer Cyclical (-57.2%), Healthcare (-57.6%), and Consumer Defensive (-54.2%) added broad participation to the sell program.
On the buy side, Energy (+63.8%), Real Estate (+67.1%), and Technology (+61.4%) showed relative demand, though notably none exceeded the +66% threshold in a meaningful way except Real Estate, suggesting less conviction compared to the sell-side pressure.
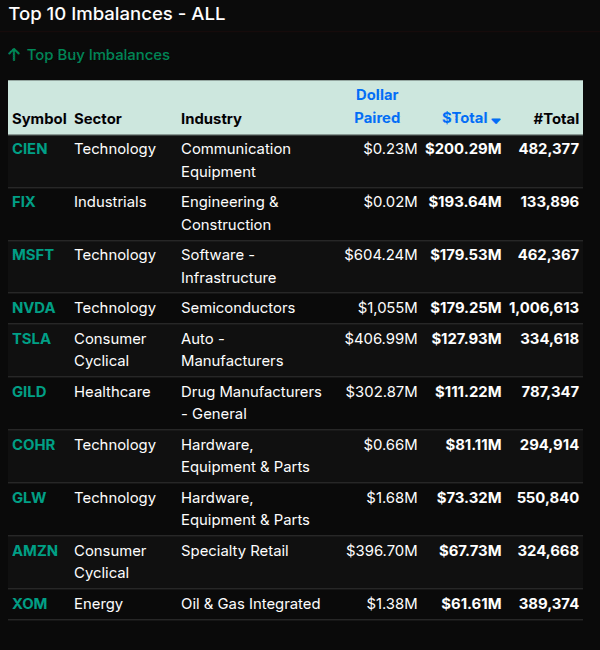
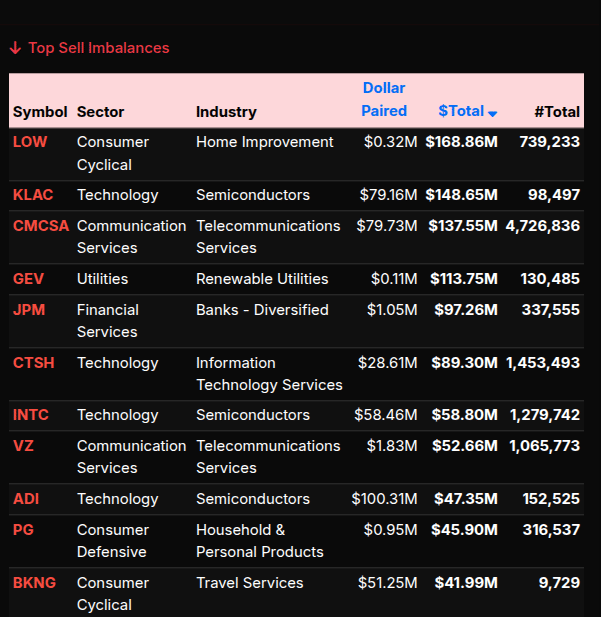
At the single-name level, sell imbalances were led by LOW ($168M), KLAC ($148M), and CMCSA ($137M), with strong representation from Technology and Communication Services. Meanwhile, buy imbalances were concentrated in selective Tech and Industrial names, including CIEN ($200M), MSFT ($179M), and NVDA ($179M), alongside TSLA ($127M). This reflects a bifurcated tape where index-level selling coexisted with targeted accumulation.
Index summaries reinforced the theme: NYSE (-56.4%) and S&P (-52.5%) leaned heavily sell-side, while Nasdaq showed a notable divergence with a +55.4% buy skew. This divergence highlights internal rotation beneath a broadly negative closing auction, rather than a uniform risk-off event.
BTS Trading Levels - (Premium Only)
oin our trader Niels Koops live today on our PitbullTraders channel. He'll be demonstrating how he successfully trades the opens using his unique DeltaTrader app. The show begins at noon ET—grab some lunch and join the event!
ES Levels
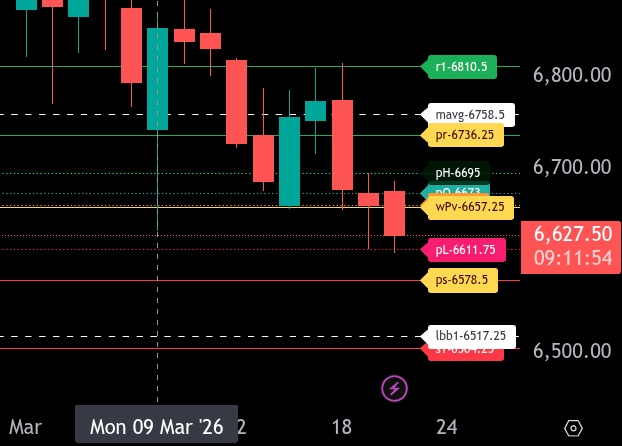
The bull/bear line for the ES is at 6657.25. This remains the key pivot for today’s session. Acceptance below this level keeps the market in a bearish posture, while reclaiming it is required to shift momentum back to the upside.
Currently, ES is trading around 6628.00 during the Globex session, holding below the bull/bear line and showing continued weakness. As long as price remains below 6657.25, sellers are in control and we look for continuation lower.
On the downside, immediate support comes in at 6611.75, which aligns with recent price lows. A break below this level opens the door to 6578.50, our lower range target for today. If selling accelerates through 6578.50, further downside extension toward 6517.25 and 6504.25 becomes possible.
On the upside, resistance is first seen back at 6657.25. If bulls can reclaim and hold above this level, we can look for a push into 6673.00 and then 6695.00. Beyond that, the key upside objective sits at 6736.25, which is the upper range target for today.
Overall, the market remains bearish below 6657.25, and rallies into resistance are likely to be sold unless buyers can establish acceptance back above the pivot. A sustained move above 6657.25 would be the first sign of strength and could shift the intraday tone back toward balance or rotation higher.
NQ Levels
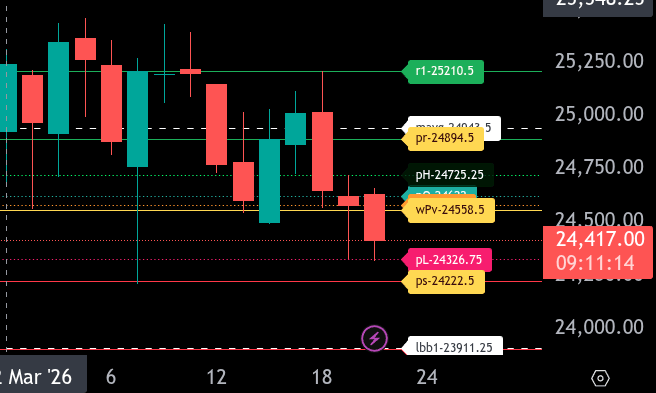
The bull/bear line for the NQ is at 24558.50. This is the key level that will determine directional control for today’s session. Acceptance above this level shifts momentum back to the upside, while continued trade below keeps the market in a bearish posture.
Currently, NQ is trading around 24418.75 during the Globex session, firmly below the bull/bear line. This confirms early weakness and suggests sellers remain in control unless price can reclaim 24558.50.
On the downside, immediate support comes in at 24326.75, followed by 24222.50, which is the lower range target for today. A break and acceptance below 24222.50 opens the door for an extension lower toward 23911.25. If selling accelerates, this becomes a key magnet level.
On the upside, resistance begins at 24558.50. If bulls can reclaim and hold this level, look for a move into 24622.00 and then 24725.25. Above that, 24894.50 stands as the upper range target for today. A sustained push through 24894.50 would indicate a stronger reversal attempt and shift in short-term structure.
Overall, the market is bearish below 24558.50, and rallies into resistance are likely to be sold unless that level is reclaimed and held. Traders should remain cautious of continuation to the downside while price remains below the bull/bear line.
Technical Edge
Fair Values for March 20, 2026
SP: 50.29
NQ: 215.72
Dow: 288.91
Daily Breadth Data 📊
For Thursday, March 19, 2026
• NYSE Breadth: 49% Upside Volume
• Nasdaq Breadth: 51% Upside Volume
• Total Breadth: 50% Upside Volume
• NYSE Advance/Decline: 43% Advance
• Nasdaq Advance/Decline: 46% Advance
• Total Advance/Decline: 45% Advance
• NYSE New Highs/New Lows: 79 / 175
• Nasdaq New Highs/New Lows: 54 / 388
• NYSE TRIN: 0.79
• Nasdaq TRIN: 0.83
Weekly Breadth Data 📈
Week Ending Friday, March 13, 2026
• NYSE Breadth: 42% Upside Volume
• Nasdaq Breadth: 54% Upside Volume
• Total Breadth: 49% Upside Volume
• NYSE Advance/Decline: 22% Advance
• Nasdaq Advance/Decline: 32% Advance
• Total Advance/Decline: 28% Advance
• NYSE New Highs/New Lows: 151 / 226
• Nasdaq New Highs/New Lows: 226 / 575
• NYSE TRIN: 0.39
• Nasdaq TRIN: 0.41
Calendars
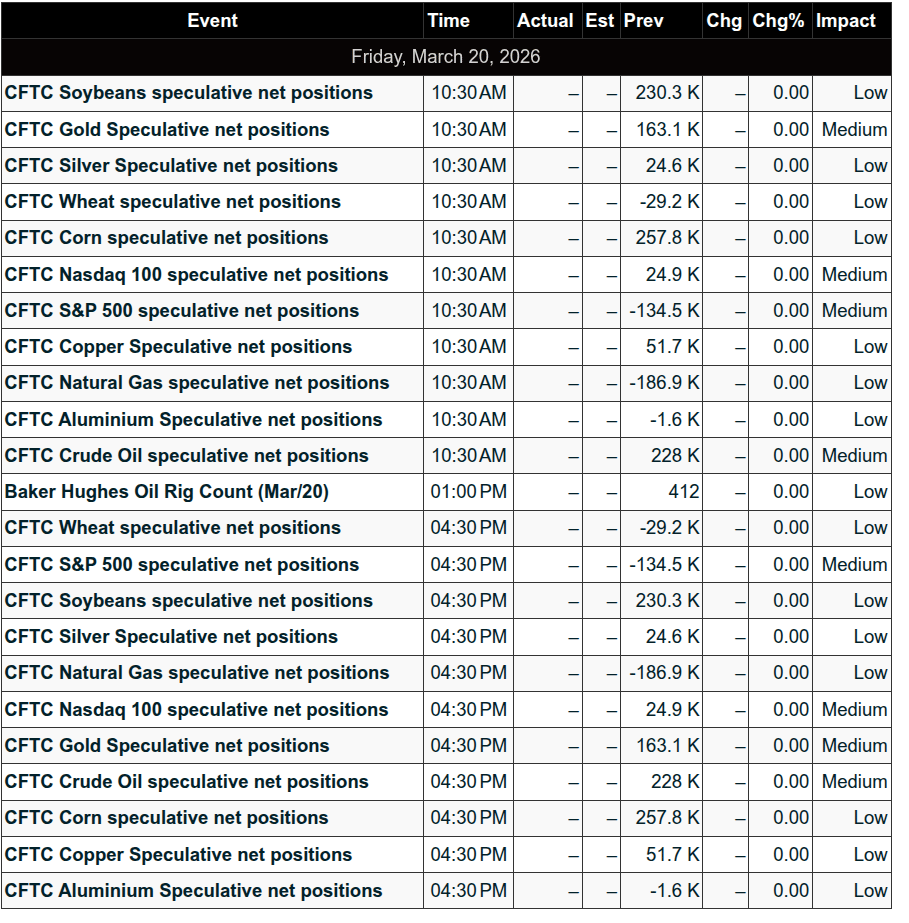
Economic Calendar Today
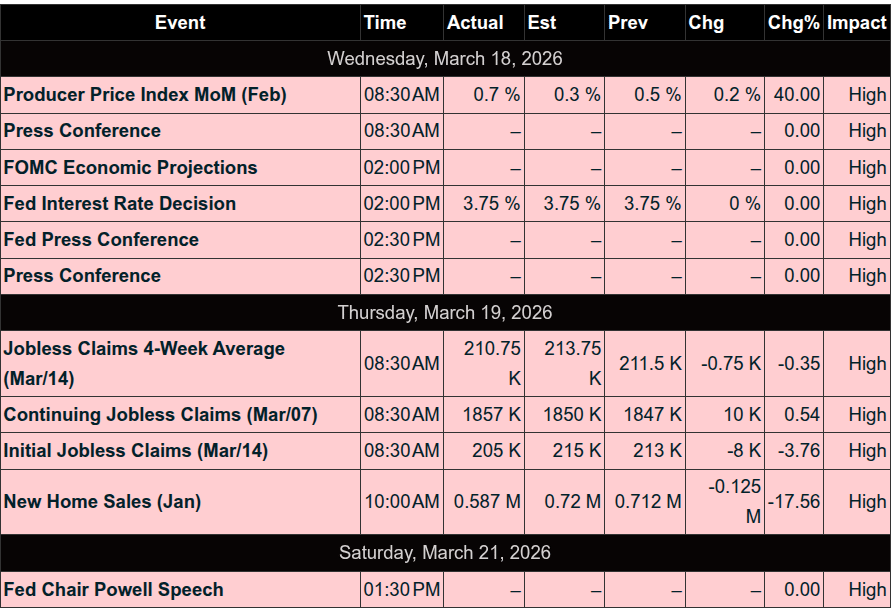
This Week’s High Importance
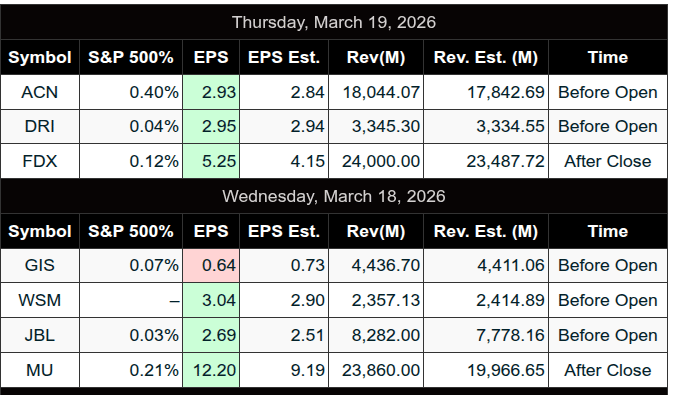
S&P 500 Earnings:
Upcoming:
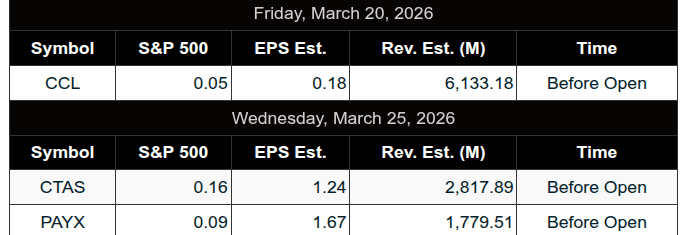
Recent:
Trading Room News:
Polaris Trading Group Summary - For Thursday, March 19, 2026
The session unfolded as a challenging but instructive Cycle Day 2 consolidation, with early chop followed by a strong late-day move that rewarded patience and structure awareness.
Morning – Choppy Open & Early Losses
The day began with price sitting near D-Level (~6633), with a clear line in the sand:
Bulls needed to reclaim 6654.50 (PL) to unlock higher potential.
At the open:
NQ and CL OR plays → stopped out
ES OR long triggered, but price action remained noisy and rotational
Key takeaway:
The open lacked clean follow-through, reinforcing that Cycle Day 2 environments often produce whipsaw conditions, especially near key levels.
Mid-Morning – Battle Around 6654
The entire session revolved around 6654 (PL):
Repeated emphasis: “Needs to clear and convert 6654”
Became the dynamic line in the sand
Traders adapted:
DanV executed a clean D-Level / Money Box DCA trade
Strong example of structured risk management and mechanical execution
Discussion around:
First pullbacks
Structure breaks
CCI confirmation
PeterN highlighted a failed A4 setup with retest entry idea
Key lesson:
Consistency in risk management > prediction
The traders who stayed mechanical handled the chop best.
Midday – Consolidation & Patience
Continued failure to accept above 6654
Market remained two-sided and rotational (typical pre–quad witching behavior)
Little edge unless trading level-to-level or fading extremes
Afternoon – The “Ripper” Move
Late in the day, the market finally resolved:
Sharp 40-point rally (“ripper”)
Likely driven by positioning + news catalysts
“Someone caught wrong-footed” → short covering fuel
This was the cleanest directional opportunity of the day
Key takeaway:
Patience paid
The best move came after extended consolidation, not during the open
Closing Context
MOC Sell: $1B
Day classified as:
Cycle Day 2
Range: 83 handles
Strong note:
Closing above 6654.50 (CD1 low) = win for bulls
Core Lessons from the Day
Respect Cycle Day context
CD2 = consolidation, not trend clarity early
Key levels matter
6654 acted as the decision point all day
Mechanical risk management wins
DanV’s approach highlighted the importance of consistency
Don’t force the open
Early OR failures showed lack of edge
Patience captures the real move
The afternoon ripper rewarded those who waited for confirmation
DTG Room Preview – Friday, March 20, 2026
Macro / Geopolitics
Focus remains on Middle East conflict driving global risk sentiment
US futures heading for 4th straight weekly decline; indexes nearing correction (Dow/Nasdaq ~-8%, SPX ~-5%)
Sentiment improved slightly after Israel support around Strait of Hormuz → oil pulled back (Brent -2%, WTI -1.3%)
$200B US-Iran war cost estimate causing political friction; implies prolonged engagement
Conflict disrupting fertilizer + energy flows → renewed global inflation risk, especially in emerging markets
Inflation / Commodities
Strait of Hormuz critical: ~30% of global fertilizer trade at risk
65–70% of global urea supply exposed → potential hit to food supply chain (grains, livestock, dairy, meat)
Inflation pressure likely to reaccelerate via food + energy (25% of DM CPI, up to 50% in EM)
Metals
Gold on track for largest weekly loss (~-8%) in 6+ years; below $4700
Ongoing selloff tied to reduced expectations for Fed easing
Silver down ~40% from late-Jan highs
Single Stocks / Tech
OpenAI working on integrated desktop app (ChatGPT + Codex + browser)
Alibaba targeting $100B AI/cloud revenue in 5 years despite weak earnings (-67% Q/Q); raising prices + restructuring
Earnings / Data
Premarket: Carnival (CCL), XPENG (XPEV)
Otherwise quiet until next week; economic calendar empty
Flows / Volatility
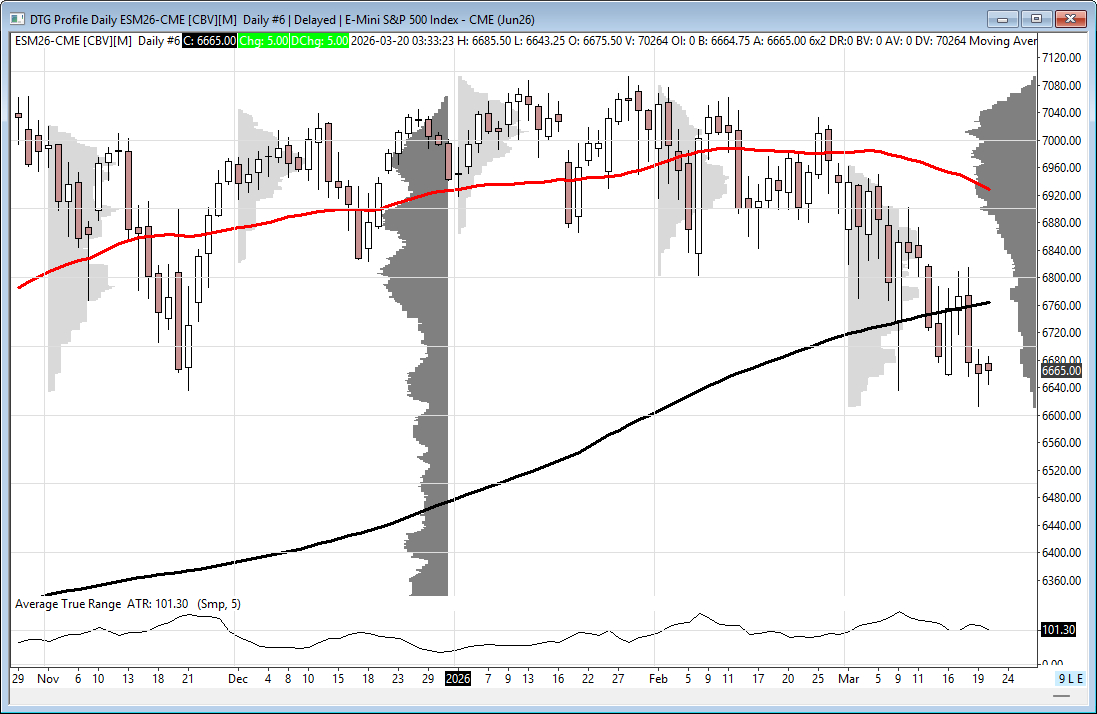
Volatility still elevated but slightly contracting (ES 5-day ADR ~115)
No strong whale bias; light bullish overnight flow
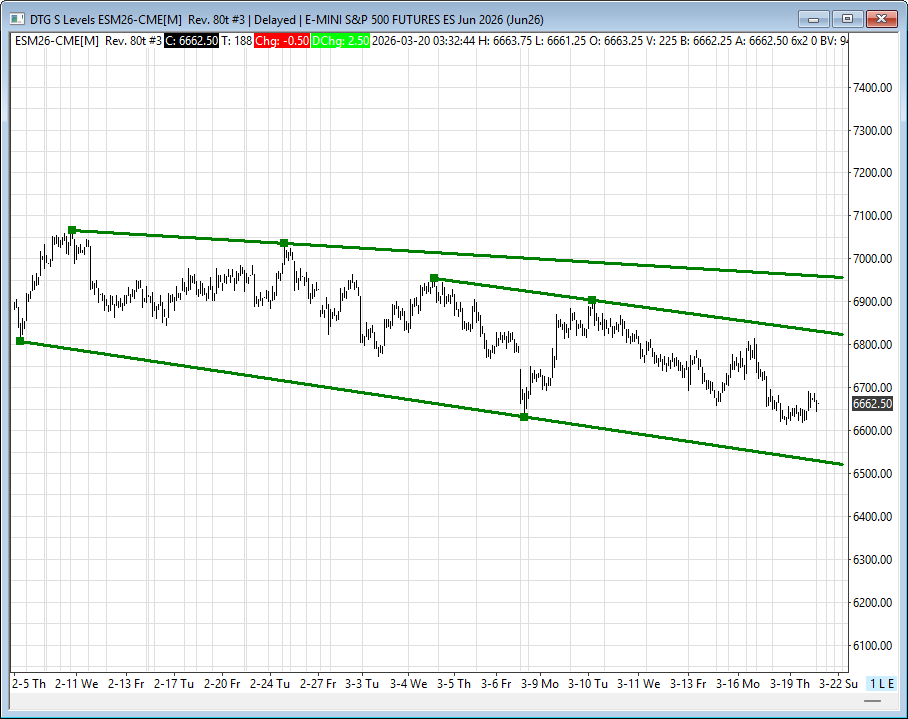
ES Technicals
Price consolidating mid-range within short-term downtrend channel
Rejected lower Thursday, bounced late session
Below 200-day MA (6761) → macro bias remains bearish
200-day MA acting as key resistance
Key Levels
Resistance: 6826/21, 6956/51
Support: 6538/33
Affiliate Disclosure: This newsletter may contain affiliate links, which means we may earn a commission if you click through and make a purchase. This comes at no additional cost to you and helps us continue providing valuable content. We only recommend products or services we genuinely believe in. Thank you for your support!
Disclaimer: Charts and analysis are for discussion and education purposes only. I am not a financial advisor, do not give financial advice and am not recommending the buying or selling of any security.
Remember: Not all setups will trigger. Not all setups will be profitable. Not all setups should be taken. These are simply the setups that I have put together for years on my own and what I watch as part of my own “game plan” coming into each day. Good luck!!
Follow @MrTopStep on Twitter and please share if you find our work valuable!