- The Opening Print
- Posts
- Gas at Five Bucks, CPI on Fire, and the S&P Still Bid Like Crazy - REDUX
Gas at Five Bucks, CPI on Fire, and the S&P Still Bid Like Crazy - REDUX
Follow @MrTopStep on Twitter and please share if you find our work valuable!
Our View
According to the March 2026 Consumer Price Index report from the Bureau of Labor Statistics, the annual inflation rate jumped to a nearly two-year high of 3.3% from February's 2.4%, with monthly CPI rising to 0.9% and core inflation reaching 2.6%. The sharp rise is due to a massive spike in energy costs caused by the ongoing war with Iran and the resulting maritime blockade, driven by a 21.2% surge in gasoline prices that accounted for nearly three-quarters of March's headline inflation increase; the broader energy index rose 10.9% for the month and 12.5% over the last year. While core inflation, which excludes volatile food and energy, rose more modestly to 2.6%, analysts warn that "tariff shocks" on imported goods and climbing transportation costs are beginning to exert upward pressure on these categories as well.
And the Joint Economic Committee and private analysts suggest this may be the start of a more prolonged inflationary trend. Projections indicate that if energy supply chains through the Strait of Hormuz remain restricted, headline CPI could climb toward 3.6% by May.
They say as of April 15, the national average price for a gallon of regular gasoline is $4.18. While premium prices fluctuate more significantly by region, the current national average for premium gasoline is approximately $4.84, but I paid $5.65 a gallon for premium last Saturday, and regular was around $5.00. But it's not just at the "pumps." The price of airline tickets, baggage checks, and airline fees have gone up too, just as more people in the US set up travel plans for the summer. The average airline fees were already high but have surged after the war in the Middle East started, with some routes more than doubling from a year ago. Additionally, hotel prices have surged because of the surge in inflation and "summer driving season."
I read that the war in the Middle East has cost the US $1 trillion (not sure that's right), but I don’t think that when the war ends, inflation or gas prices will fall significantly. But at the end of the day, none of this seems to matter to the stock market, and apparently, it doesn't seem to matter to the banks either!
Pitbull TV:
Live from The Pit | Dani & Lauren | Markets & Mindset
Lauren and Dani shared their views on Ags, trading, planning, and mindset. Catch the full replay above.
Today at 9AM ET
Join Manny and Rev live in The Pit room or on YouTube.
Live from The Pit | The Morning Game Plan | April 16
Don’t have access to thePit? Its free.
Guest Posts:
Dan @ GTC Traders
The Price of Hope
Last week in this space, we had disclosed that we held a 0.50 beta-weighted delta hedge and a net short index position. Within the last few days, we closed both. We are now net positive in our deltas …. so the portfolio itself has been enjoying this rally. In fact, some of the Programs within the portfolio are hitting new all time highs.
But we ourselves? Quite frankly?
We hate this rally.
However, we follow the process. As we have outlined many times in this space … in this environment we are leaning very little on discretionary trading, and instead have been leaning almost entirely on several Grey Box Quantitative models and programs. Robust programs that have been tuned for a more linear return profile. And these models and programs are robust. We have discussed 'robustness' many times in this space, but the last two weeks have been a genuine masterclass in why ‘robustness’ matters. Building a truly robust quantitative program is a brutal, agonizing ... meticulous process. And despite the hype and what you read online … you aren't going to build one using AI. We’re sorry … but you’re not. We’ve watched people try and fail. Developing either a Grey Box, or Black Box model requires a level of specialized expertise … and to be honest? The technology just is not there yet.
Regardless, as we were saying, we hate this rally higher. As many have commented? It makes little sense.
None of the risk factors that we have discussed in recent weeks have gone anywhere.
In fact, it’s gotten much worse.
In those countries and areas hardest hit? The actual spot price is not the price you see on the closest WTI contract. So if you look at the near term or cash WTI … that is not actually the ‘spot’ price that many producers around the world pay. Many of these countries that are hardest hit, pay the Dated Forward Brent price. Which as you see at that link, officially hit $124, and there are reports of some paying $132.
And yet the market rallies higher. Because at the moment, the market is pricing hope.

As we have discussed in this space ... the market is facing a complete wall of the breakdown of the world economy. Complete shortages and outages have already begun from Ireland, to Africa, to South Korea to Japan. To this point, the situation is serious, but not yet catastrophic. Because the world has had at its beck and call a 'glut' of oil surplus for some time now. SPR's have been tapped and would provide some relief for some time ... for about 45 to 75 days. In about 7 days, what is left floating on the water will be drawn down, and the gap in coverage begins to be felt worse than the lean years that are behind us. Long before 9 months of time, countries are facing complete darkness. So we're figuring ... rough math ... for about 45 to 75 days, the release from SPR's has taken the world as far as it dares go on a 'catastrophic basis' and countries will have to start looking inward and thinking of their own needs and immediate emergency use.
But the market continues to rally.
And yes, some of our Programs are also enjoying all time highs in their account.
Because in our view ... the market is pricing that things 'won't be that bad', and there will be a quick resolution to both the closure of the Strait of Hormuz, of the blockade, and the war in general. At that point, the world will still be left to deal with the massive gap in the supply chain that would have become apparent by that point.
So risk markets? They are pricing hope.
Let it.
At some point, the reality of these issues will come to bear on risk assets. By our rough math? It figures to start coming through the consumer pipeline by this July. Perhaps as early as late May. So ‘hope’ may come with a pretty hefty price tag.
Our models and programs got us short in March, and we enjoyed great performance all along the portfolio. So we eagerly await the next signal our programs fire off a short signal.
Quite eagerly.
Until next time, stay safe and trade well.
Market Recap:
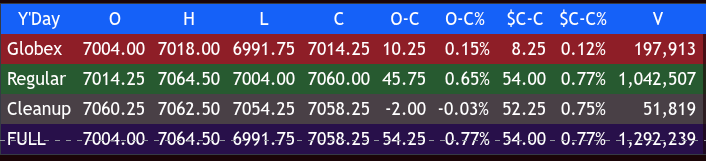
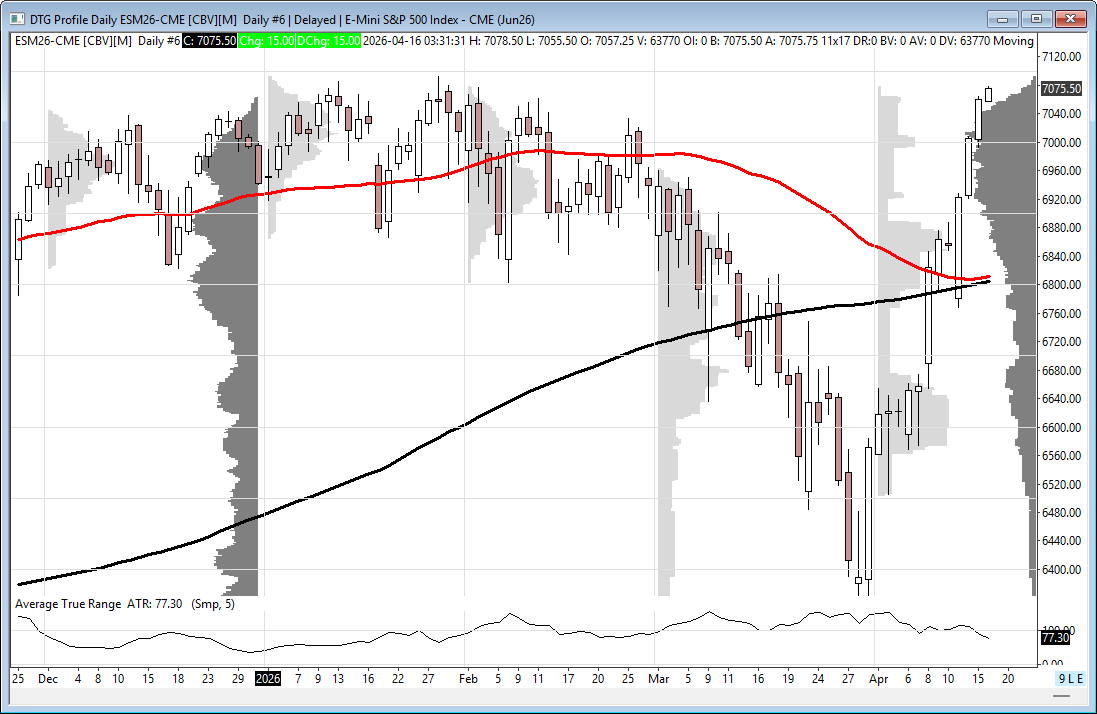
The ES traded in another narrow trading range on Globex, 6991.75 low up to 7018.00, and opened Wednesday's regular session at 7014.25, up 8.25 points or +0.12%.
After the open, the ES traded 7012.25 and rallied up to 7024.50 at 9:28, sold off 12.25 points down to 7012.25, rallied 20.00 points up to 7032.25 at 10:30, and pulled back to 7020.75 at 10:35. It then rallied 16.75 points up to 7037.50 at 11:25, back-and-filled in a 5 to 7 point range, and traded up to 7040.25 at 12:20.
The ES then got hit by headlines about the US not accepting a deal for Russia to store Iran's uranium, sold off 21.00 points down to 7019.25 at 12:55, and then rallied 23.00 points up to 7042.25 at 1:35. It pulled back to 7033.75 at 2:00, rallied up to 7048.50, traded 7042.00, and then rallied 25.25 points up to 7067.25 at 3:35. The ES sold off down to 7054.25 and traded 7057.00 as the 3:50 imbalance showed $2.1 billion to buy, traded up to a new high at 7064.50 at 3:55, and traded 7060.00 on the 4:00 cash close.
After 4:00, the ES sold off down to 7054.25 and settled at 7060.50, up 55.75 points or +0.80%, up 10 of the last 12 with 1 down only 8 points and 1 unchanged.
The NQ settled at 26365.50, up 368.75 points or 1.42%, up 8 sessions in a row or up 11 of the last 12 with the 1 unchanged. The YM settled at 48669, down 86 points or -0.18%, and the RTY settled at 2725.50, up 7.40 points or +0.27%, up 11 of the last 13 sessions with 1 down and 1 unchanged on the day.
In the end, the index markets are on a record roll with no let-up. In terms of the ES's and NQ's overall tone, they were firm, with every dip being bought and the NQ leading the way. In terms of the ES's overall trade, volume was the lowest in the 7 sessions at 1.293 million contracts traded.
Over the last week, some of the major banks have lowered and some have raised their S&P year-end projection. The current median year-end 2026 forecast sits around 7700, representing an implied upside of roughly 10–12% from early-year levels. In late March, JPMorgan slashed its target to 7200, citing the risk of demand destruction from surging oil prices. They warned the index could test 6000 if recession risks gain more traction.
Oppenheimer says 8100, Deutsche Bank at 8000, and Morgan Stanley at 7800, to Citigroup at 7700, Goldman Sachs at 7600, JPMorgan at 7200, and Bank of America at 7100. Personally, I don't doubt the US could trade up to 8000.00.
Conspiracy Theory
I said many times there was record hedging and selling on the way down, and I think this tells the story....
Dealer Positioning: Dealers are short 139M shares, marking the largest forced-buying position of the current cycle. Higher prices trigger automatic rebalancing (hedging math) rather than sentiment-driven buying.
Put Open Interest (OI): Put OI reached a cycle high of 13.3M at the 30-day high. As prices rise, these puts lose value and decay, forcing dealers to buy stock to unwind hedges, essentially turning "crash protection" into rally fuel.
Gamma Profile: There are no structural accelerators for 7% below the current price. The lack of negative gamma means there is nothing to amplify downward moves, leading to pullbacks being bought up quickly.
Economic Reports, Earnings, and Fed Speak
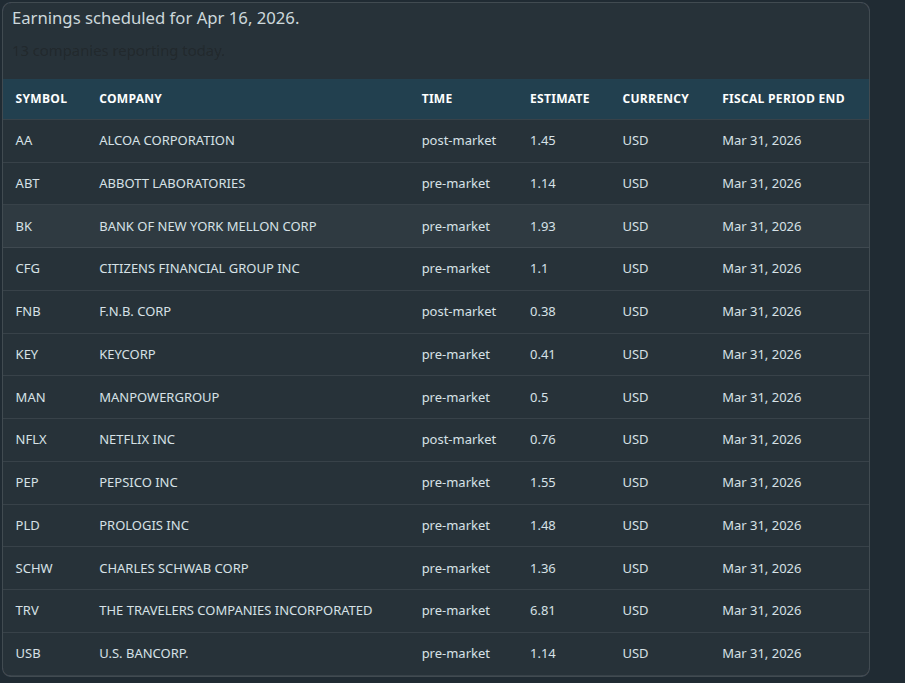
Bank of New York Mellon, U.S. Bancorp, Charles Schwab, KeyCorp, Citizens Financial, and F.N.B. Corporation are all reporting before the opening bell.
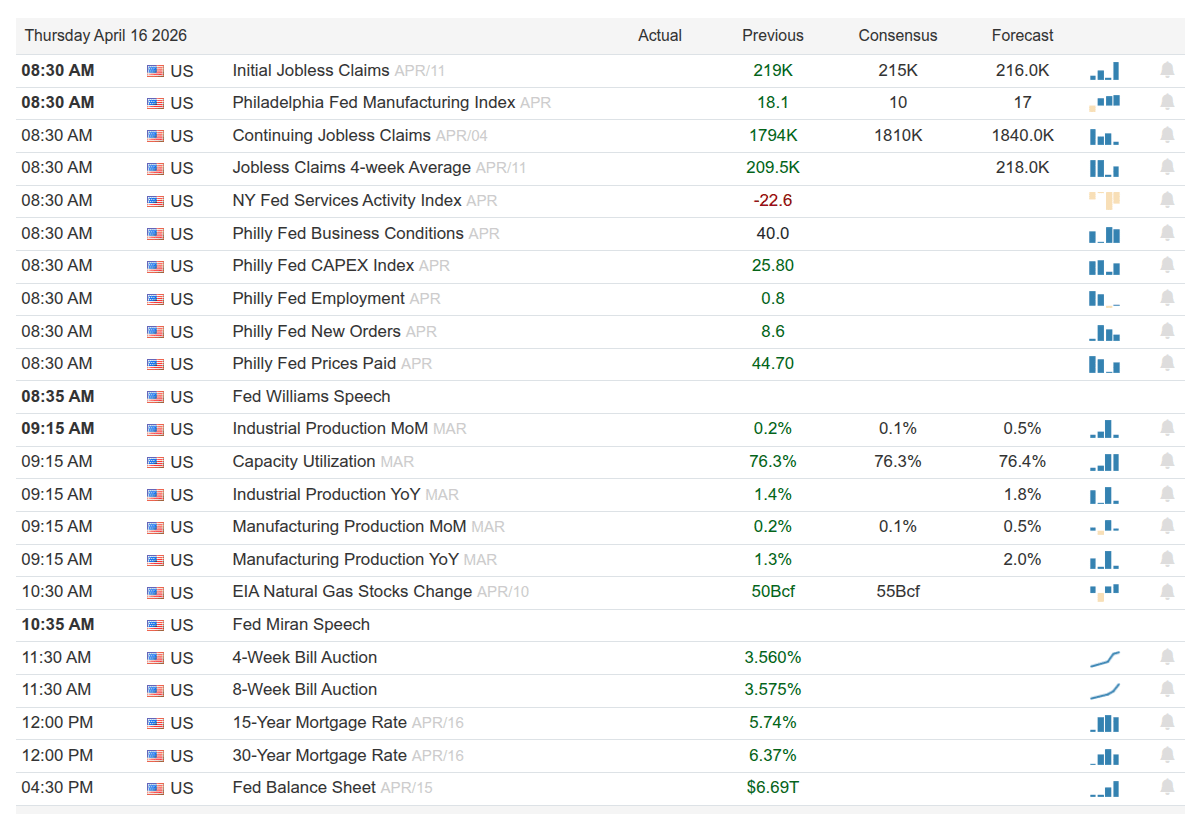
8:30 am: Initial jobless claims and Philadelphia Fed manufacturing survey
8:35 am: New York Fed President John Williams speaks
9:15 am: Industrial production and capacity utilization
10:35 am: Fed Governor Stephen Miran speaks, and NFLX after the close
MiM
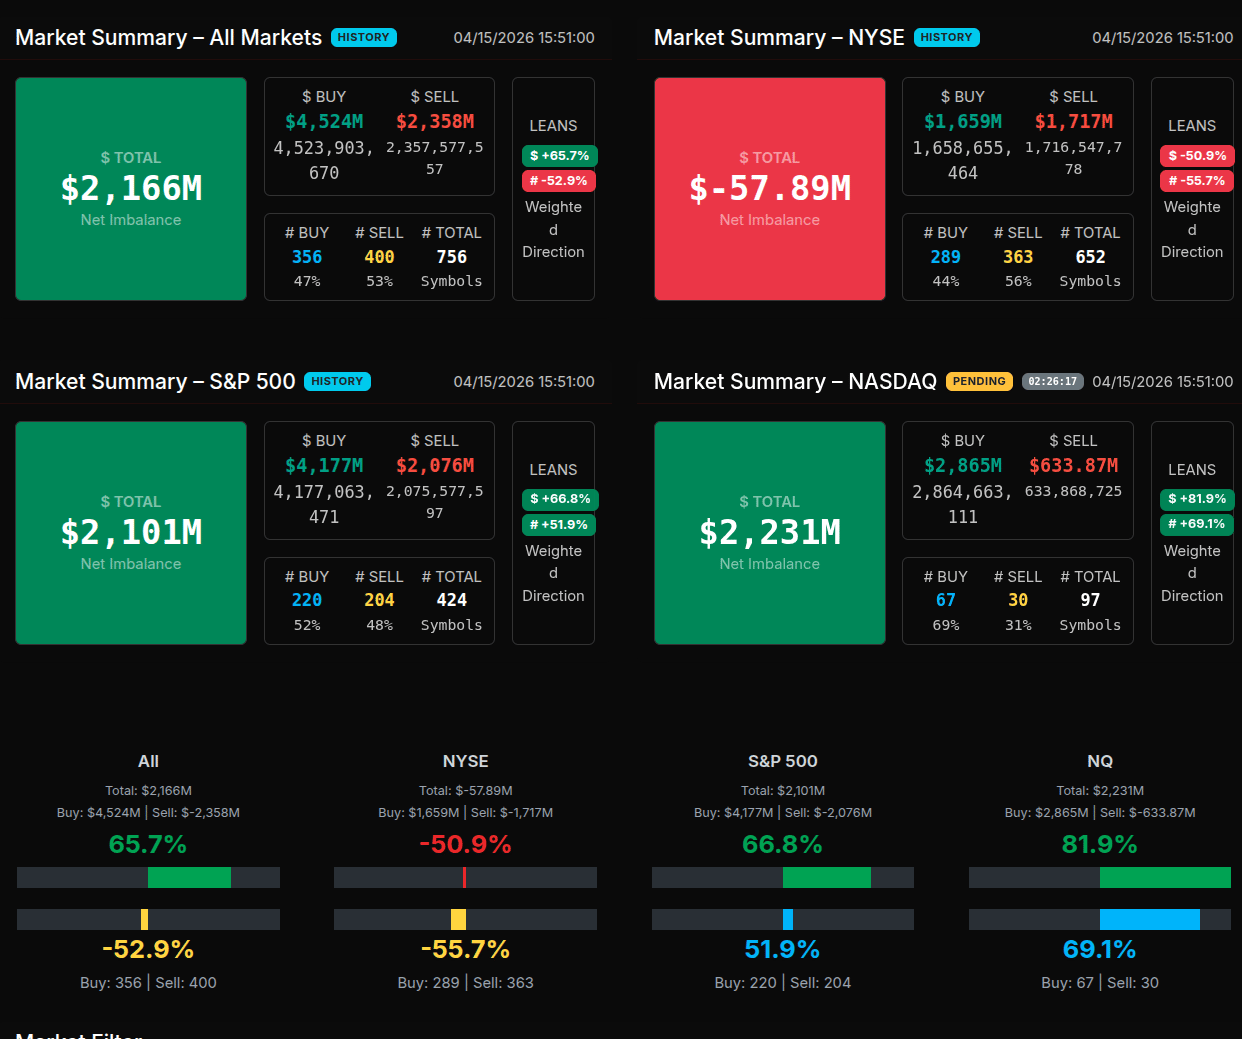
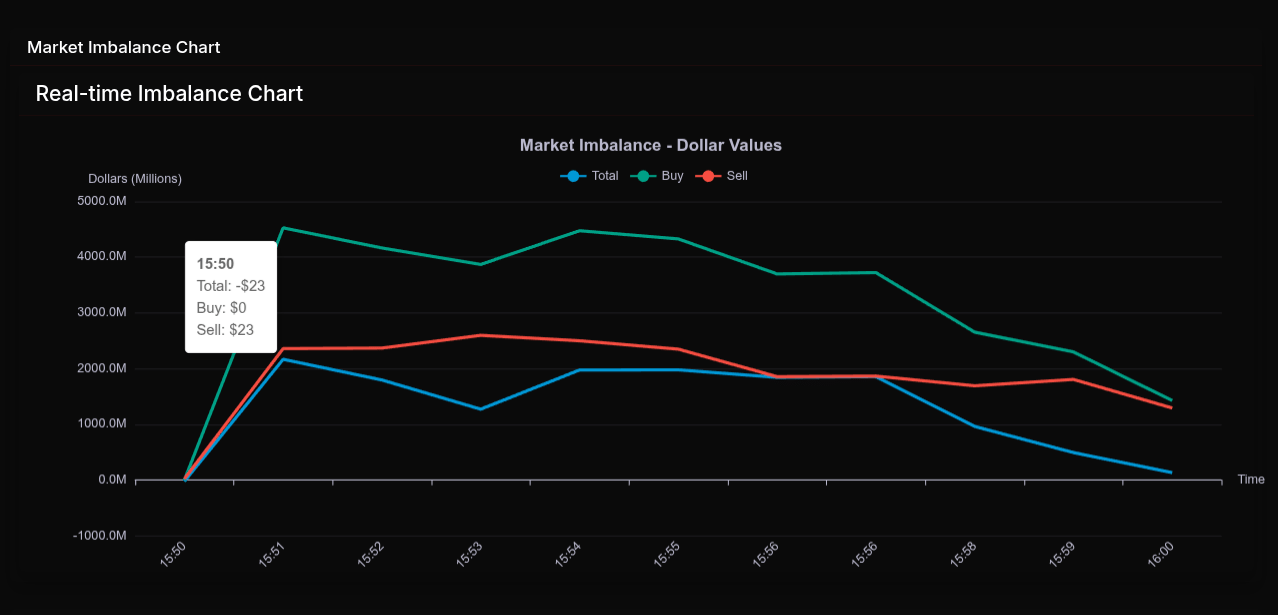
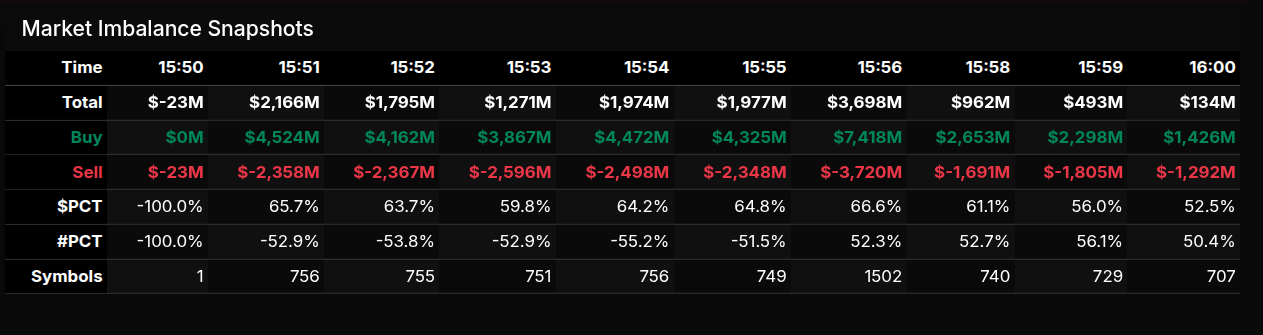
The MOC session opened with a notable shift from an initial sell imbalance into aggressive buy-side participation. At 15:50, the market showed a modest -$23M imbalance with 100% sell pressure, but this quickly reversed by 15:51 into a strong +$2.16B buy imbalance. From there, the session maintained a consistent buy program, with $PCT readings holding in the mid-60% range and peaking at +66.6%, signaling sustained institutional demand rather than rotation. Into the close, the imbalance tapered to +52.5%, indicating some profit-taking but still firmly buy-dominated.
From a market-wide perspective, the S&P (+66.8%) and Nasdaq (+81.9%) showed strong directional buy programs, both exceeding the 66% threshold—particularly the Nasdaq, which reflected a wholesale institutional bid. In contrast, the NYSE printed -50.9%, highlighting internal rotation beneath the surface rather than uniform participation.
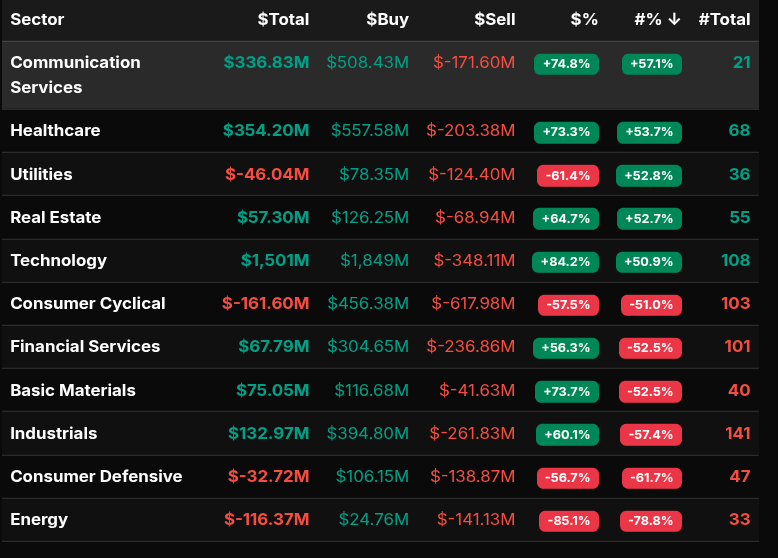
Sector flows reinforced this divergence. Technology led decisively with +84.2%, well above the 66% threshold, confirming a broad-based accumulation phase. Communication Services (+74.8%) and Healthcare (+73.3%) also saw strong inflows, indicating institutional preference for growth and defensives. On the other side, Energy (-85.1%) stood out as a clear liquidation trade, alongside Consumer Defensive (-56.7%) and Consumer Cyclical (-57.5%), suggesting capital was being reallocated rather than exiting the market entirely.
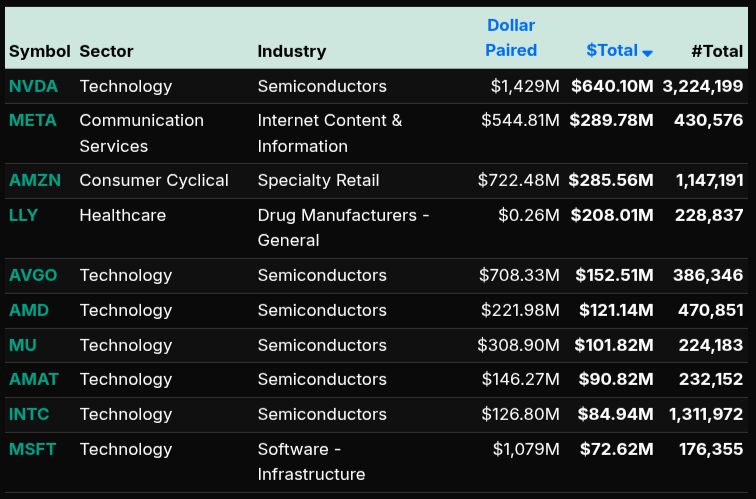
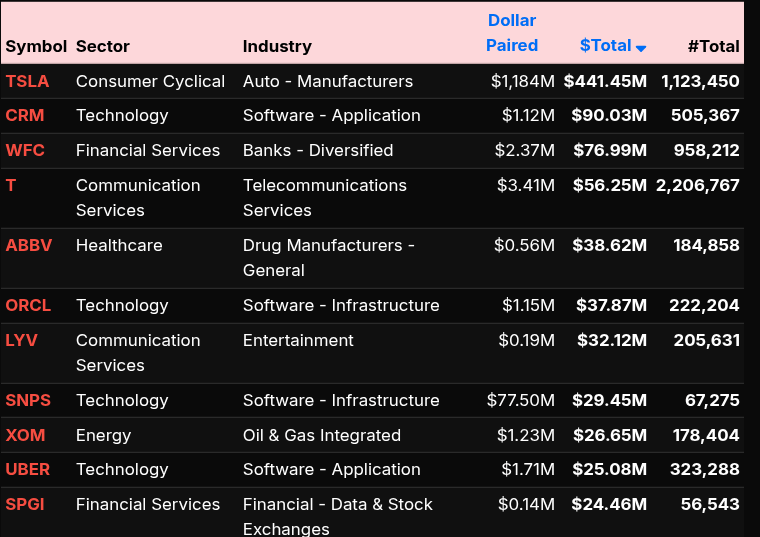
At the symbol level, leadership was concentrated in large-cap tech and growth. NVDA (+$640M), META (+$289M), and AMZN (+$285M) drove the buy side, supported by semiconductors broadly (AVGO, AMD, MU, AMAT, INTC). TSLA (+$441M) also contributed from the cyclical space despite broader sector weakness. Financials saw mixed flows, with WFC (+$76M) and SPGI (+$24M) attracting interest, while Energy names like XOM (+$26M) were relatively muted despite the sector-wide selling pressure.
Overall, this was a classic late-day institutional accumulation cycle concentrated in technology and growth, with strong directional conviction rather than balanced rotation.
Technical Edge
Fair Values for April 16, 2026
S&P: 37.4
NQ: 160.93
Dow: 185.96
Daily Breadth Data 📊
For Wednesday, April 15, 2026
NYSE Breadth: 59% Upside Volume
Nasdaq Breadth: 74% Upside Volume
Total Breadth: 69% Upside Volume
NYSE Advance/Decline: 55% Advance
Nasdaq Advance/Decline: 60% Advance
Total Advance/Decline: 58% Advance
NYSE New Highs/New Lows: 74 / 7
Nasdaq New Highs/New Lows: 233 / 69
NYSE TRIN: 0.77
Nasdaq TRIN: 0.50
Weekly Breadth Data 📈
For the Week Ending Friday, April 10, 2026
NYSE Breadth: 54% Upside Volume
Nasdaq Breadth: 67% Upside Volume
Total Breadth: 62% Upside Volume
NYSE Advance/Decline: 68% Advance
Nasdaq Advance/Decline: 40% Advance
Total Advance/Decline: 51% Advance
NYSE New Highs/New Lows: 220 / 122
Nasdaq New Highs/New Lows: 410 / 419
NYSE TRIN: 1.77
Nasdaq TRIN: 0.33
S&P 500/NQ 100 BTS Trading Levels (Premium Only)
BTS are daily generated levels created using a combination of proprietary calculations and AI to define an upper range target and a lower range target, split by a bull/bear line. You receive daily charts along with clear descriptions of each level to help guide your trading.
Take a Free Premium Trial to see them in action.

Last Day
Today’s Economic Calendar
Earnings:
`
Trading Room News:
PTG Room Summary – For Wednesday, April 15, 2026
Wednesday’s session unfolded as a methodical, trend-driven day that rewarded patience and disciplined execution, with David guiding the room through a clean progression of setups.
Morning – Strong Start with Structured Shorts
The day kicked off with a clear directional read:
CL Open Range Short immediately began playing out, hitting lower targets early.
In ES, D-Level and penetration zones (7020–7023) were identified and cleanly fulfilled, reinforcing the importance of trusting key levels.
The room capitalized on a trend continuation setup, with multiple confirmations that structure was holding.
Lesson: When price respects D-Levels and penetration zones early, it often sets the tone for a trend day. Trust the framework.
Mid-Morning – Controlled Grind Higher
After the initial moves:
Price transitioned into a slow grind upward, with additional upside targets (7029–7031) getting hit.
Despite expectations of possible mean reversion (MATD), the market showed persistent bid support.
David emphasized:
“Dips continue to get scooped up”
Advising traders to play the short side tight
This was key—while short setups existed (Money Box / CD2 reversals), they required quick risk management due to underlying strength.
Lesson: In strong trend environments, countertrend trades must be tactical, not stubborn. The market was signaling strength—listen.
Late Morning – Low Volatility, High Discipline
The market entered a low-volatility grind phase (“low comment day”).
Call wall levels and ATH discussions (around 7034–7038) became focal points.
Participation required patience over overtrading.
Lesson: Not every session is high action—discipline during slow conditions preserves gains.
Afternoon – Bigger Picture Emerges
The broader context became clear:
David highlighted an “Incredible 3-Day Super Cycle”, possibly one of the largest on record.
SPX pushed to All-Time Highs, confirming the bullish structure.
Into the close:
$2.1B MOC Buy Imbalance added fuel to the trend
Lesson: Recognizing multi-day cycles is powerful—this wasn’t just a one-day move, but part of a larger momentum phase.
Key Takeaways
D-Level precision matters – multiple levels were respected and fulfilled.
Trend > opinion – dips were consistently bought despite expectations of balance.
Tight risk on countertrend trades – shorts worked, but only if managed actively.
Patience pays in slow markets – avoid forcing trades during grind phases.
Context is king – the 3-day super cycle and ATH breakout framed everything.
DTG Room Preview – Thursday, April 16, 2026
Macro backdrop: Markets driven by US–Iran truce optimism and strong Q1 earnings; S&P 500 closed above 7000 for the first time, Nasdaq on an 11-day winning streak
Geopolitics: Ongoing US–Iran ceasefire negotiations; Strait of Hormuz still constrained, longer-term economic/oil impacts largely ignored for now
Fed outlook: Markets pricing no rate cuts through 2026; Fed officials signaling extended pause; Trump вновь pressuring Powell
Volatility: Contracting as markets grind higher; ES 5-day ADR down to 89.5
Corporate highlights:
TSMC Q1 profit +58% (AI chip demand strength)
Musk advancing “Terafab” semiconductor push targeting massive future capacity
Earnings watch:
Pre-market: ABT, BK, SCHW, CFG, KEY, PEP, PLD, SNA, TSM, TRV, USB, WIT
After close: AA, NFLX, SNAP
Friday: ALLY, ERIC, FITB, HDB, IBN, RF, STT, TFC
Economic calendar: Philly Fed & Jobless Claims (8:30 ET), Industrial Production (9:15 ET); Fed speakers Williams & Miran
Flows/positioning: No meaningful overnight whale bias
Technicals (ES):
Trend remains higher; 50-day MA turning up above 200-day MA (bullish)
Resistance: 7195 / 7200
Support: 6869 / 6864 → 6615 / 6610 → 6210 / 6205