- The Opening Print
- Posts
- Gaps, Traps, and a Run to 6920 — Danny’s Still Long and the Tape's Still Strong
Gaps, Traps, and a Run to 6920 — Danny’s Still Long and the Tape's Still Strong
Follow @MrTopStep on Twitter and please share if you find our work valuable!
Our View
The ES and NQ have been back and filling all week. Aside from all the data, today is also Week 1 December expiration, which should add to the movement. I think it’s going to be another volatile trading day.
Our Lean
If the ES gaps higher today, there could be some selling, but I still see 6920 as my upside target. I’m long and holding.

We’ve never offered a deal like this before, and it includes all our tools, including the Imbalance Meter.
Guest Posts:
 |
Get instant access to our partners’ real-time market data and insights not available anywhere else. Here is last night's Founder’s note getting you ready for today’s market and explaining the constraints in yesterday’s market. - MrTopStep
Founder's Note:
Futures are up 15bps ahead of PCE at 10AM ET.
Today's levels:
Support: 6,850, 6,820, 6,800
Resistance: 6,900
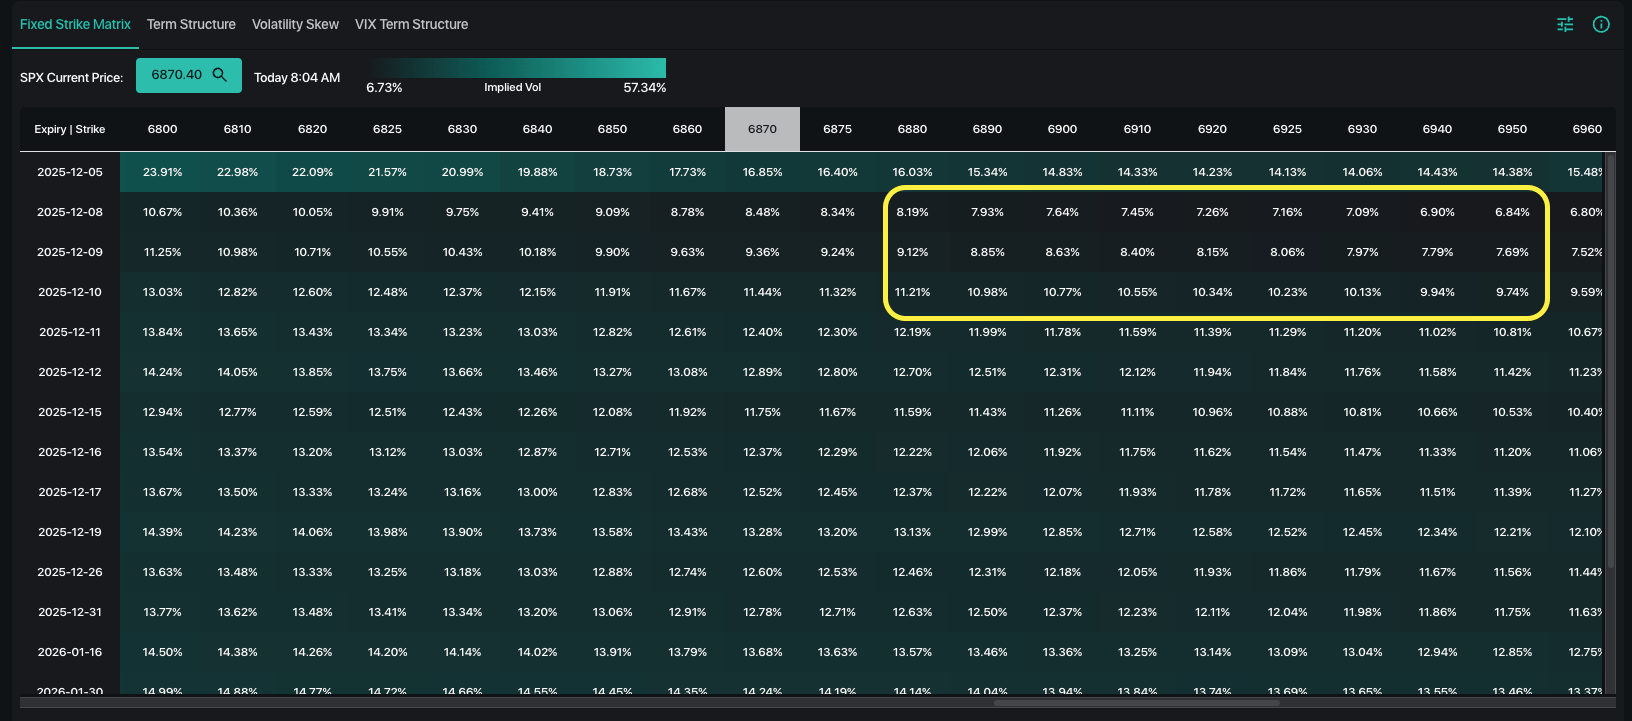
On the PCE topic, the 0DTE straddle is just $29.3/42bps (ref 6,865) which is quite low. This infers traders are not terribly focused on this mornings report, which could be simply because its September's delayed reading. Ultimately if it passes without issue it likely brings a mild event-vol contraction which aids in buoying stocks. PCE gives way to a weekend, too, which is generally a vol-depressant.
Recall, too, that the last 2 sessions have seen violent jumps that mean-reverted. This, as the 0DTE SPX options IV is bottom-basement level. We yesterday discussed how the ultra-low IV causes some short term jump risk as sharp moves can be compounded by 0DTE vol covering. Something to be aware of today if a sharp drop hits on no real news...
Looking at the bigger picture, we continue to mark two key zones on the S&P, which have largely been unchanged this week. 6,925-6.950 to the upside, which is likely major resistance into FOMC, and 6,750-6,700 to the downside. We're of the view that upside drift likely remains in play into FOMC, it would take a material trigger to invoke a spill to that 6,700 area. On this topic if the SPX breaks <6,790 we would flip to a neutral or short position.
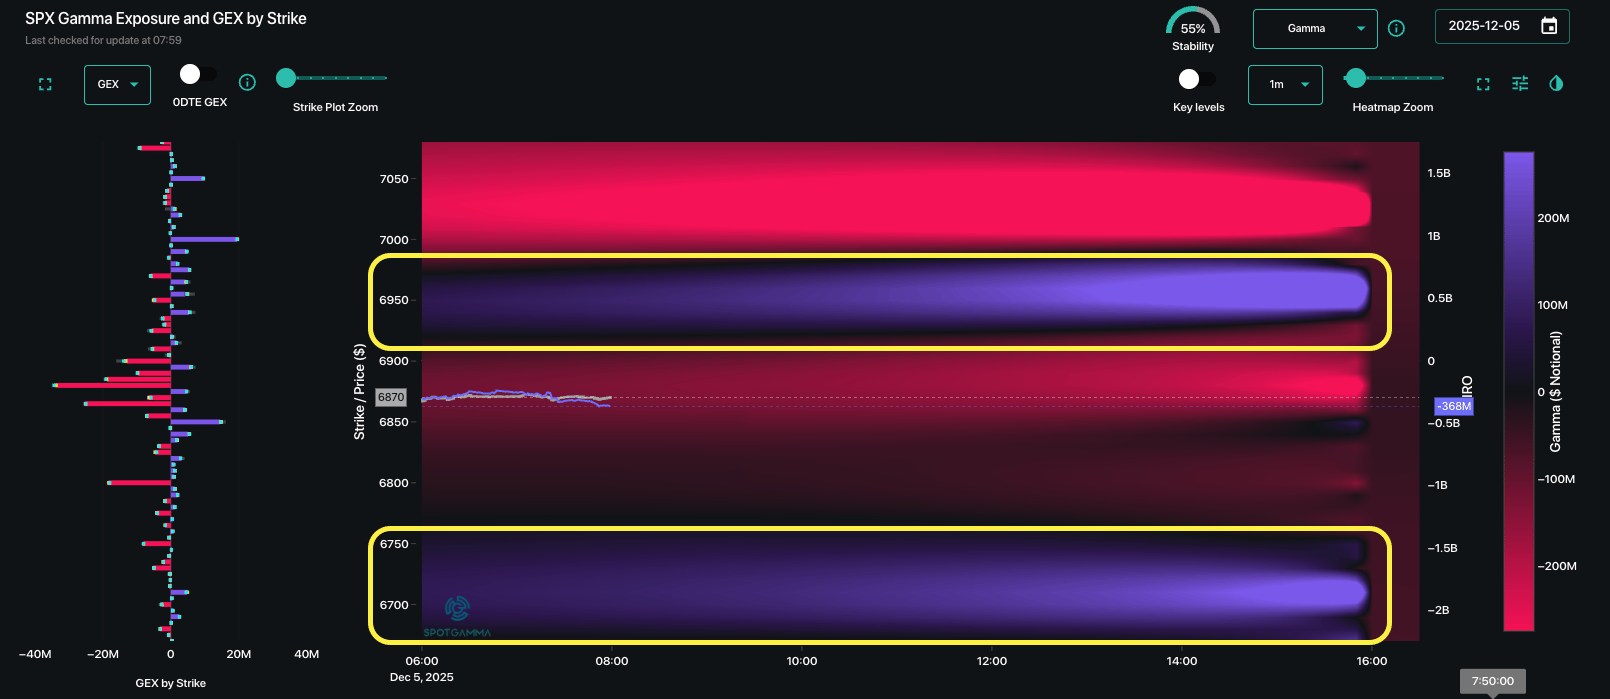
What about the upside?
As we discussed in yesterday's Q&A, the pre-FOMC upside is really cheap. 7-handle SPX IV's are about as low as you can get, and thats where >=6,900 strike calls are priced Monday & Tuesday. Given this, we've take a few >=6,900 lotto call positions for Monday & Tuesday on the basis of "sometimes you just buy options because they are so cheap".
©2025 TenTen Capital LLC DBA SpotGamma
Get instant access to our partners real-time market data and insights not available anywhere else. Here is last night Founder’s note getting you ready for today’s market and explaining the constraints in yesterday’s market. - MrTopStep
Market Recap
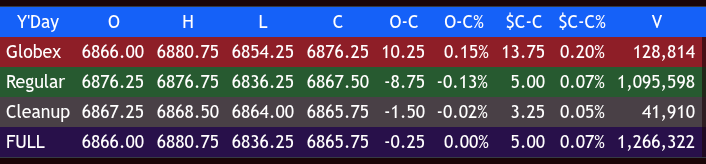
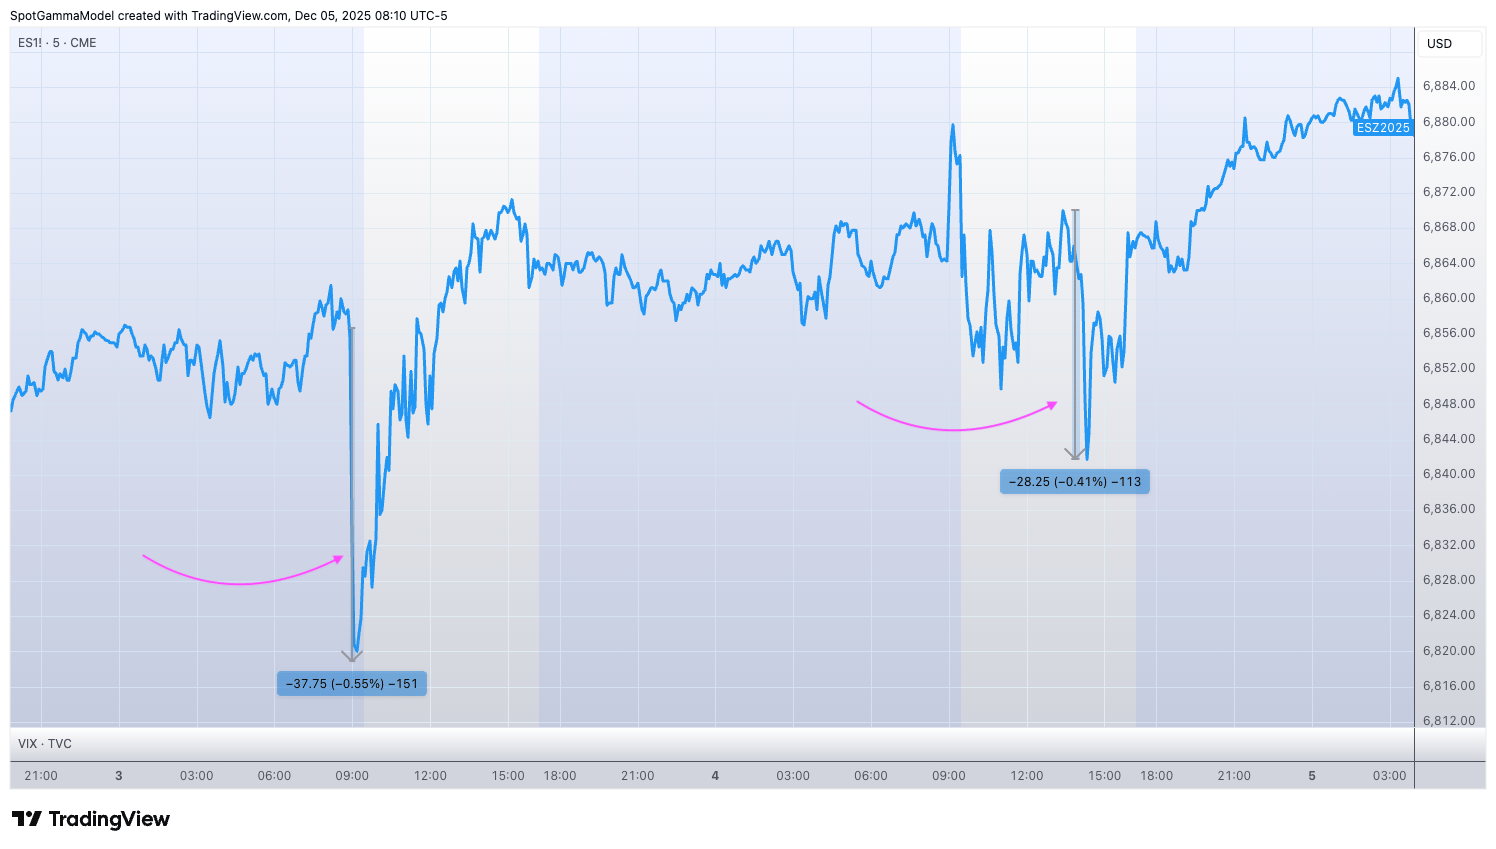
The ES made a low at 6854.25 and rallied up to 6880.75 at 9:18 AM as layoffs topped 1.1 million this year, while US weekly jobless claims fell to the lowest level in over 3 years. The ES opened Thursday's regular session at 6876.25.
After the open, the ES traded 6877.00 and sold off down to 6844.50 at 10:25, rallied up to 6868.75 at 10:40, then traded back down to a higher low at 6845.00 at 11:05. It rallied up to the VWAP at 6860.50 and traded in an 8-point range under the VWAP until 11:45.
From there, it rallied to 6868.75, traded back down to 6865.50, then popped above the VWAP and traded in a 10-point range until 1:00. It pulled back to 6857.50, rallied up to 6871.00, and then traded in a 4- to 6-point range above the VWAP until 2:05 before breaking down to a new low at 6836.25 at 2:20.
After the low, the ES traded up to 6862.75 at 2:35, sold off again to 6846.00 at 3:05, rallied up to 6857.75 at 3:10, then fell into another 5- to 7-point chop until 3:45 when the ES started going bid.
It traded 6854.00 as the 3:50 cash imbalance showed $1 billion to buy, then moved up to 6867.50 at 3:55 and traded 6867.50 on the 4:00 cash close. After 4:00, the ES flatlined in a 3- to 5-point range and settled at 6865.75, down 10.5 points or -0.15%. The NQ settled at 25,632.50, down 15.5 points or -0.06% on the day.
In the end, the ES is going up like I said it would. In terms of the ES's tone, it was a standard affair — up open, sell-off, rally, pullback into the MiM, and then rally again. In terms of the ES’s overall trade, total volume was 1.26 million contracts traded.
On Tap
The BEA release at 8:30 AM ET of the 2023 Activities of U.S. Affiliates of Foreign Multinational Enterprises, followed at 10:00 AM ET by September’s Personal Income and Outlays report, the Fed’s preferred Core PCE inflation measure, and the preliminary December University of Michigan Consumer Sentiment Index .
The US jobs numbers (the monthly Employment Situation report from the Bureau of Labor Statistics, covering nonfarm payrolls, unemployment rate, and related metrics) are not being released today, December 5, 2025. Due to a government shutdown earlier in the year, the November 2025 report has been delayed and is now scheduled for Tuesday, December 16, 2025, at 8:30 a.m. ET.
MiM
Market-On-Close Recap
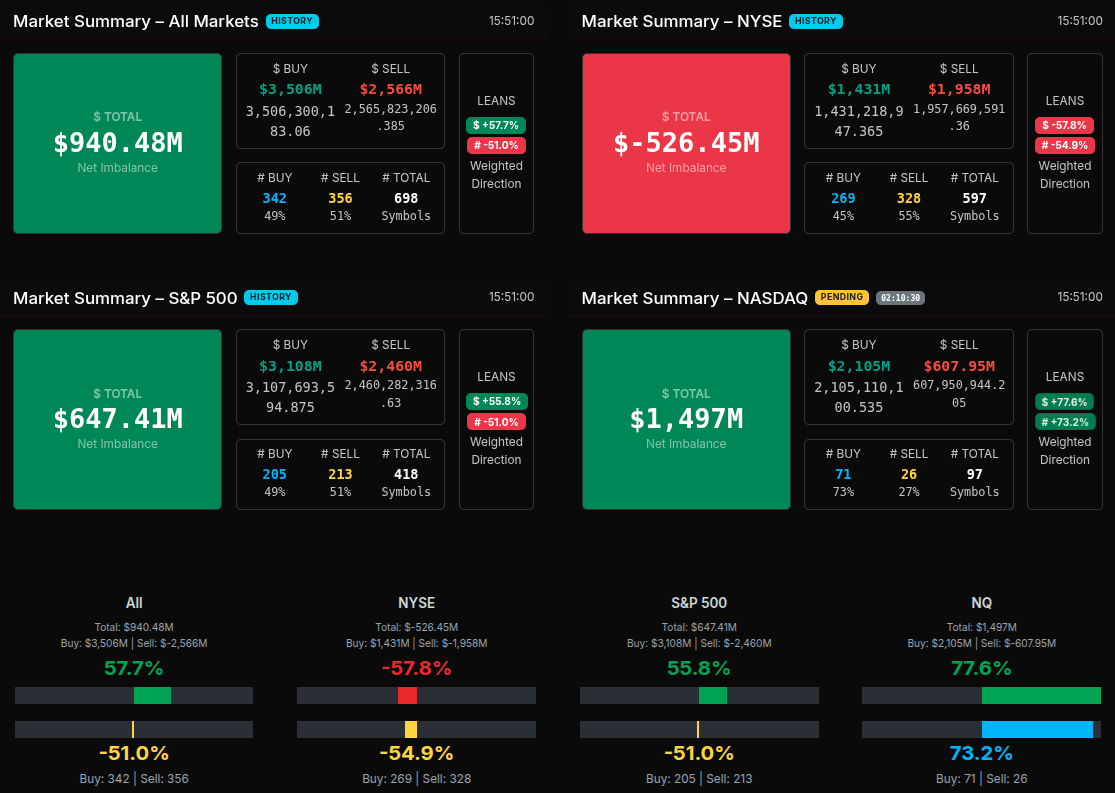
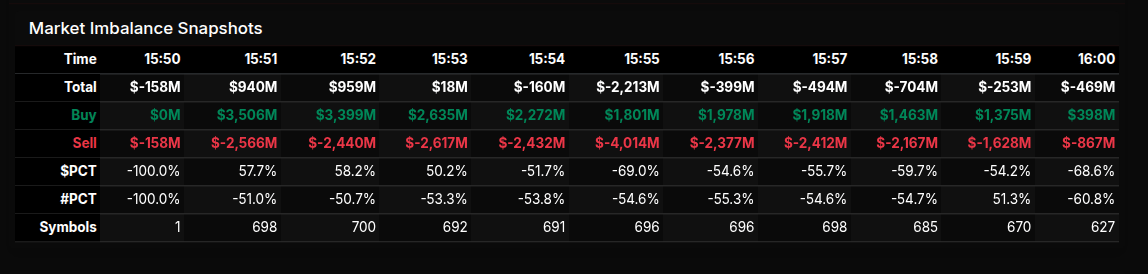
The market-on-close auction opened at 15:51 with a sharp upside bias, showing a $940M buy imbalance, driven by $3.5B in buy interest versus $2.6B in sell. This early surge set the tone: buyers controlled the initial rotation, but the structure quickly transitioned into a heavy, sustained sell program as the auction progressed.
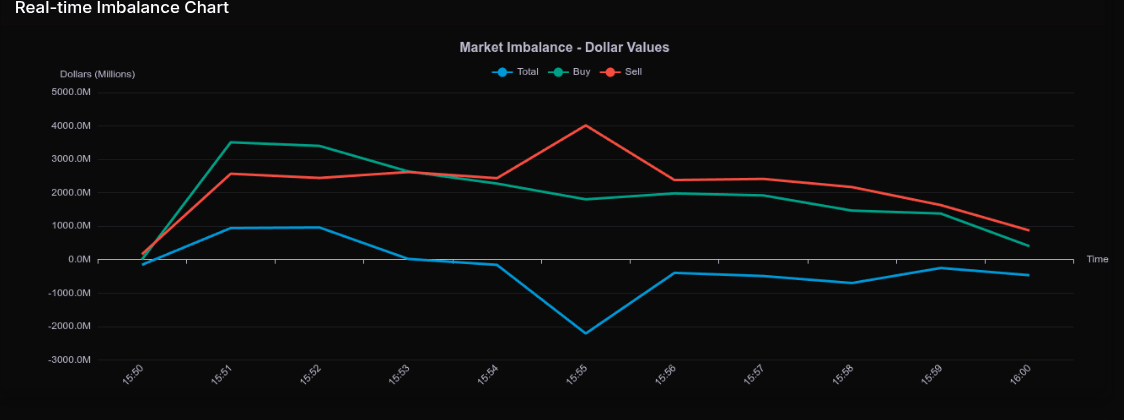
From 15:52 to 15:54, buy interest remained elevated—$3.3B, then $2.6B, then $2.2B—yet each minute saw growing sell pressure on the other side. By 15:55, the auction flipped hard: sell imbalances ballooned to –$4.01B, pushing the total to –$2.21B, marking the decisive pivot of the session. This –69% lean signaled broad, wholesale selling. The pressure eased slightly into 15:56–15:59 but remained firmly negative through the close, finishing –$469M at 16:00.
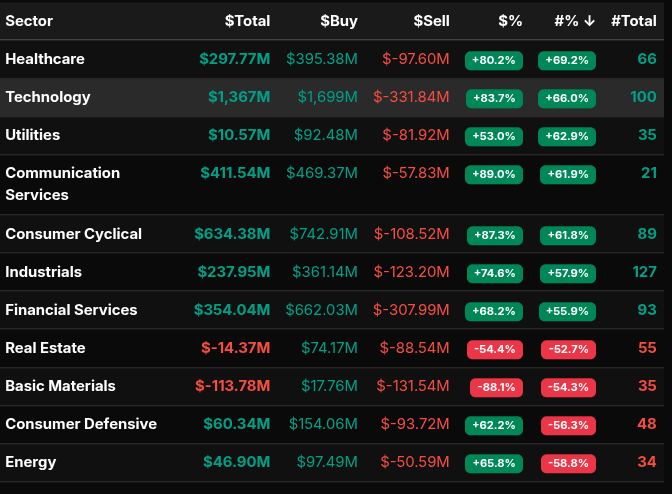
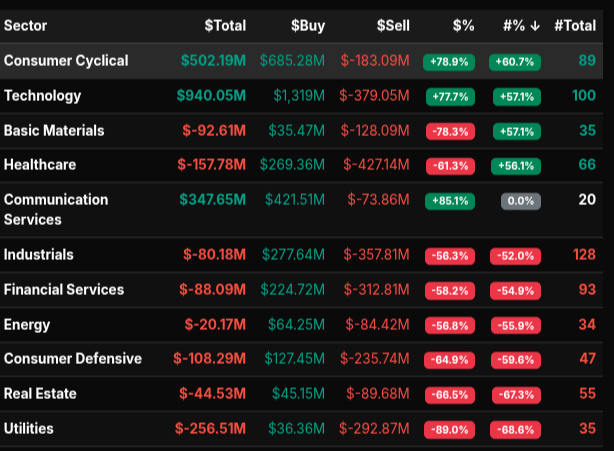
Sector flow confirmed this deterioration. Technology led early with a +77.7% / $940M bid, while Consumer Cyclical posted +60.7% / $502M, supported by TSLA, AMZN, and retail names. Communication Services also held a strong +85% buy lean. But everything else was aggressively offered: Utilities (–89%), Basic Materials (–78%), Industrials (–56%), Financials (–58%), and Healthcare (–61%). Many of these were deep, wholesale-type sells with leans below –66%, consistent with the heavy flip at 15:55.
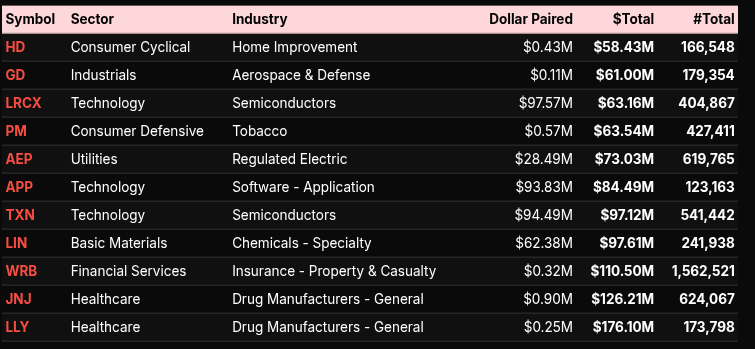
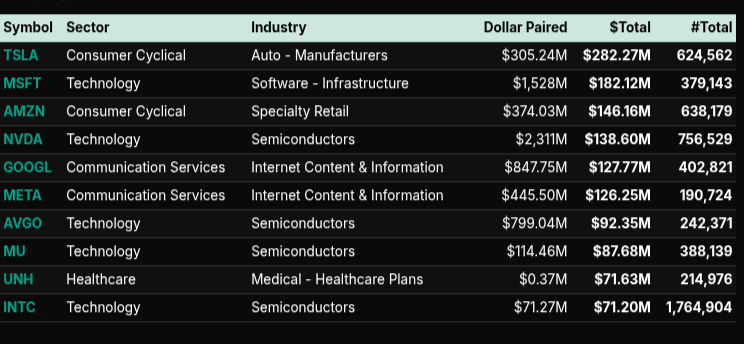
Symbol-level flows showed Technology dominating the buy side—NVDA, AVGO, TXN, INTC, MU all posted large paired values. Mega-cap tech (MSFT, GOOGL, META) added substantial early support. On the sell side, large-cap Healthcare and Financials were notable: LLY, JNJ, WRB, and LIN all carried heavy red totals, indicating targeted liquidation in defensive sectors even while tech was bid.
The overall pattern: strong early buy surge, followed by a fast unwind that turned into a broad-based sell imbalance. The late-day decline in buy lines alongside persistent selling confirmed the shift from rotational action to directional sell programs into the bell.
On the MIM:
BTS Trading Levels - (Premium Only)

ES Levels
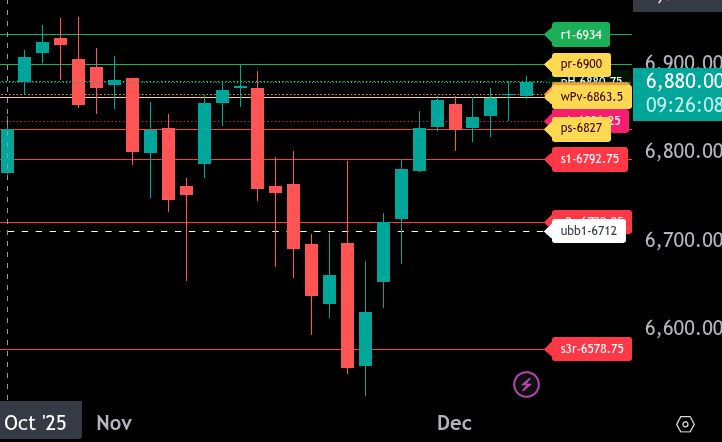
The bull/bear line for the ES is at 6863.50. ES is currently trading around 6880.00, holding above this key level and maintaining a bullish tone in the Globex session.
If ES stays above 6863.50, the next upside resistance is at 6880.75 (prior high). A breakout above that opens the path toward the upper range target at 6900.00. Above 6900.00, resistance extends to 6934.00.
If ES slips back below 6863.50, expect sellers to push toward 6836.25 and then the lower range target at 6827.00. A move under 6827.00 exposes deeper support near 6792.75.
The trend remains constructive above 6863.50, but failure to hold that level would shift momentum back toward the lower supports.
NQ Levels
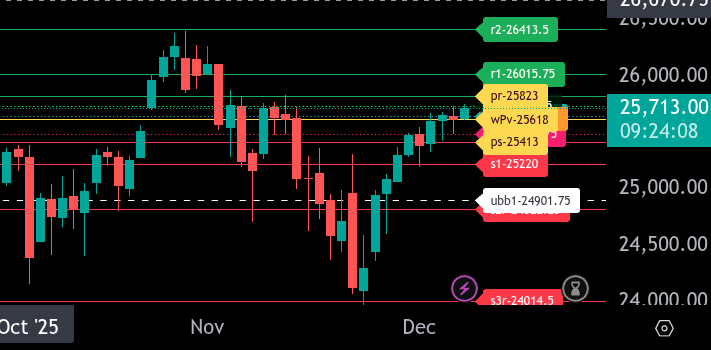
The bull/bear line for the NQ is at 25,618.00. Trading above this level keeps the tone constructive in the Globex session.
The NQ is currently trading near 25,714.75, holding well above the bull/bear line. If buyers maintain control, the next upside objective is the upper range target at 25,823.00. Above that, resistance appears at 26,015.75.
If the NQ pulls back, initial support sits at 25,650.25. A deeper decline targets 25,488.75, the lower range target. Below that, additional support shows at 25,413.00 and then 25,220.00.
Overall, staying above 25,618.00 favors continued upside toward 25,823.00, while losing this level opens the door for rotation back toward 25,488.75 and lower supports.
Technical Edge
Fair Values for December 5, 2025
SP: 9.36
NQ: 39.44
Dow: 53.52
Daily Breadth Data 📊
For Thursday, December 4, 2025
• NYSE Breadth: 58% Upside Volume
• Nasdaq Breadth: 59% Upside Volume
• Total Breadth: 60% Upside Volume
• NYSE Advance/Decline: 48% Advance
• Nasdaq Advance/Decline: 59% Advance
• Total Advance/Decline: 55% Advance
• NYSE New Highs/New Lows: 128 / 25
• Nasdaq New Highs/New Lows: 215 / 63
• NYSE TRIN: 0.55
• Nasdaq TRIN: 0.94
Weekly Breadth Data 📈
Week Ending Friday, November 28, 2025
• NYSE Breadth: 69% Upside Volume
• Nasdaq Breadth: 71% Upside Volume
• Total Breadth: 70% Upside Volume
• NYSE Advance/Decline: 85% Advance
• Nasdaq Advance/Decline: 80% Advance
• Total Advance/Decline: 82% Advance
• NYSE New Highs/New Lows: 207 / 64
• Nasdaq New Highs/New Lows: 384 / 256
• NYSE TRIN: 2.29
• Nasdaq TRIN: 1.56
Calendars
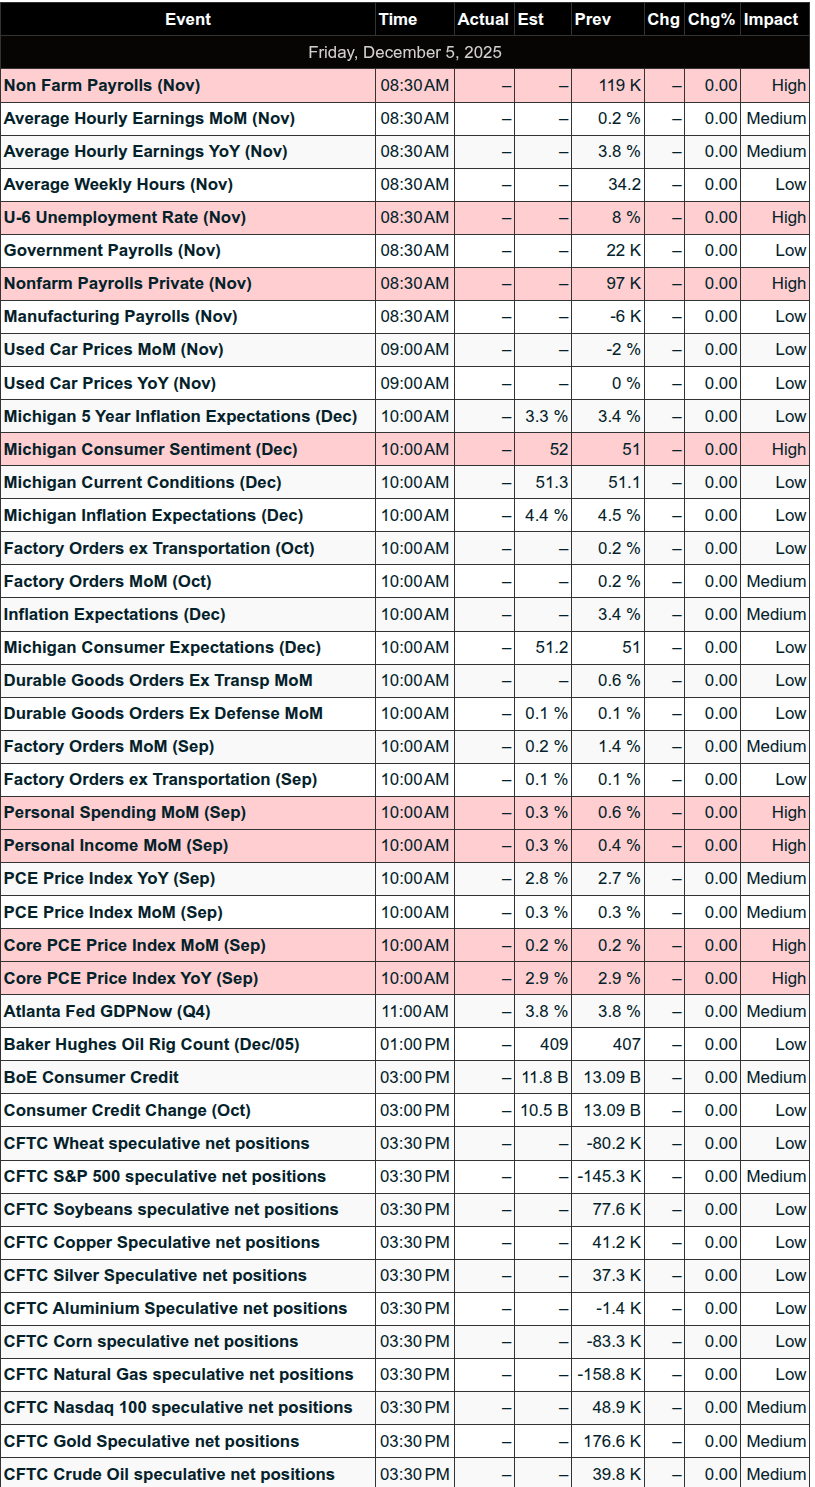
Economic Calendar Today
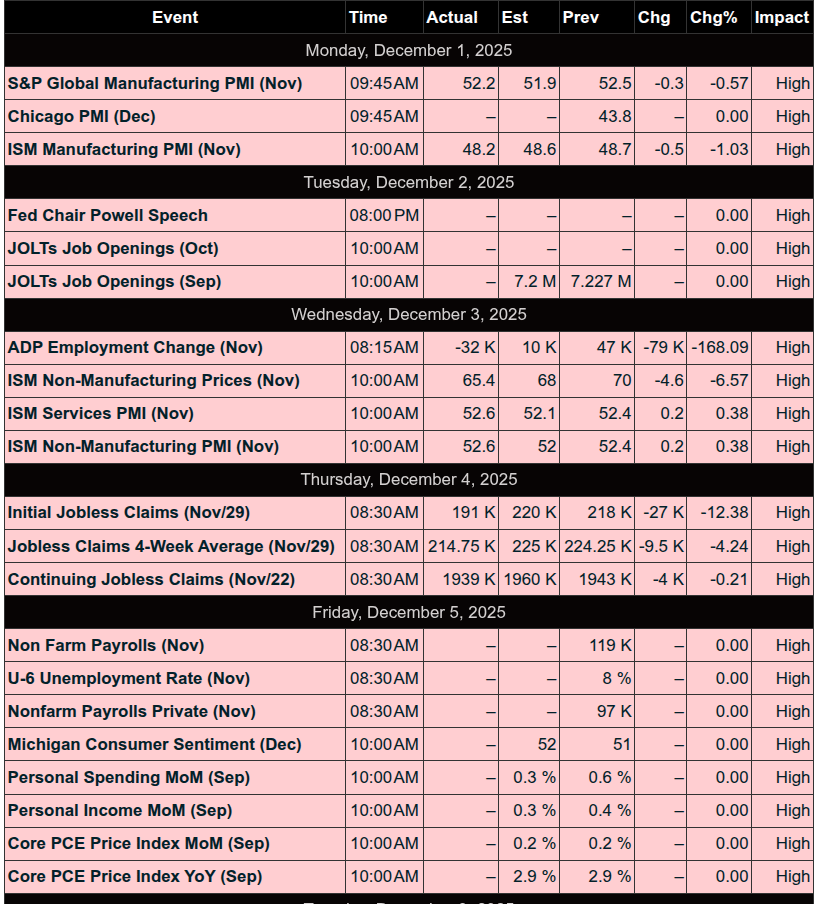
This Week’s High Importance
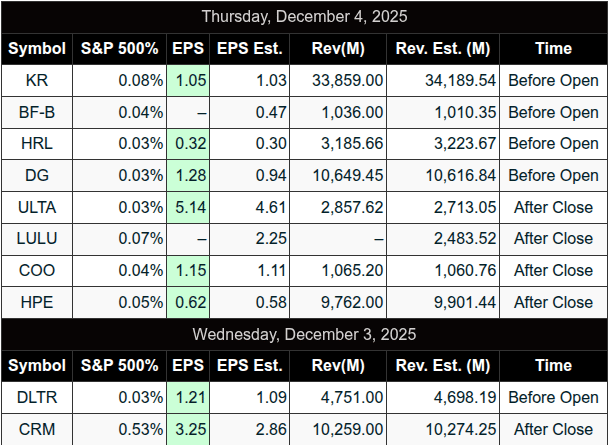
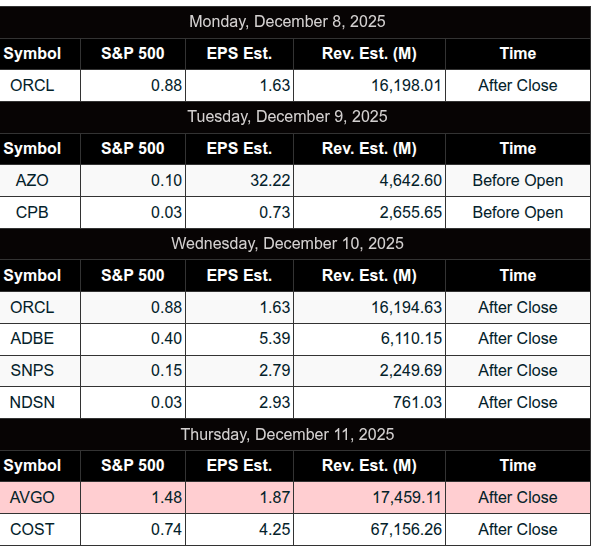
Earnings:
Trading Room News:
Polaris Trading Group Summary - Thursday, December 4, 2025
Thursday’s session in the PTG room featured clear trade planning, solid community engagement, and a standout execution of a textbook setup. Despite temporary chart and connectivity issues, the group stayed focused on process, discipline, and risk management. It was a day marked by precision in levels, thoughtful discussions, and high-quality setups.
Key Highlights & Trades of the Day
Trade of the Day – Manny’s Support Buy (Plan: 6844–6848 ES)
Manny executed the first trade plan perfectly after price reached the support band. The trigger conditions were met: delta flipped positive, sellers failed to push below, and stacked bids held.
Manny exited with +10 at 6862 and +15 at 6867.
David recognized this as the “Trade of the Day,” validating the setup and execution as ideal.
This was a strong example of waiting for order flow confirmation before entry.
Market Behavior & Analysis
Both upper and lower target zones were fulfilled, showing strong alignment with the premarket levels.
Bruce used a Fib extension from the 6845 low to the 6870 high, identifying a money box at 6835–6838, which price action hit cleanly.
David’s Cycle Day 1 Average Decline projection to around 6834 closely matched the day’s low of 6836.25, reinforcing the accuracy of the DTS Brief.
The afternoon transitioned into consolidation, with price closing near mid-VWAP.
Market-on-Close activity included a $1B buy imbalance that was quickly absorbed, later flipping to a $2.25B sell imbalance.
Tech and Connectivity Issues
PTGDavid experienced a temporary loss of connection and operated via mobile until systems were restored.
Chart streams were down briefly but returned later in the session.
Despite the disruptions, room members like Bosier helped maintain flow by sharing levels and trade ideas.
Education and Community Insights
PeterN initiated an important discussion about how to identify true trends versus short bursts, position sizing, and dealing with fear of reversals.
DanV, Ram, John B, and others contributed thoughtful advice around:
Using tools like the ATA and Dynamic Risk Reward for consistent sizing
Implementing daily and weekly circuit breakers
Recognizing the importance of data collection and analysis to overcome fear
Adopting a probability-based mindset
Slatitude39 recorded the chat for study and expressed appreciation for Manny’s clear structure.
Lessons Learned
Great trades follow great plans. Manny’s trade was successful because it matched his pre-defined conditions exactly.
Execution depends on confirmation, not prediction. Letting delta and order flow guide entries made all the difference.
Risk management remains foundational. The room reiterated the value of using stops, setting limits, and stepping away when needed.
Flexibility matters. Traders adapted well despite tech issues, emphasizing professionalism and process.
Looking Ahead – Friday (Capital Preservation Day)
David noted the potential for a Breakout Friday, with range edges now clearly defined after Thursday’s balanced session.
Traders are encouraged to stay disciplined, patient, and ready to act if expansion unfolds.
Final Thought from David:
“Don’t put a down payment on that Lambo just yet...”
A fitting reminder to stay focused on consistency and capital preservation over flashy wins.
DTG Room Preview – Friday, December 5, 2025
Futures & Rates:
US stock futures slightly higher ahead of delayed Core PCE (8:30am ET), a key Fed inflation gauge.
A hotter-than-expected PCE print could challenge 87% odds of a Dec 10 Fed rate cut (per FedWatch).
Labor & Economy:
71K job cuts in November (Challenger report), citing restructuring, tariffs, and AI shifts.
Unemployment claims fell to lowest since Sept 2022 — suggests a gradually cooling labor market.
Ongoing narrative of a “K-shaped” economy: High-income spending props up services sector; low-income households remain strained.
Policy & Politics:
Bipartisan push to ban stock trading by lawmakers gains steam via discharge petition led by Reps. Luna and Burchett.
Petition already has 10 GOP signatures, including 3 first-time supporters; needs 218 to force vote.
Data & Earnings:
No notable earnings today or Monday.
Packed data slate today: Core PCE, UoM Sentiment & Inflation Expectations, Personal Income & Spending (10:00am), Consumer Credit (3:00pm).
Market Technicals & Sentiment:
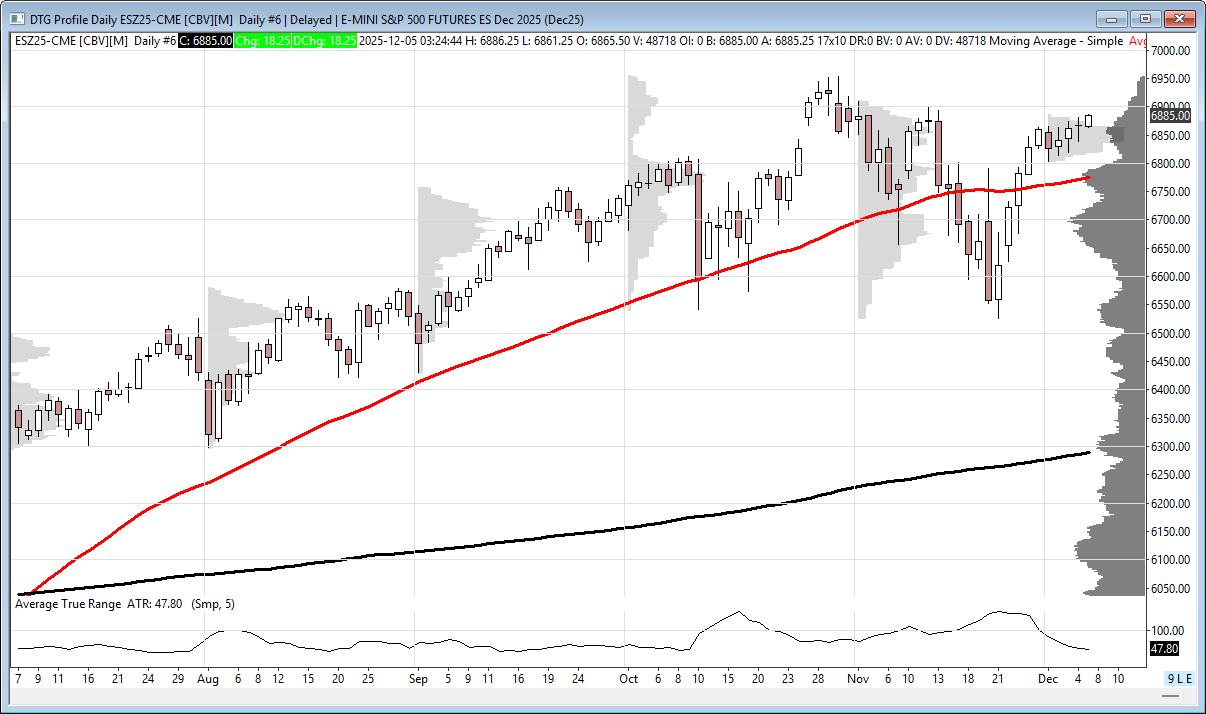
Volatility contracting: ES 5-day ADR down to 50.75 points.
Whale positioning slightly short into 8:30am data on light overnight large trader volume.
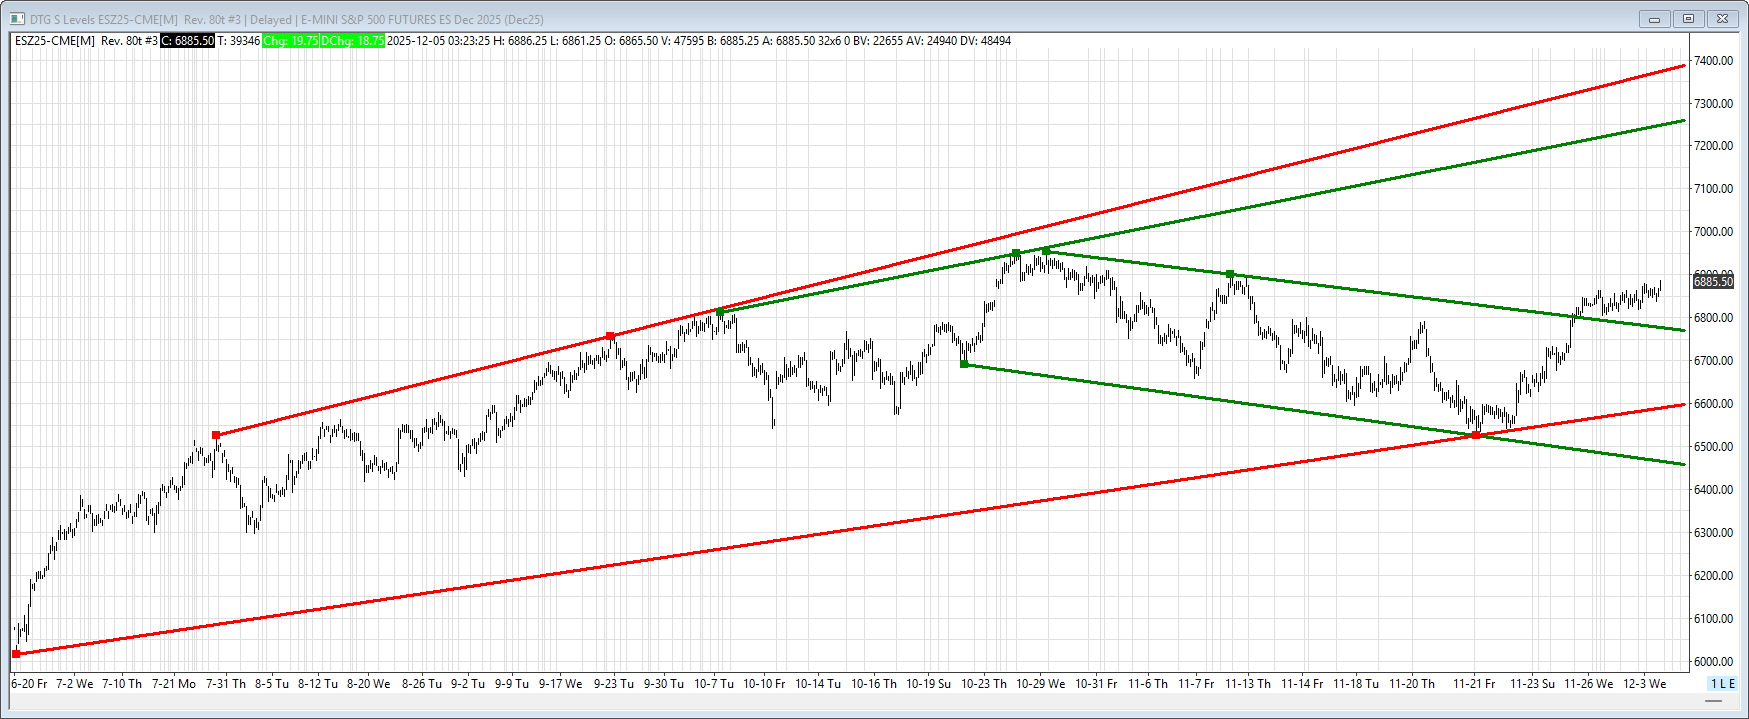
ES trend remains sideways; watching:
Support: 6775/72s (TL & 50-day MA), 6595/00s, 6458/53s.
Resistance: 7255/60s, 7385/90s.
Affiliate Disclosure: This newsletter may contain affiliate links, which means we may earn a commission if you click through and make a purchase. This comes at no additional cost to you and helps us continue providing valuable content. We only recommend products or services we genuinely believe in. Thank you for your support!
Disclaimer: Charts and analysis are for discussion and education purposes only. I am not a financial advisor, do not give financial advice and am not recommending the buying or selling of any security.
Remember: Not all setups will trigger. Not all setups will be profitable. Not all setups should be taken. These are simply the setups that I have put together for years on my own and what I watch as part of my own “game plan” coming into each day. Good luck!!
Follow @MrTopStep on Twitter and please share if you find our work valuable!