- The Opening Print
- Posts
- Cold Water on the AI Bubble — But This Bull Ain’t Backing Down
Cold Water on the AI Bubble — But This Bull Ain’t Backing Down
Danny Riley
February 26, 2026
Follow @MrTopStep on Twitter and please share if you find our work valuable!
Our View
I remember a few things the PitBull used to say to me when I was on the floor: “You’re only as good as your last call”, and " It’s not your money until you get out”. I continue to think we live in an ever-changing world where nothing stays the same, and that things we used to use to make money don’t work anymore. When we find something new that does, it only lasts until it’s coded into an algorithm, HFT, or AI bot.
What I do believe is that NVDA’s earnings threw cold water on the “AI bubble” talk and that there is just too much big money supporting it to fail. Is this a switch from something I said in the past? No, it’s not. As I have said many times, I’m a bull, and while I have said I am a pessimistic bull, I have never said I was a bear or turning bearish. I think the markets and the news do that to the crowd.
Our Lean
The ES has been up and has closed higher in 5 of the last 7 sessions, up 109.25 points or +1.59%, and is down modestly on the month, with only one session left for February. The SPX cash is now up 1.47% on the year and up 0.1% in February. I think a lot of traders have been more interested in NVDA’s earnings than the end-of-the-month options expiration and rebalance. According to Rich from @HandelStats, historically, yesterday was the most bullish day of the week, and if the ES closes higher today, Friday is an up day. I know most think the ES is going to be down on Friday, but I’m not sure about that.
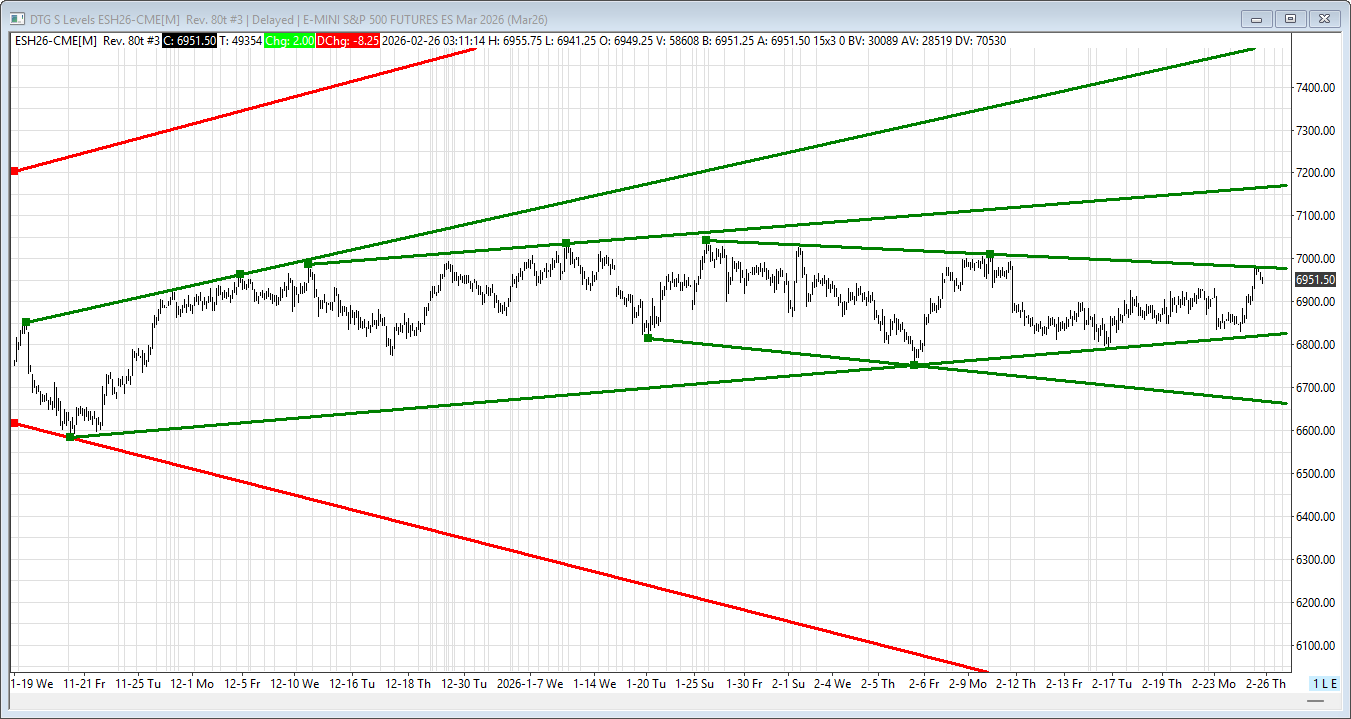
Our lean: I think this all falls in the expect-the-unexpected category. That said, the ES has run an enormous number of stops, especially after the NVDA earnings. While I still think we can go higher, I don’t think the ES goes straight up today. When I look at the ES chart, it looks like the 6949–6930 area could be good support. Unlike yesterday, I know not to sell the open, but if the ES and NQ gap way up, it could be a different story.
The other side of this is I do not think all the shorts have covered and would buy a drop. As @HandelStats said, if today is up, there is a good chance Friday will be up. I’m just concerned about how fast the ES went up after NVDA’s earnings rip. The other thing I’m worried about is the Trump and Iran meeting today.
Ai Price Level Analysis
Level Type | Price Points (High to Low) |
Major Resistance | 7,043.00, 7,036.75, 7,033.71 |
Intermediate Resistance | 7,020.14, 7,006.57, 7,002.45, 6,998.25 |
Minor Resistance | 6,974.61, 6,969.25, 6,965.75 |
--- | --- |
Minor Support | 6,945.25, 6,941.25, 6,939.19 |
Intermediate Support | 6,933.50, 6,931.65, 6,919.77, 6,917.05 |
Major Support | 6,911.81, 6,906.75, 6,899.36 |
Guest Posts:
Dan @ GTC Traders
Our Continued Macro Outlook – February 26, 2026
We all see the economists get up on camera on CNBC, or Bloomberg, or Reuters or any of the other financial channels. They make their optimistic prognostications, or their warnings, and what they expect to see.
And we all know that more often than not? They are completely and utterly wrong in their “predictions.” And as that is the case, a track record of their macro-economic outlook is nowhere to be found.
First of all? That is not really how modern macroeconomics works at all.
Modern macro is not about bold, televised forecasts. It is about states, and understanding initial conditions. It is about equilibrium and non-equilibrium dynamics. It is about understanding regimes, regime shifts, structural constraints, path dependency, feedback loops. It is not meant to be reduced to a 45 second soundbite with a price target on the S&P 500 Index.

This is not the place to go into a full discussion of the realities of macroeconomic modeling. Nor is it the place to contrast that rigor with what we see on financial networks. Suffice to say, what you see on screen is not macroeconomics. It is entertainment.
And yet the public face of “macro” is prediction. And those predictions are wrong more often than they are right. Rarely do you see anyone publish a real-time track record. Rarely do you see anyone revisit what they said six months ago.
We take the opposite approach.
At GTC Traders, we maintain a macro outlook. We state it clearly. We update it when necessary. And we do not hide from it. And we are really, really good at it. We keep a list of our macro-economic outlook, at the bottom of our Sample Portfolio page so ones can review exactly what we said, and when. And excuse us for saying so? But we are really, really good at it. I think since 2007, we have what I would call one ‘clean miss’ in understanding the initial state.
But given that skill, it is important to note, that we do not trade off of that macro-economic outlook. Not unless we are desperate to lose money. That may sound counterintuitive, so let’s explain.
For the moment, we are leaning heavily on quantitative models and structured programs. Discretionary trades are limited. Capital is deployed through defined frameworks, not because of what we see in inflation releases.
So why track macro at all?
We feel that discretion always trumps a quantitative model.
Always.
A model is structured logic. Historical relationships codified into rules. It is disciplined. It removes ego. It enforces consistency. That is precisely why we use them.
Discretion is adaptive.
In 2008, by quantitative triggers alone, we should have been long. The signals were there. The mechanical inputs were firing. By our usual macro-economic outlook, we should have been buying throughout all of 2008.
But we weren’t. We were shorting everything with both hands. Why?
Because the landscape mattered more than the trigger. Credit stress was visible. Liquidity deterioration was visible. The system was shifting states in real time.
When things go wrong, and they always do, you better understand why they are going wrong. Good discretion and adaptability will get you there faster than any model.
That is why we track macro. Not to predict next quarter’s GDP print. Not to front-run CPI. But to understand the terrain.
Which brings us to the present.
Our Continued Outlook on February 26, 2026.
Our stance really has not changed much.
We believe we are at a possible cross-roads in the macro picture. A potential intersection of states. For a long time, we have held that we are operating amid extremely high valuations layered on top of structural inflation pressures, with risk markets sitting in short-term equilibrium. That remains our base case.
But as stated, we are at possible cross-roads. The data crater created by the shutdown came at the worst possible time. Key inputs went missing just as markets were probing the edges of equilibrium. When you are attempting to determine whether a system is transitioning between regimes, missing data does not create neutrality. It creates opacity, which increases risk.
So we are saying the system is harder to read than usual. Possible intersection of states.
Given that backdrop, we feel the correct posture is not aggressive looking for an absolute return profile. We remain quite comfortable targeting as linear a return profile as possible in the portfolio at the present time.
If clarity improves, allocations can adjust. If regimes shift, we can adjust our programs and tune them for more upside. But we will not force exposure simply because someone on television has a confident forecast.
Understand the landscape.
Respect the uncertainty.
Let the models do their job.
And keep discretion sharp for when it is needed most.
Until next time, stay safe and trade well.
Market Recap:

The ES traded down to 6892.50 after the Globex open and at 9:00 pm traded up to 6917.50 as President Trump’s State of the Union address began at 9:35. It sold back off down to 6892.50 at 10:30 pm, rallied back up to 6912.75 at 10:55, fell into a back-and-fill pattern just above the 6900.00 level until around 3:00 am when it fell into another back-and-fill, and traded up to 6917.25 at 5:35 am. It made a slight pullback and then rallied all the way up to 6928.50 at 7:30 am, back-and-filled until 8:30 when it traded down to 6922.00, rallied up to 6936.50 at 9:10, pulled back to 6926.75 at 9:15, and then jumped up to 6936.25 and opened Wednesday’s regular session at 6930.50, up 27.25 points or +0.39% on the day.
After the open, the ES traded up to 6939.99 at 9:50, pulled back to 6931.00 at 10:15, rallied up to 6942.25 at 10:30, pulled back to the VWAP at 6929.00, and then rallied up to 6952.75 at 11:45. It made a small pullback to 6946.50 at 12:05, back-and-filled its way up to 6955.75 at 1:00, made another small pullback and traded up to 6962.25 at 3:00. This was followed by another small pullback down to 6956.00 at 3:30 and then the ES traded 6961.25 as the 3:50 cash imbalance showed $700 million to buy, shot up to a new high at 6965.75 then pulled back and traded 6959.50 on the 4:00 cash close.
After 4:00, the ES traded 6958.25 at 4:20, and a few seconds later, Nvidia (NVDA) reported gangbuster earnings, reporting a 94% increase in profit and record sales for the fourth quarter. This report helped ease concerns over a possible artificial-intelligence bubble that has rippled through markets since October. Nvidia netted $43 billion, up $22.1 billion from a year earlier, on sales of $68.1 billion, up 73% from $39.3 billion a year earlier. In a matter of seconds, the ES rallied up to 6988.00, pulled back to 6969.00, and settled at 6959.75, up 56 points or +0.81%. The NQ settled at 25,382.00, up 353.25 points or +1.41%, the YM settled at 49,534.00, up 0.61%, and the RTY settled at 2,667.70, up 12.70 points or +0.48% on the day.
In the end, I think this post I made in the MrTopStep chat said it all:
@MrTopStep $ES $SPY $SPX $NQ $QQQ
IMPRO:Dboy:[9:34:23 AM]: not surprised by this at all
IMPRO:Dboy:[9:35:12 AM]: we are now above the 6920–6930 zone and into an area of big stops
IMPRO:Dboy:[9:36:12 AM]: when you have such a high level of stops it expands the premium levels that invite buy programs in.
In terms of the ES and NQ’s overall tone, part of the rally felt like a relief rally driven by a bullish State of the Union address, anticipation of Nvidia’s earnings, and rumors of Stripe acquiring PayPal. In terms of the ES’s overall trade, volume was astonishingly low at 999k contracts traded, the lowest volume since 1/27/26.
I am a realist, but I find it funny that so many people said, “They called this move.” I know when I brag about a good call or having a good feel for what is going on, I’m stepping into being wrong. This is how the game is played, but over the past week, I was one of the only people I know pointing out the ES and NQ “back-and-fill patterns,” pointing out how 3:50 imbalances went from big selling to big buying, and Howard Lutnick’s sons buying $140 billion in tech and AI stocks last week. I also know it’s not what we know, it’s what the big-money frontrunners know, and that is more evident today than it ever has been.
On Tap Today
08:30 Jobless Claims
10:00 Fed Vice Chair for Supervision Michelle Bowman testifies to Congress
MiM
The February 25th MOC session opened with a notable buy imbalance that quickly expanded before rotating sharply into the close. At 15:50, the market showed a modest -$42M sell imbalance, but within one minute flipped to a strong +$582M buy skew. Buy programs surged to over $4.1B by 15:51 versus $3.5B for sale, producing a +53.8% dollar lean, although symbol count leaned -52.7%, highlighting underlying two-way rotation beneath the surface strength.
By 15:55, the total imbalance peaked near +$739M as buy pressure held above $4.1B. However, the tone shifted dramatically after 15:56. The tape flipped negative to -$27M and continued to deteriorate, reaching -$596M by 15:59 and closing near -$495M. The final prints showed -64.7% dollar lean, approaching the -66% threshold that signals near wholesale sell-side pressure into the bell.
Sector flows were split but aggressive in pockets. Energy (+74%), Financial Services (+70.3%), and Consumer Defensive (+64.9%) showed strong buy-side conviction, with Energy’s percentage lean particularly notable. Technology finished +62.2% despite heavy two-way trade, while Consumer Cyclical printed +59.8%, reflecting rotation rather than outright accumulation.
On the sell side, Communication Services stood out at -82%, a clear wholesale distribution reading. Utilities (-65.5%) and Healthcare (-58.9%) also leaned negative, while Industrials (-58.2%) saw steady supply.
Single-name flows were concentrated in mega caps. MSFT (+$458M), META (+$361M), NVDA (+$278M), GOOG (+$217M), and AMAT (+$371M) led the buy programs. On the sell side, pressure was evident in Communication names and defensive utilities.
Index-wise, the S&P 500 closed with +$401M imbalance (+52.8% lean), NASDAQ +$433M (+55.7%), and NYSE +$181M (+52.3%), reinforcing that despite the late sell rotation, institutional buy programs were active earlier. Overall, this was a rotational MOC that transitioned from broad accumulation to concentrated sell pressure into the final minute.


Technical Edge
Fair Values for February 26, 2026
S&P: 11.57
NQ: 48.62
Dow: 34.51
Daily Breadth Data 📊
For Wednesday, February 25, 2026
• NYSE Breadth: 53% Upside Volume
• Nasdaq Breadth: 68% Upside Volume
• Total Breadth: 66% Upside Volume
• NYSE Advance/Decline: 58% Advance
• Nasdaq Advance/Decline: 67% Advance
• Total Advance/Decline: 64% Advance
• NYSE New Highs/New Lows: 209 / 55
• Nasdaq New Highs/New Lows: 296 / 110
• NYSE TRIN: 1.20
• Nasdaq TRIN: 0.97
Weekly Breadth Data 📈
For the Week Ending Friday, February 20, 2026
• NYSE Breadth: 55% Upside Volume
• Nasdaq Breadth: 56% Upside Volume
• Total Breadth: 55% Upside Volume
• NYSE Advance/Decline: 59% Advance
• Nasdaq Advance/Decline: 56% Advance
• Total Advance/Decline: 57% Advance
• NYSE New Highs/New Lows: 404 / 116
• Nasdaq New Highs/New Lows: 407 / 492
• NYSE TRIN: 1.19
• Nasdaq TRIN: 1.00
S&P 500/NQ 100 BTS Trading Levels (Premium Only)
BTS are daily generated levels created using a combination of proprietary calculations and AI to define an upper range target and a lower range target, split by a bull/bear line. You receive daily charts along with clear descriptions of each level to help guide your trading.
Take a Free Premium Trial to see them in action.

Economic Calendar Today

This Week’s High Importance

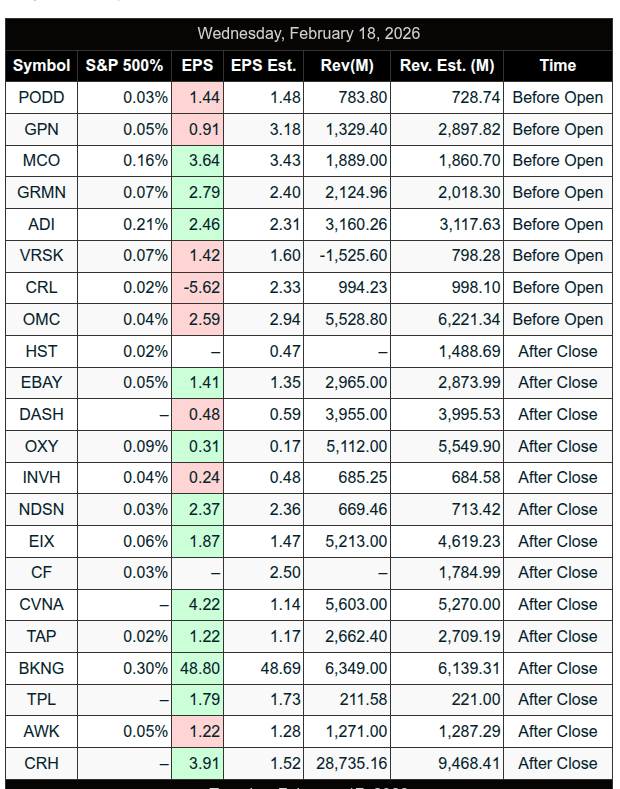
Earnings:

Recent
Trading Room News:
PTG Room Summary – Wednesday, February 25, 2026
Cycle Day 1 – Shallow Pullback → Trend Day Higher
The day began with Manny setting the tone: new day, fresh start, same disciplined process. David came in focused on Cycle Day 1 structure, laying out clear bull and bear scenarios around the 6905 pivot, with upside targets at 6915 → 6920 → 6925 and downside levels at 6895 → 6890 → 6885. As always, the directive was clear: Stay aligned with the dominant force and take only AAA setups with hard stops in place.
Early Session – Targets Hit Quickly
Price wasted no time.
6925 upside target fulfilled early
6895 downside target also tagged before reversing sharply higher
CD1 Upper Penetration Target (6927.49) fulfilled
6935 handle achieved
The key tell of the morning:
A shallow Cycle Day 1 pullback.
David emphasized that this structure often transitions into a strong CD1 rally, and that’s exactly what unfolded. The shallow retracement set the stage for sustained upside expansion.
Mid-Morning – Technical Issues, Professional Execution
Despite frustrating audio and chart streaming issues, David continued guiding the room via typed commentary. No excuses, just execution.
Key developments:
Open Range Longs triggered in ES & NQ
NQ Open Range Target 1 filled
Stops trailed to break-even
Lean remained long on dips
“Money Boz Zone” fulfilled
Above 6945, range expansion signaled further upside potential
There was one stopped-out CL long, handled with discipline — a normal business expense in trend alignment trading.
The leadership remained steady:
“Those that must buy are buying… We can be patient for better trade location.”
That patience paid.
Midday – Two-Way Trade, Bulls Maintain Control
As price rotated in a 6935–6945 sandbox, the market entered a consolidation phase. David highlighted:
Midpoint VWAP as key support
Cluster of gamma strikes nearby
Tight range rhythm
Bulls still had ball control
Importantly, the Cycle Day 1 range projection was 6963 — planted early for awareness.
Afternoon – Cycle Dynamics on Full Display
The afternoon delivered exactly what CD1 structure suggested:
Price pressed into the 6963 CD1 range projection
ES Open Range Target 1 fulfilled (6958.50)
NQ officially fulfilled CD1 Range High Projection (25380.75)
ES officially fulfilled its CD1 range projection
$700M MOC Buy Imbalance supported the close
David noted:
“Today is yet another real example of when Cycle Day 1 has a shallow pullback, it sets up price structure to rally throughout the day.”
It was a textbook demonstration of the Power of the 3-Day Cycle Dynamics.
Key Lessons Reinforced
Shallow CD1 pullback = High probability trend continuation
Early target fulfillment does not mean the move is over.
Open Range setups remain highly effective when aligned with cycle bias.
Stay patient — let forced buyers chase; wait for premium location.
Even with technical disruptions, the process doesn’t change.
Alignment with dominant force > prediction.
Positive Trade Highlights
Multiple upside targets fulfilled (6925, 6935, 6963)
ES & NQ Open Range Longs paid
NQ CD1 projection achieved
ES CD1 projection achieved
Strong trend day captured through structure, not emotion
Overall Tone of the Day:
Structured. Disciplined. Educational. Powerful.
A monster Cycle Day 1 performance and a live case study in trusting the model and staying aligned.
DTG Room Preview – Thursday, February 26, 2026
Markets are digesting strong Nvidia earnings, Unemployment Claims (10:00am ET), and a heavy slate of corporate results today, including Dell (DELL) and Warner Bros. Discovery (WBD) after the close.
Nvidia Highlights
NVDA delivered a major Q4 beat with revenue topping $68B and issued strong Q1 guidance ($76.4B–$79.6B vs. $72.8B consensus).
Data center revenue drove results at $62.3B, with over half coming from hyperscalers.
Guidance excludes China revenue despite a limited license to sell older H200 chips; uncertainty remains around China access.
Stock reaction has been muted, drifting back toward Wednesday’s close after an initial pop.
Macro & Policy Backdrop
Big Tech led Wednesday’s rebound despite renewed concerns about power grid capacity for AI data centers.
The administration signaled companies may need to fund their own energy infrastructure, with firms exploring grid upgrades and alternative power (nuclear, natural gas).
Fed Governor Bowman testifies at 10:00am ET.
Earnings Watch
Premarket: BABA, WBD, LNG, CM, RY, TD, SJM, PEG, and others.
After the bell: DELL, ADSK, INTU, NTAP, RKT, MNST, and more.
No major earnings Friday morning.
Volatility & Positioning
Volatility remains moderately elevated, with ES holding a four-month consolidation below all-time highs.
5-day average daily range: ~84.5 points.
No strong “whale” bias overnight; large trader flow was light and mixed.
Technical Levels (ES)
ES closed back above its 50-day MA (6932.50), now acting as potential near-term support.
Initial Nvidia-driven strength stalled at the downtrend channel top.
Bulls need a sustained break above 6975–6978 to regain upside momentum.
Bears retain broader trendline control unless that level clears.
Trendline Resistance: 6979–6982, 7168–7173
Trendline Support: 6823–6826, 6658–6663