- The Opening Print
- Posts
- FRYday Expiration: War Headlines, Private Credit Wobbles, and the Pit Smells Two-Way Trade
FRYday Expiration: War Headlines, Private Credit Wobbles, and the Pit Smells Two-Way Trade
Follow @MrTopStep on Twitter and please share if you find our work valuable!
Our View
Welcome to the March week two FRYday options expiration.
With all the ups and larger downs, I think it's safe to say that there have been a lot of options rolling and hedging. While I have little concern about the economic release today, it's not just the war in the Middle East and crude oil that is bothering me; it's the private credit that is also haunting me.
Last week, BlackRock stopped redemptions, and yesterday investors asked to cash out 14% of Cliffwater’s $33 billion fund while Morgan Stanley capped withdrawals. It's kind of funny that a friend asked me yesterday about the private credit market that had helped fuel massive growth on Wall Street, and I told him that retail will not be buying, and that was before I read this story.
I don't pretend to know all the ins and outs, but what I can say is that new money going in will slow, which will add selling pressure on stocks. As I have said, if it's not one thing, it's another. While it's not like the 2008 credit crisis, if defaults broaden significantly, the parallels could grow stronger.
Our Lean
If you are looking for me to suggest a turning point, I'm sorry to say that is not in my playbook.
Did Trump have a master plan when he snatched Muduo from Venezuela and redirected oil sales away from Russia and China to the US and India, and then attacked Iran and halted oil sales to China, which has been involved in a giant trade war since his first term? Clearly, Trump has been involved in a shock-and-awe program, but the question is... has it gone too far?
One thing that we know for sure is that both actions have served as a reminder to China of U.S. military capabilities just before he travels to China (March 31-April 2). We already know that there will be discussions on tariffs, possible grain deals, and an order from China to buy 200 aircraft from Boeing. Remember, China is Iran's top oil buyer, and I suspect there could be other discussions on ending the Russia / Ukraine war and how to defuse the war in the Middle East.
Again, I can't rule out some dead cat rallies, but with the war raging on in the Middle East, there should be more risk-off today going into the weekend. I also tried to explain how the rollover can increase volatility, and the best way I can describe it is to think of it like two candy stores selling at once. I'll ask @HandelStats to run his study on the ESH/ESM spread and how to trade it, which has been extremely good at picking the direction.
Our lean: I tried to buy yesterday's open and it didn't work. While there was a double pump, I didn't catch it, but FRYday, the week two options expiration gap-down, should be different, as they have a much higher probability of working — but it's also counter-trending.
My guess is that there is going to be a much larger two-way flow, and one of my rules is that after a big down day, the ES tends to rally on Globex. We shall see!
We are holding a webinar tomorrow at 10:30 CT, 11:30 ET. I really think it's going to be a good one because of the lineup.
David Dube and Manny will lead it off, followed by The Crude Oil Man Reverie, who is a stellar energy trader. In the number three spot is Rich from @Handle Stats, who will be going over two important studies.
Here is the link: From the Pit to Your Screen: MRTOPSTEP’S Next Chapter
Market Profile & Value Area Integration
In Market Profile, the Value Area (VA) represents the price range where 70% of the day’s volume (or TPOs) occurred. Based on your provided High ($6,711.75$), Low ($6,671.00$), and Latest ($6,707.75$), here is the integrated overlay.
Level Type | Price | Technical Significance |
VAH (Value Area High) | 6,708.50 | Just above Latest; indicates the upper boundary of perceived value. |
POC (Point of Control) | 6,698.25 | The "fairest" price where most trading occurred; sits between the Pivot and High. |
VAL (Value Area Low) | 6,684.00 | Key support; sits above the Previous Close ($6,677.50$). |
Revised Levels Table (Integrated)
6,867.85 – 38.2% Retracement From 13 Week High
... [Intermediate Resistance Levels] ...
6,740.75 – Pivot Point 1st Resistance Point
6,711.75 – Session High
6,708.50 – Value Area High (VAH) (Area of potential supply)
6,707.75 – Latest Price
6,706.25 – Pivot Point
6,698.25 – Point of Control (POC) (High-volume attraction node)
6,684.00 – Value Area Low (VAL) (First line of defense for bulls)
6,677.50 – Previous Close
6,671.00 – Session Low
6,668.03 – Target Price
6,643.00 – Pivot Point 1st Support Point
Tactical Observations
The “Value” Tightness:
The current price ($6,707.75$) is trading right at the Value Area High. If the price holds above $6,708.50$, it signals a “Value Area Breakout,” suggesting a trend toward the $6,732 – 6,740$ resistance zone.
The Pivot/POC Confluence:
The Pivot Point ($6,706.25$) is very close to the POC ($6,698.25$). This $8$-point zone is the most critical rotational area. If price falls back into this zone, expect choppy, two-sided trading.
The Gap to Support:
There is a significant technical gap between the Session Low ($6,671.00$) and the 1st Support Point ($6,643.00$). If the Value Area Low ($6,684.00$) fails, the move down could be rapid until it hits that $6,643$ pivot.

Guest Posts:
 |
Get instant access to our partners’ real-time market data and insights not available anywhere else. Here is last night's Founder’s note getting you ready for today’s market and explaining the constraints in yesterday’s market. - MrTopStep
Founder's Note:
The stock market tumbled on Thursday as oil prices surged, with WTI crude trading around $96.22 (+9.87%) at the time of writing. SPX closed at 6,673 (-1.52%), finishing below the Put Wall at 6,700.
QQQ and IWM both showed relative weakness. QQQ closed at 597 (-1.72%), also below the Put Wall of 600. IWM closed at 247 (-2.15%), also below the Put Wall of 250.
The volatility complex spiked too, as VIX closed at 27.28 (+12.63%), and VVIX closed at 130.18 (+6.28%). Now VIX closed above the Key Gamma Strike/Call Wall of 25, where dealer short gamma is in play. The fact that VIX and VVIX closed at high of the day showed potential gamma squeeze risk to the upside.
The 99th percentile 0DTE GEX strike at 6670 provided support for the day.

When toggling to 0DTE Net OI, we can see the positions responsible for the day’s 0DTE gamma exposure. A 0DTE iron condor centered around 6,670 and 6,810 opened again around 10:00am ET. These positions appeared more complex than the prior iron condor structures observed earlier in the week.

S&P 500 HIRO finished at -$1.4bn on the day, driven by -$6.7bn in 0DTE call selling partially offset by +$4.2bn in 0DTE put selling. The net negative reading indicates that options flows applied modest downside pressure, with market makers acting as net sellers on the day.

Although 0DTE volatility sellers attempted to compress intraday volatility, fixed strike volatility still rose during the session. SPX ATM implied volatility is currently around 26%. Using the Rule of 16, this suggests the options market is pricing roughly a 1.6% implied move for tomorrow’s PCE and GDP data releases.

As mentioned in Monday’s AM Note, there remains a significant premium between VIX (~27) and one-month SPX realized volatility (~11). Normally this spread is closer to 3.5 points, but it is currently around 16 points, suggesting traders are paying a meaningful premium for volatility.
Notable flows of the day:
We saw 28k lots IWM March 240 puts selling for $1.64 on the Tape, as traders seemed to unwind some of the hedges. We also noticed 12k lots IWM March 236 puts traded for $2.05, seems a put roll but need to confirm via FlowPatrol tomorrow AM.

As we saw more private credit headlines, we also noticed some LQD puts, along with the HYG puts mentioned yesterday. 77k lots March LQD March 108 puts traded for $0.3, which also need to be confirmed via FlowPatrol tomorrow AM.

All TenTen Capital LLC DBA SpotGamma materials, information, and presentations are for educational purposes only and should not be considered specific investment advice nor recommendations. Futures, foreign currency and options trading contains substantial risk and is not for every investor. An investor could potentially lose all or more than the initial investment. Risk capital is money that can be lost without jeopardizing one's financial security or lifestyle. Only risk capital should be used for trading and only those with sufficient risk capital should consider trading. Past performance is not necessarily indicative of future results. VIEW FULL RISK DISCLOSURE https://spotgamma.com/model-faq/disclaimer/
Market Recap

It was another night of ugly Globex and day session trade. The ES traded down to 6705.75, rallied up to 6769.50, and opened Thursday's regular session at 6726.75, down 53 points or -0.79%.
After the open, the ES sold off down to 6714.25, rallied up to 6732.00, then sold off down to 6697.00 at 9:55. The ES then rallied up to the VWAP at 6728.88 at 10:15, before selling off down to 6688.00 at 10:35.
From there, the ES rallied up to a lower high at 6721.25, then sold off down to a new low at 6684.50 at 11:10. The ES rallied back up to the VWAP at 6719.99, sold off down to 6700.50 at 11:45, and then rallied just above the VWAP at 12:05.
The ES then sold off down to 6693.00, rallied up to 6729.25, and sold back off to 6696.25. It rallied up to 6719.25 at 1:03, sold off down to 6695.25 at 1:20, and then rallied up to 6714.00 at 1:40. The ES sold off again down to 6688.75 at 1:55, rallied up to 6708.50 at 2:15, and then sold off down to 6684.75 at 3:05.
The ES had one last push up to 6702.75 at 3:25, then traded down to 6681.25 at 3:45. The ES traded 6683.50 as the 3:50 cash imbalance showed $630 million to buy, then sold off down to 6675.00 and traded 6676.25 on the 4:00 cash close.
After 4:00, the ES traded down to a new low at 6671.50 at 4:10, rallied back up to 6687.50 at 4:45, and traded 6677.50 on the 5:00 futures close, down 120 points or -1.50%.
The NQ settled at 24,560.00, down 423.50 points or -1.7%, and the YM settled at 46,721, down 727 points or -1.53%.
In the end, it was another choppy, headline-filled trading day. In terms of the index markets’ overall tone, they were weak. In terms of the ES’s overall trade, volume was in line with the last 6 sessions at 1.95 million contracts traded.
The ES has closed down 9 of the last 11 sessions:
Point Totals
Total Positive Points: +108.50
Total Negative Points: -390.75
Net Point Change: -282.25
Percentage Performance
Total Percentage Loss: -4.09% (Sum of daily % changes)
Summary Table
Category | Value |
Days Tracked | 11 |
Positive Days | 2 |
Negative Days | 9 |
Largest Single Day Loss | -102.00 (-1.50%) |
Largest Single Day Gain | +57.25 (+0.85%) |
The NQ has been down 7 of the last 10 sessions, with one session unchanged:
Point Totals
Total Positive Points: +714.75
Total Negative Points: -1,536.75
Net Point Change: -822.00
Percentage Performance
Total Percentage Loss: -3.24% (Sum of daily % changes)
Summary Table
Category | Value |
Days Tracked | 11 |
Positive Days | 4 |
Negative Days | 7 |
Largest Single Day Loss | -423.50 (-1.70%) |
Largest Single Day Gain | +372.50 (+1.50%) |
The YM has been down 9 of the last 11 sessions:
Point Totals
Total Positive Points: +488.00
Total Negative Points: -3,304.00
Net Point Change: -2,816.00
Percentage Performance
Total Percentage Loss: -5.80% (Sum of daily % changes)
Summary Table
Category | Value |
Days Tracked | 11 |
Positive Days | 2 |
Negative Days | 9 |
Largest Single Day Loss | -813.00 (-1.67%) |
Largest Single Day Gain | +252.00 (+0.53%) |
The RTY has been down 6 of the last 8 sessions:
Point Totals
Total Positive Points: +52.70
Total Negative Points: -219.60
Net Point Change: -166.90
Percentage Performance
Total Percentage Loss: -5.38% (Sum of daily % changes)
Summary Table
Category | Value |
Days Tracked | 8 |
Positive Days | 2 |
Negative Days | 6 |
Largest Single Day Loss | -59.70 (-2.31%) |
Largest Single Day Gain | +27.20 (+1.08%) |
One thing that sticks out in the summary tables is that there have been little to no rotations; it's been a straight-out sell that shows no sign of letting up.
I read a story that Iran has been planning for this war since the US invaded Afghanistan and Iraq seeking regime change. Iran has implemented a "decentralized mosaic defense" strategy, designed over two decades to ensure regime survival and continued, independent operations by local commanders even if central leadership is severed. This, combined with a "fourth successor" redundancy plan, allows military units, particularly the Islamic Revolutionary Guard Corps (IRGC), to fight independently of the political government.
Here is an informative article about Iran’s strategy: Iran’s ‘Mosaic Defense’ Strategy: Decentralization as Resilience Factor
No need for me to keep saying what I have always said about the war...
On tap today:
8:30 am: GDP (first revision) (Q4)
8:30 am: Personal income (Jan)
8:30 am: Personal spending (Jan)
8:30 am: Durable-goods orders (Jan)
10:00 am: Job openings (Jan)
10:00 am: Consumer sentiment (prelim) (March)
MiM
Market-On-Close Recap
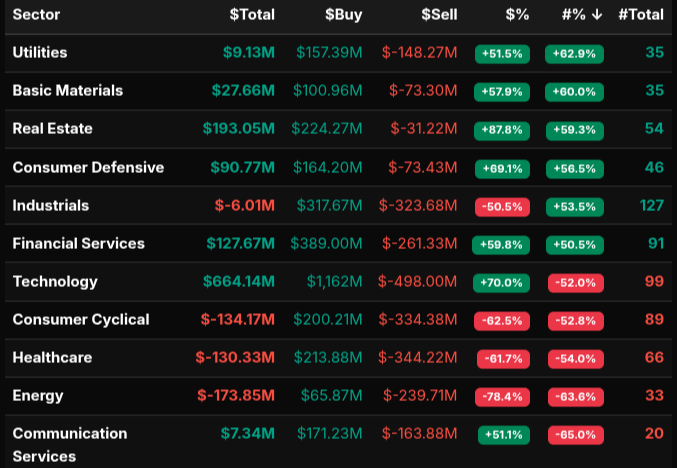
The March 12th closing auction developed through a series of notable transitions as the Market-on-Close (MOC) imbalance evolved during the final ten minutes of trading. At 15:50, the market opened with a modest $13M buy imbalance, but the dynamic quickly expanded as institutional participation increased. By 15:51 and 15:52, buy programs surged to over $3.1B while sell interest approached $2.5B, producing a temporary net buy imbalance of roughly $676M across 692 symbols. This early phase reflected broad participation with relatively balanced symbol counts, suggesting rotation rather than aggressive directional positioning.
The complexion of the auction shifted sharply beginning at 15:53. The imbalance flipped from buy to sell as both imbalance sat at $3B, a clear rotation. From 15:53 through 15:57, the market remained consistently sell-leaning with dollar percentages around -50% to -54%. This range is close to the rotational threshold near ±50%, indicating that although sell programs dominated the dollar flow, the symbol distribution remained relatively balanced. In other words, the auction was seeing broad two-way institutional rotation rather than a pure liquidation event.
Sector activity showed a clear divergence between defensive accumulation and cyclical distribution. Technology was the dominant buyer with $664M of net demand and a strong +70% dollar lean, indicating concentrated institutional accumulation. Real Estate (+87.8%), Consumer Defensive (+69.1%), Financial Services (+59.8%), and Utilities (+51.5%) also saw strong buy-side participation. Real Estate’s +87.8% lean stands out as a wholesale buy program, indicating large basket demand rather than simple rotation.
Conversely, cyclical sectors were notable sellers. Energy posted a -78.4% lean, one of the most extreme readings, signaling heavy institutional supply. Consumer Cyclical (-62.5%) and Healthcare (-61.7%) also leaned strongly toward sell imbalances.
At the individual symbol level, notable buy-side demand appeared in AAPL ($360M), NVDA ($328M), META ($96M), and JPM ($83M), highlighting continued accumulation in mega-cap technology and financials. On the sell side, XOM ($108M), AMD ($71M), and LR C X ($81M) were among the largest contributors to the supply imbalance.
In the final minutes, the auction stabilized and flipped back to a modest buy imbalance of $275M at 16:00. This late reversal suggests that closing liquidity absorbed much of the earlier sell pressure, leaving the market with a net buy bias into the closing print.


BTS Trading Levels - (Premium Only)
ES Levels

The bull/bear line for the ES is at 6694.75. This level is the key pivot for today’s session and will determine directional bias. Holding above this level keeps the market in a short-term bullish posture, while acceptance back below it would shift momentum back to the downside.
ES is currently trading around 6704.75, slightly above the bull/bear line after a volatile overnight session. As long as price remains above 6694.75, buyers may attempt to stabilize the market and push higher toward resistance levels at 6769.50 and 6778.75, which is the upper intraday range target. A sustained push above 6778.75 would open the door for a stronger recovery move toward 6857.75.
If the market loses 6694.75, downside pressure could quickly return. Initial support sits at 6677.50, followed by 6671.75. A break and hold below these levels would likely target the lower range level at 6610.75. If sellers gain control beneath that level, further downside expansion could develop toward 6531.75.
Overall, 6694.75 is the key decision level. Above it, the market has room to retrace higher toward 6769.50 and 6778.75. Below it, the structure remains vulnerable with downside targets at 6677.50, 6671.75, and potentially 6610.75.
NQ Levels

The bull/bear line for the NQ is at 24629.50. This level is the key pivot for today's session. Holding above it keeps the market biased to the upside, while losing it would signal that sellers remain in control.
NQ is currently trading around 24657.00, slightly above the bull/bear line and near the moving average around 24655.25. As long as price holds above 24629.50, buyers may attempt to stabilize the market and push toward the overhead resistance zone.
The first resistance area comes in near 24934.50 to 24949.25, which marks the prior session's open and high area. A break above this zone opens the door for a move toward 25000.75, which is the upper intraday range target. If momentum continues beyond that level, the next major resistance sits at 25350.
On the downside, losing 24629.50 would likely shift sentiment bearish for the session. Initial support below comes in at 24560, followed by 24517.75. If these levels fail to hold, the market could extend lower toward 24258.25, which is the lower intraday range target for today.
Overall, the market is attempting to stabilize just above the bull/bear line after the sharp overnight volatility. Holding above 24629.50 keeps recovery potential alive toward 24934.50 and 25000.75, while trading back below it would likely lead to renewed downside pressure toward 24560 and potentially 24258.25.
Technical Edge
Fair Values for March 13, 2026
SP: 3.33
NQ: 16.37
Dow: 27.13
Daily Breadth Data 📊
For Thursday, March 12, 2026
• NYSE Breadth: 24% Upside Volume
• Nasdaq Breadth: 27% Upside Volume
• Total Breadth: 26% Upside Volume
• NYSE Advance/Decline: 21% Advance
• Nasdaq Advance/Decline: 23% Advance
• Total Advance/Decline: 23% Advance
• NYSE New Highs/New Lows: 62 / 123
• Nasdaq New Highs/New Lows: 64 / 230
• NYSE TRIN: 0.84
• Nasdaq TRIN: 0.81
Weekly Breadth Data 📈
Week Ending Friday, March 6, 2026
• NYSE Breadth: 39% Upside Volume
• Nasdaq Breadth: 54% Upside Volume
• Total Breadth: 48% Upside Volume
• NYSE Advance/Decline: 26% Advance
• Nasdaq Advance/Decline: 32% Advance
• Total Advance/Decline: 30% Advance
• NYSE New Highs/New Lows: 320 / 160
• Nasdaq New Highs/New Lows: 318 / 550
• NYSE TRIN: 0.54
• Nasdaq TRIN: 0.39
Calendars
Economic Calendar Today

This Week’s High Importance

S&P 500 Earnings:
Upcoming:

Recent:

Trading Room News:
Polaris Trading Group Summary - For Thursday, March 12, 2026
Market Context
Cycle Day 3 environment with the 6841.63 objective already achieved earlier in the cycle.
Focus shifted from aggressive directional trading to reading tape and protecting the positive 3-day cycle outcome.
Market condition expected:
Rotation
Balance repair
Possible volatility expansion
Key mindset: Let the market reveal intent.
Key Pivot
6750 ±5 – Line in the Sand
This level determined directional bias for the session.
Bull Scenario (Did Not Materialize)
Acceptance above 6750 could have produced upside continuation.
Upside objectives:
6770
6785
6795
Condition required:
Buyers maintaining value above pivot.
Market failed to accept above pivot, cancelling the bull thesis.
Bear Scenario (Primary Outcome)
Failure to hold 6750 opened the door for rotation lower.
Downside objectives:
6730
6715
6695
Price gradually rotated lower during the morning session and tagged the 6695 target, aligning with:
DTS downside projection
Cycle Day 1 average decline zone 6695–6688
Key Trade Themes
BLT Trade Structure
The room identified a classic BLT setup as weakness developed near highs.
This provided opportunity for:
short rotation trades
fading failed upside attempts.
Dynamic Level / RSPR Discussion
Dan shared execution insights for dynamic level trades.
Key notes:
Limit entries at dynamic levels
161.8 extension can serve as stop reference
Pivot + ~1 point also effective risk parameter.
Profit Management Insight
High-probability behavior observed:
Many D-Level responses stall inside the 25%–75% retracement zone.
Implication for trade management:
25% zone = strong first scale target
Deeper penetration often signals true reversal instead of stall
Excellent trade management concept shared with the room.
Structural Market Notes
Important reminders from the session:
3rd test of a level often breaks
Liquidity grabs occur near obvious levels
Confluence improves trade confidence
Stay aligned with the Dominant Force
Closing Observation
Despite a $627M MOC buy imbalance, the market closed near session lows, which David noted was not constructive for bulls heading into the next session.
Playbook Lesson of the Day
Preparation > Prediction
The roadmap given in the morning briefing played out cleanly.
Traders who followed the plan had:
clear pivot
defined downside targets
structured trade opportunities
The key edge remains:
Patience + Level Discipline + Risk Management
DTG Room Preview – Friday, March 13, 2026
Geopolitics in focus: Middle East tensions remain the primary market driver as the Iran conflict enters day 13 with increasingly aggressive rhetoric from both sides. No clear signs of de-escalation.
Oil surge: Brent crude has jumped roughly 9% and is back above $100, despite US and European strategic reserve releases. Iran has threatened to keep the Strait of Hormuz closed, raising supply concerns.
Rates pressure: 30-year Treasury yields are again approaching 5%, forming a multi-year pennant pattern that could resolve higher. Each move toward 5% has recently triggered short-term equity weakness.
Flight-to-safety absent: Despite geopolitical stress, Treasuries are not catching a safety bid, suggesting investors demand higher compensation to hold long-duration government debt.
Mag 7 weakness: Nvidia, Apple, and Tesla are nearing 10% correction territory from October highs, weighing on the Nasdaq 100.
Economic data focus: A packed calendar due to delayed releases from the government shutdown, including Core PCE, GDP, Durable Goods, and Personal Income/Spending (8:30 ET) followed by JOLTS and Michigan Sentiment (10:00 ET).
Volatility: ES volatility eased slightly but remains elevated with a 5-day average range of ~128.5 points.
Positioning: Overnight large trader flow was light and mixed, leaving no clear whale bias.
ES technicals: Futures continue to trade sideways within a short-term downtrend channel.
Key pivot: ES closed below the 200-day MA (~6700) for the first time since May. The level acted as overnight support (~6697.50) but could become longer-term resistance.
Trendlines: Short-term downtrend channels likely less relevant today, giving both bulls and bears room to operate.
Key Levels
Resistance: 6935/30s, 7250/55s
Support: 6537/32s


Affiliate Disclosure: This newsletter may contain affiliate links, which means we may earn a commission if you click through and make a purchase. This comes at no additional cost to you and helps us continue providing valuable content. We only recommend products or services we genuinely believe in. Thank you for your support!
Disclaimer: Charts and analysis are for discussion and education purposes only. I am not a financial advisor, do not give financial advice and am not recommending the buying or selling of any security.
Remember: Not all setups will trigger. Not all setups will be profitable. Not all setups should be taken. These are simply the setups that I have put together for years on my own and what I watch as part of my own “game plan” coming into each day. Good luck!!
Follow @MrTopStep on Twitter and please share if you find our work valuable!