- The Opening Print
- Posts
- From Puka Beads to GPUs: I’ve Seen This Movie Before
From Puka Beads to GPUs: I’ve Seen This Movie Before
Danny Riley
May 15, 2026
Follow @MrTopStep on Twitter and please share if you find our work valuable!

1999–2000 Tech Bubble
The Tech Bubble didn’t start in 1999–2000. The NASDAQ Composite Index’s meteoric rise began in January 1995, when it was sitting at about 750 points. In January 1996, Federal Reserve Chairman Alan Greenspan famously warned of the market’s “irrational exuberance” in a speech. While the bubble was already building, this marked the point where the risk became a matter of national economic debate.

First, I have to admit I used AI for the dates and times, but I do remember the IPOs and how the Nasdaq kept going up during that time period, and how we had to fight the brokers that filled our NQ futures pit orders and how they ripped off millions, and how I had to fight every broker in the pit.
I also remember the “day trading tech offices” that started popping up in the summer of 1998 and 1999, and how these college “kids” would show up shooting their mouths off about making $200k or more on no-name stocks that had zero balance sheets, jumping in the elevators of 30 S. Wackers wearing shorts, sandals, and puka beads and shooting their mouths off to CME floor traders in the MERC club.
I swear I knew the end was near as the Nasdaq went up day after day, week over week, and month over month. We used to talk about it at the desk, that it was not going to end well.
During the 1999–2000 melt-up, the Nasdaq Composite delivered its best annual performance in history, with an 85.6% rise in 1999 alone, followed by a final 24% surge in early 2000 that saw the index climb from approximately 2200 points from January 1995 to its intraday peak of 5132.52 on March 10, 2000.
I also remember my partner, not much of one, and that in late 1999, when the Nasdaq was eclipsing, he got long the QQQ and held them for over 10 years. It didn’t end well, and it took over 15 years to recover. And the kids from the tech day trading room? Well, they disappeared into the black.
After reaching its “dot-com bubble” peak with an intraday high of 5132.52 on March 10, 2000, the Nasdaq Composite Index entered a devastating two-and-a-half-year bear market that culminated in an intraday low of 1108.49 by October 10, 2002. This staggering 77.9% decline erased over $5 trillion in market value, with tech-heavy indices like the Nasdaq-100/QQQ suffering even sharper drawdowns of nearly 82% and industry staples like Cisco Systems losing roughly 80% of their capitalization.
Unlike modern “V-shaped” rebounds, this recovery was exceptionally slow, as it took until August 2016 — a full 16 years — for the Nasdaq to consistently trade back at its March 2000 highs in nominal terms.
Striking Parallels
The parallels between the current AI-driven rally and the 1999–2000 tech bubble are striking in terms of market structure, characterized by extreme market concentration where a handful of “mega-caps” carry the entire market, with current concentration levels in the top five companies even exceeding those seen during the dot-com era.
Much like the race to lay fiber-optic cable in the late ’90s, today’s infrastructure frenzy centers on GPUs and data centers, with hyperscale capital expenditure projected to reach nearly $690 billion in 2026, a scale unmatched outside of wartime. Both periods share a narrative-driven retail euphoria that dismisses skepticism, leading to “melt-up” behaviors and a decoupling of valuations where AI unicorns reach multi-billion-dollar valuations despite thin profit paths.
However, critical differences remain: while dot-com leaders often had “zero” balance sheets and were loss-making, today’s AI leaders are among the most profitable companies in history, supported by massive cash reserves rather than speculative IPOs, and tech sector forward P/Es remain roughly half of the 60x peak seen in 2000.
Despite these stronger fundamentals, the “DeepSeek shock” of 2025 serves as a modern warning of technological deflation, proving that massive spending doesn’t always guarantee a permanent moat, and the ultimate lesson remains the return on investment. Just as fiber-optic companies went bankrupt before they could monetize their tech, the risk today is that the trillions spent on AI infrastructure may not generate the immediate profits the market currently expects.
I’m not saying that we are going to see a repeat of the tech bubble, but I will say... nothing goes up forever!
Our View
According to the Stock Trader’s Almanac, May monthly expiration day tends to be mixed to slightly negative, unlike some stronger months. Over longer periods since around 1982, the DJIA and S&P 500 have posted modest positive records, roughly 28 advances in 44 years, with small average gains of about +0.15% to +0.20%.
However, May-specific data leans weaker, and recent May expiration days have often closed lower across the major indexes. Small caps, the Russell 2000, have sometimes held up a bit better, finishing near-flat or with tiny gains around +0.01% to +0.04%.
For the full May OPEX week, results are mixed longer-term, since around 1990, about 36 years. The DJIA and S&P 500 have each finished up roughly 18 times and down 18 times, with small average gains of +0.15% to +0.20%, while the NASDAQ has performed modestly better, up about 20 times with an average gain of around +0.42%.
However, in more recent years, since 2009, the week has been noticeably weaker: the DJIA has declined in 12 of the last 17 periods, with similar stretches like 12 of 14 in some updates, posting average losses around -0.77% for the DJIA and -0.60% for the S&P 500. The NASDAQ has also shown net losses in many of those years but has seen some recovery in recent cycles, including gains in 2025.

I am going to say it again: picking tops is hard to do, but I am also going to say that both the ES and NQ are heading to their 7th weekly gain. How much of the Trump/China trip was already priced in? And with today’s stats on the iffy side and no Iran deal, how does all this play out today?
Our Lean: In yesterday’s Lean, I said 7550, and incredibly, the ES got up to 7540. If you haven’t noticed, the NQ rallies on the open, and it doesn’t matter if it’s higher or lower when the markets open.
I am not sure the stats will matter for today’s options expiration, but I do think you have to keep them on your radar. You can sell the early rallies and buy the pullback or, as I have said time and time again, just be patient and buy the drops or pullbacks.
I still see 7650 as my upside objective. I just can’t believe the ES has gone up so much without any 1% or 2% pullbacks.
AI ES Market Profile Technical Map — 05/15/2026
Settlement / Closing Price: 7,525.50
Session Type: Bullish Trend / Price Discovery
Composite Bias: Strong Uptrend Above Prior Value
Resistance Structure
Level | Market Profile Reference |
|---|---|
7,650.00 | Extreme Auction Expansion |
7,620.00 | Long-Term Measured Move |
7,600.00 | Psychological Price Discovery |
7,580.00 | Thin Volume Area / LVN |
7,565.00 | Single-Print Extension Zone |
7,550.00 | Initial Price Discovery Resistance |
Current Market Profile Value Areas
Value Area | Description |
|---|---|
7,520 → 7,540 | Developing Upper Value |
7,500 → 7,520 | Current Acceptance Zone |
7,470 → 7,500 | Near-Term Balance Area |
7,425 → 7,445 | Prior Composite VAH |
7,360 → 7,445 | Major Multi-Session Composite Value |
Support Structure
Level | Market Profile Reference |
|---|---|
7,520.50 | Intraday Acceptance Support |
7,500.00 | Psychological HVN / Pivot |
7,483.75 | Prior Session High |
7,469.50 | Previous Settlement |
7,443.75 | Composite VAH |
7,427.75 | Breakout Acceptance |
7,395.75 | Composite POC |
7,363.25 | Composite VAL |
7,336.25 | Major Buyer Defense |
7,293.50 | Trend Failure Level |
Core Market Profile Metrics
Metric | Level | Description |
|---|---|---|
Point of Control (POC) | 7,395–7,405 | Highest traded volume/time concentration; major price magnet |
Developing POC | 7,515–7,520 | Current session fair-value migration zone |
Value Area (VA) | 7,360–7,445 | 70% of accepted composite trade |
Value Area High (VAH) | 7,443–7,445 | Upper fair-value boundary / breakout pivot |
Value Area Low (VAL) | 7,360–7,365 | Lower fair-value support |
Initial Balance (IB) | 7,471–7,540 | Early session range establishing volatility framework |
Single Prints / Tails | 7,540–7,565 | Aggressive directional buying zone |
High Volume Node (HVN) | 7,500–7,520 | Strong institutional acceptance |
Low Volume Node (LVN) | 7,565–7,580 | Thin auction structure / fast-move zone |
Core Market Profile Concepts
Point of Control (POC): The POC represents the single price level where the market spent the most time or accumulated the most volume during the trading session. It acts as a major institutional reference and often becomes a magnet during rotational or mean-reverting conditions.
Value Area (VA): The Value Area marks the exact range where roughly 70% of the session’s trading activity occurred. This defines the market’s accepted fair-value region between buyers and sellers.
Value Area High (VAH) & Value Area Low (VAL): VAH acts as the upper boundary of accepted value and often becomes resistance during failed breakouts. VAL acts as the lower accepted boundary and typically functions as support during pullbacks.
Initial Balance (IB): The Initial Balance is the range created during the first trading hour. Expansions outside the IB often signal directional conviction and trend-day potential.
Single Prints / Tails: Single prints occur when price auctions rapidly through an area, leaving minimal two-sided trade. These zones often represent aggressive institutional participation and become important future support/resistance references.
Auction Market Theory Read
Higher Time Frame: ES has fully transitioned into higher-value acceptance above prior composite balance. Value migration continues to trend upward session-over-session. Institutional participation remains strong while price holds above 7,443.
Current Auction Condition: The market remains in active price discovery above historical value. Developing value continues forming between 7,500–7,540. Thin overhead structure above 7,540 increases the potential for accelerated upside continuation.
Profile Shape: The current structure resembles a P-shaped profile, commonly associated with short covering, aggressive initiative buying, and trend-continuation behavior.
Rotation / Expansion Scenarios
Scenario | Expected Auction |
|---|---|
Hold Above 7,520 | Continuation toward 7,550–7,580 |
Acceptance Above 7,540 | Fast Price Discovery Expansion |
Reject 7,540 | Rotation Back Into Value |
Lose 7,500 | Move Toward 7,470 Balance |
Lose VAH 7,443 | Reversion Toward Composite POC |
Hold Above 7,470 | Bullish Auction Remains Intact |
Dynamic Profile Indicators To Track
Indicator | What It Signals |
|---|---|
Developing POC Migration | Whether value is shifting higher or lower |
VAH Acceptance/Rejection | Breakout confirmation vs. failed auction |
IB Range Extension | Potential trend-day development |
Single Print Preservation | Institutional control remains active |
Volume at Price | Confirms acceptance or rejection |
Delta Divergence | Buyer/seller aggression imbalance |
Overnight Inventory | Positioning risk into RTH open |
HVN/LVN Reactions | Balance vs. acceleration behavior |
ES AI Professional Market Profile Summary
The ES auction remains firmly bullish, with continued higher-value migration and developing acceptance above 7,500. Composite structure strongly favors buyers while above the prior value high near 7,443.
The most important active market profile zone is the developing upper distribution between 7,520–7,540. Acceptance above this area likely opens a fast-moving price discovery auction toward 7,550–7,650, while rejection could trigger rotational movement back toward prior composite value.


 |
Get instant access to our partners’ real-time market data and insights not available anywhere else. Here is last night's Founder’s note getting you ready for today’s market and explaining the constraints in yesterday’s market. - MrTopStep
Founder's Note:
PM Note
The S&P 500 and Nasdaq rallied to fresh all-time highs ahead of May OPEX.
SPX closed at 7,501 (+0.77%), above the Call Wall level of 7,500. VIX edged lower to 17.3, while VVIX fell 4 points to 94.
Switching from the market maker lens to the customer lens on TRACE, we initially saw roughly 26k contracts at the 7,525 strike. That position grew to more than 40k contracts by 10:45 ET.
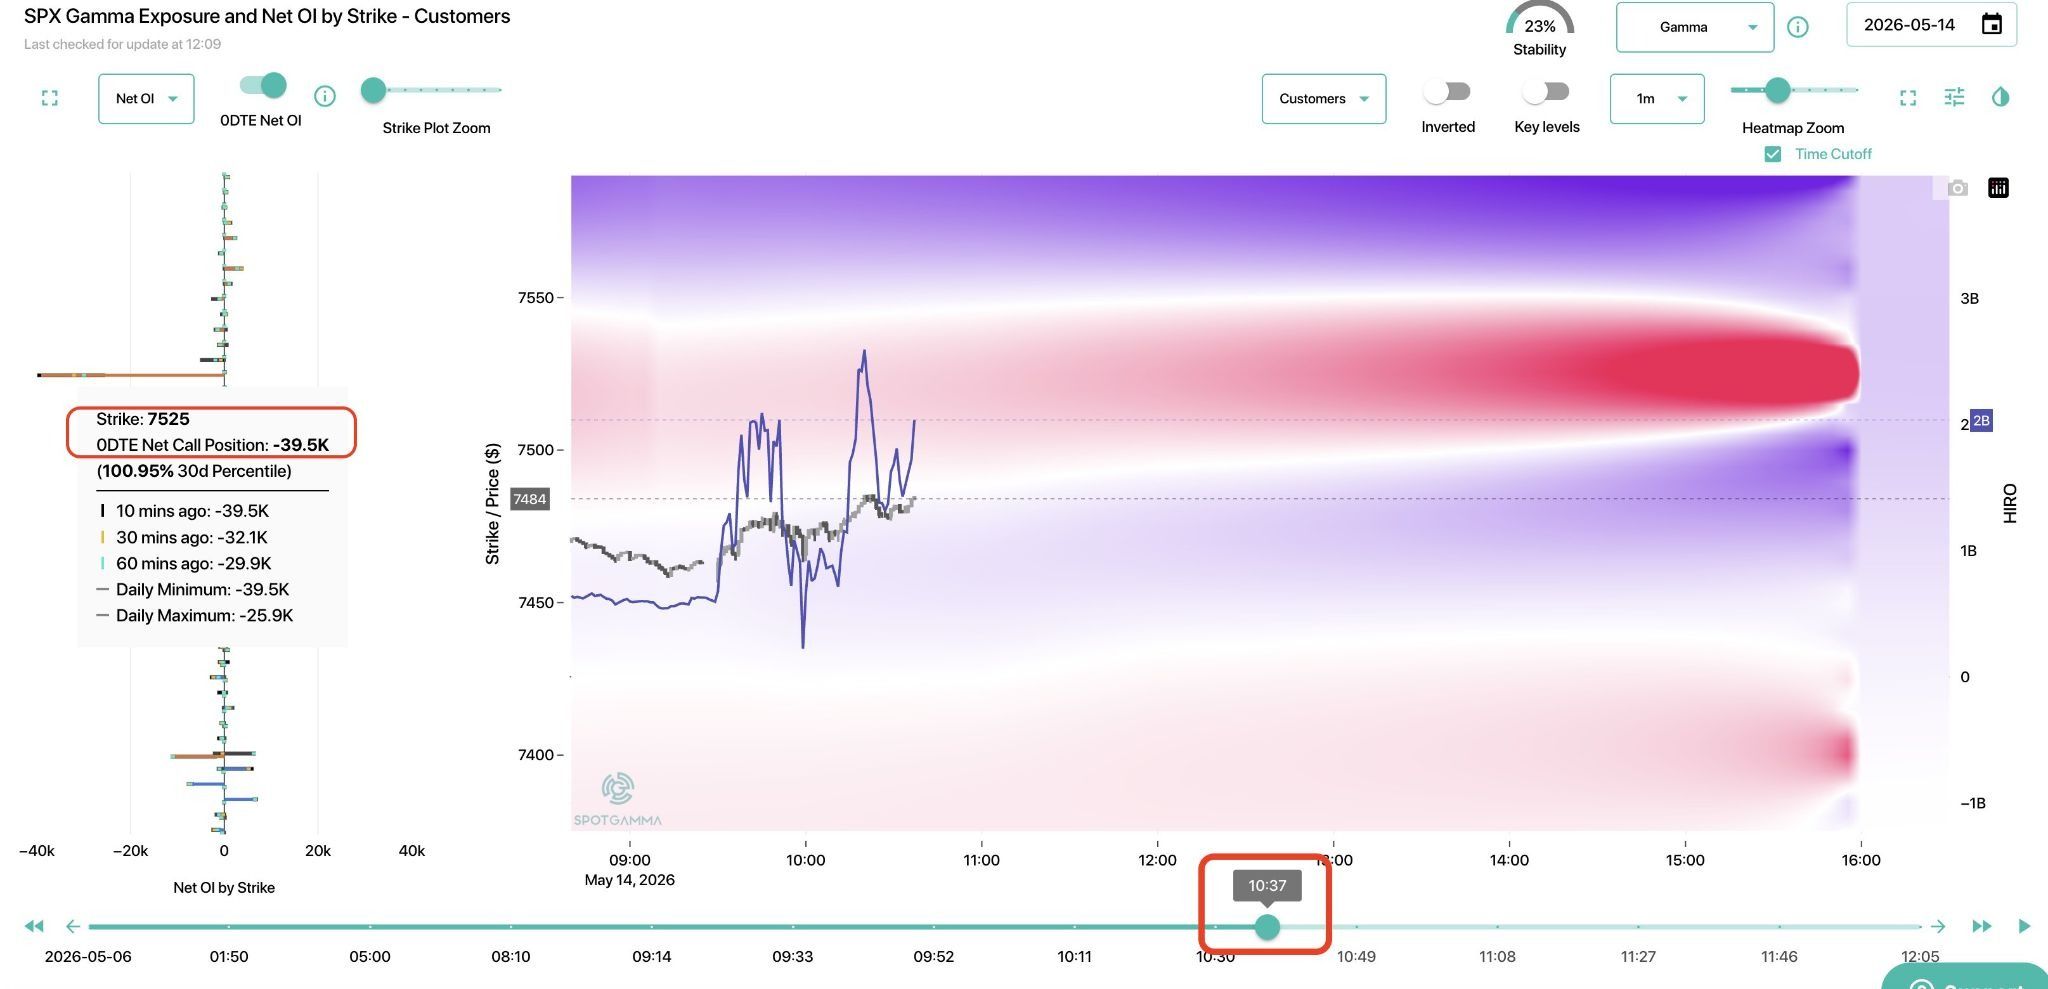
Those positions were then closed and appeared to roll higher into the 7,550 strike, where roughly +28k contracts were added.

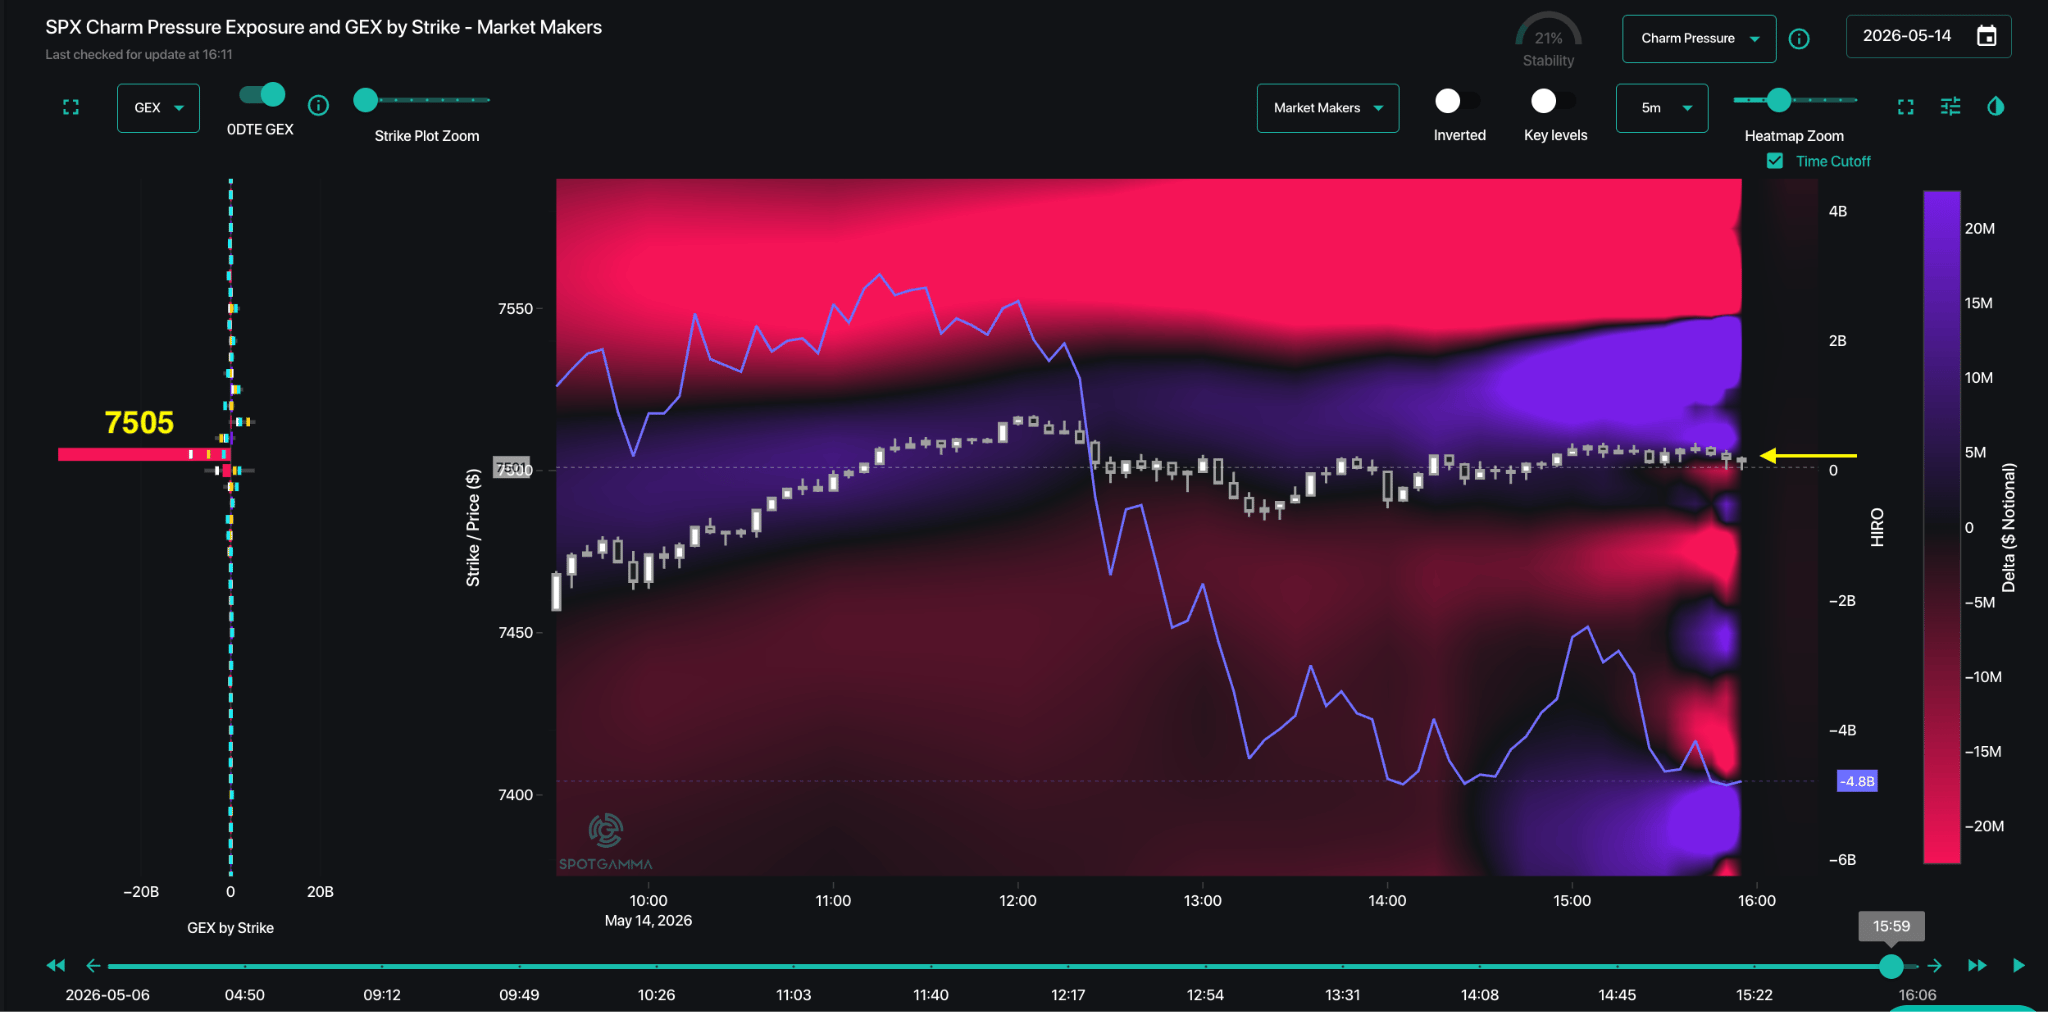
HIRO flow reversed sharply after 12pm ET, falling from +3bn delta to -5bn delta by the close. This suggests dealers needed to sell approximately 8bn of delta to hedge positioning. Switching back to the market maker lens, we saw the 99th percentile gamma strike shift to 7,505.
HIRO tracks cumulative customer delta from aggressive call and put trades throughout the session and is often used to infer dealer hedging behavior and directional flow.
Using the TRACE charm heatmap, we could also confirm the “pinning area” around the 7,505 strike, which is the same level as the GEX bar on the left. The gamma trade also worked well for the end-of-day scalp, as the 7500 0DTE calls rose from $0.25 to $1.00 during the final 10 minutes before the close (+300% gain).
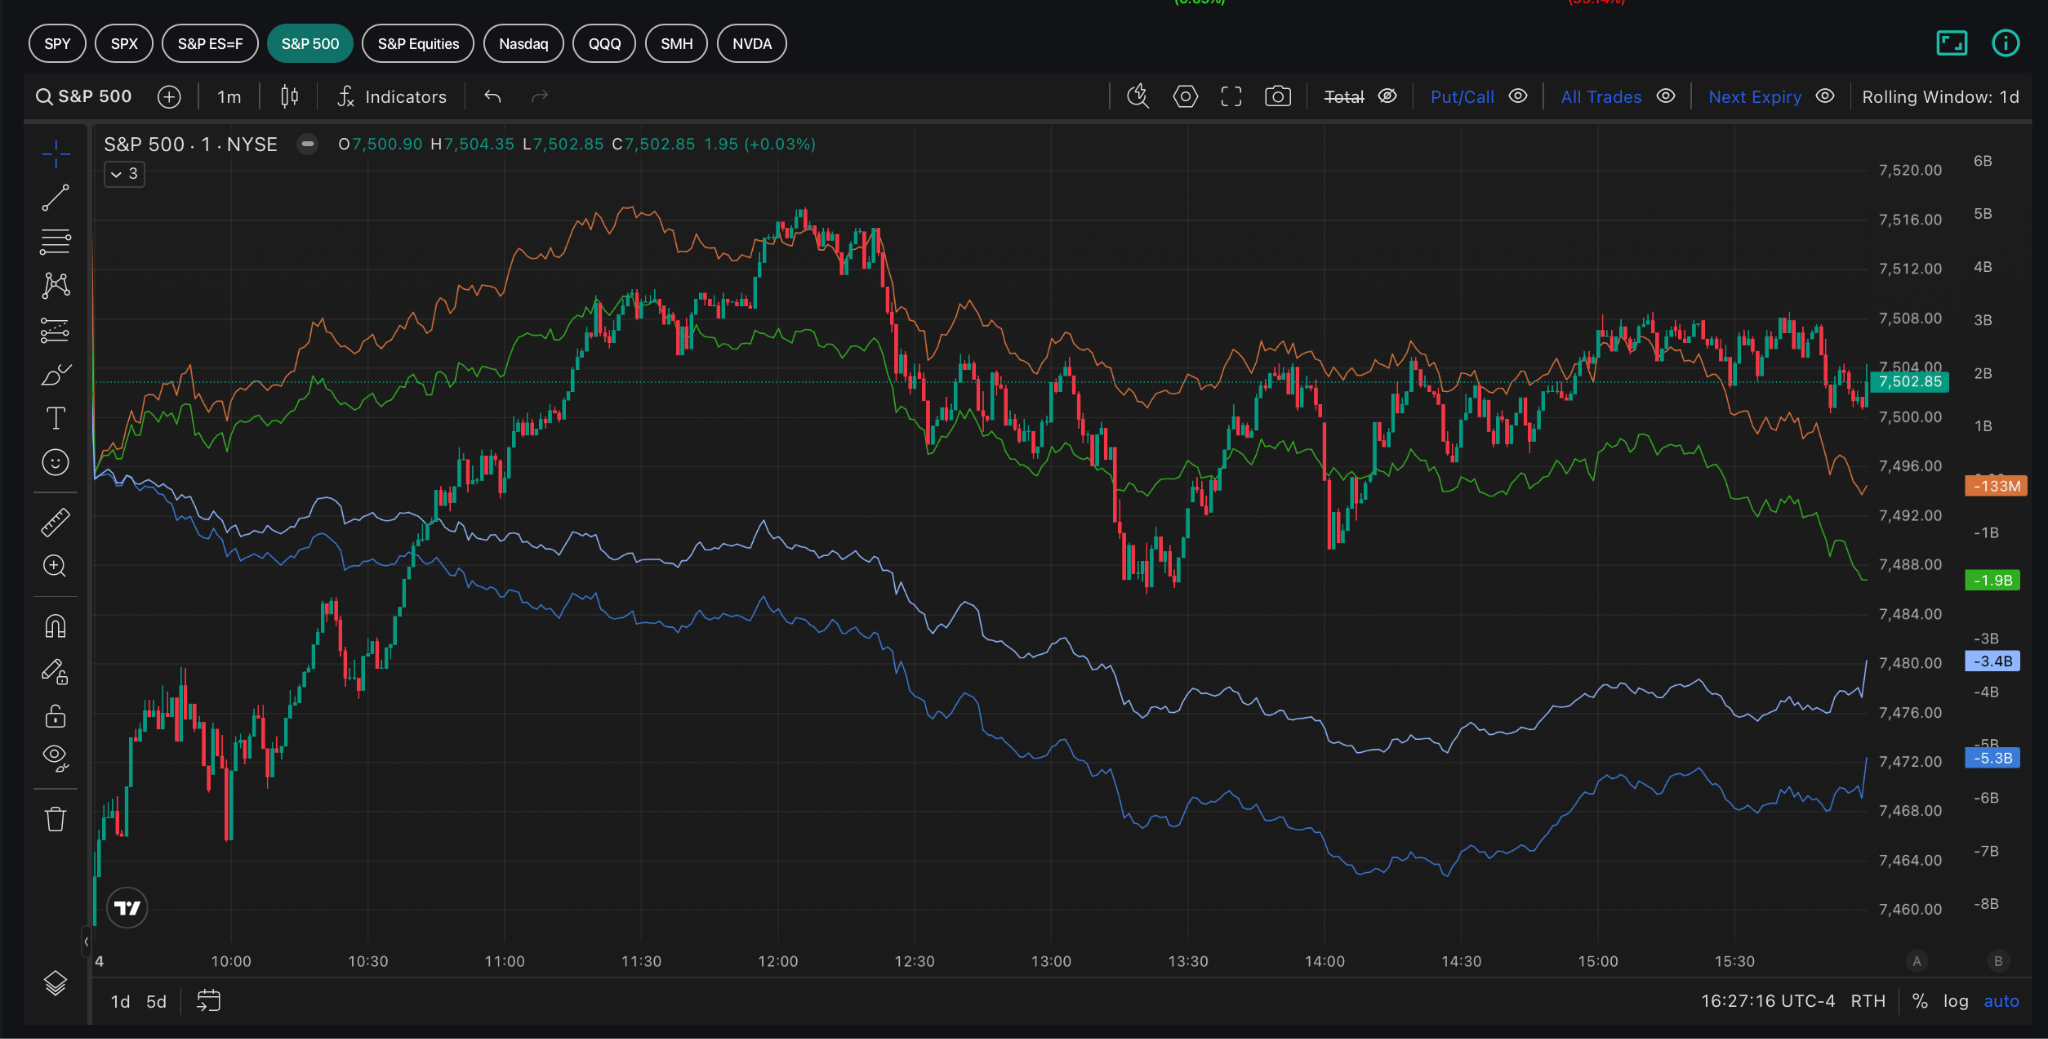
S&P 500 HIRO closed at -5bn delta on the session, driven primarily by longer-dated put buying (dark blue line). Traders seem to utilize the cheap vol to hedge before May OPEX tomorrow and NVDA earnings next Wednesday.
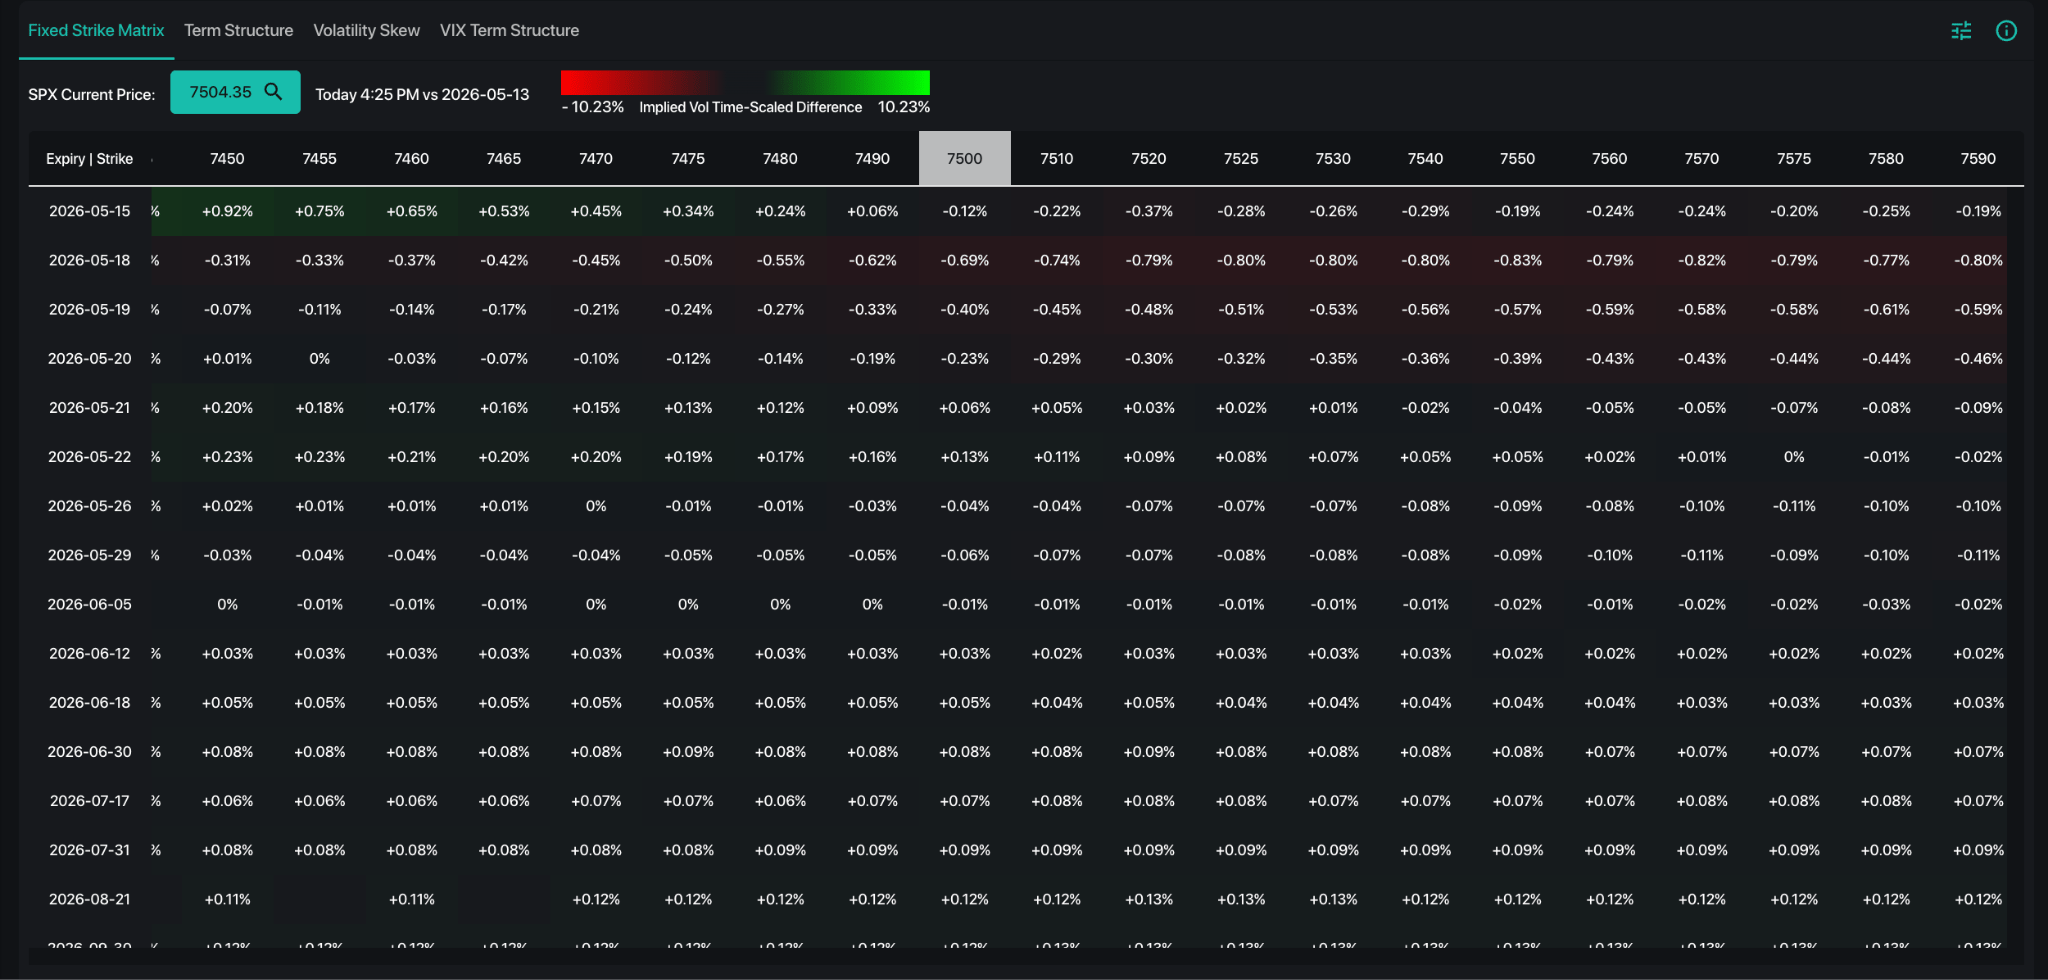
Fixed Strike Volatility was relatively flat on the day, while SPX implied volatility for tomorrow closed near 13%. As discussed in the AM Note, realized volatility has fallen to its lowest level since early February. SPX 30-day realized volatility is now near 10%.
Notable flows of the day:
NVIDIA (NVDA): We observed some profit-taking activity in NVDA. Approximately 12k contracts of the 230/360 call spread traded, generating roughly $13.8 million in premium collected. NVDA closed at 236 (+4%), above the Key Gamma Strike Call Wall level of 230. The stock is now up 24% year-to-date.

Memory ETF (DRAM): A trader bought 10k July 40 puts for roughly $1.3 million, likely fading or hedging the sharp rally in the computer memory sector. DRAM closed at 54 (-1%) on the day. The ETF launched just one month ago and has already rallied 84%.

ServiceNow (NOW): A trader bought 5.5k November 105 calls and sold 5.5k November 75 puts (Bullish Risk Reversal) for a net debit of $1.8 million. NOW closed at 95 (+4%) on the session but remains down 41% year-to-date.

All TenTen Capital LLC DBA SpotGamma materials, information, and presentations are for educational purposes only and should not be considered specific investment advice nor recommendations. Futures, foreign currency and options trading contains substantial risk and is not for every investor. An investor could potentially lose all or more than the initial investment. Risk capital is money that can be lost without jeopardizing one's financial security or lifestyle. Only risk capital should be used for trading and only those with sufficient risk capital should consider trading. Past performance is not necessarily indicative of future results. VIEW FULL RISK DISCLOSURE https://spotgamma.com/model-faq/disclaimer/
[email protected] - Ag Focused
Market Minute Grain Market Advisory Newsletter w/ Grain Market Commentary on Commodity Prices

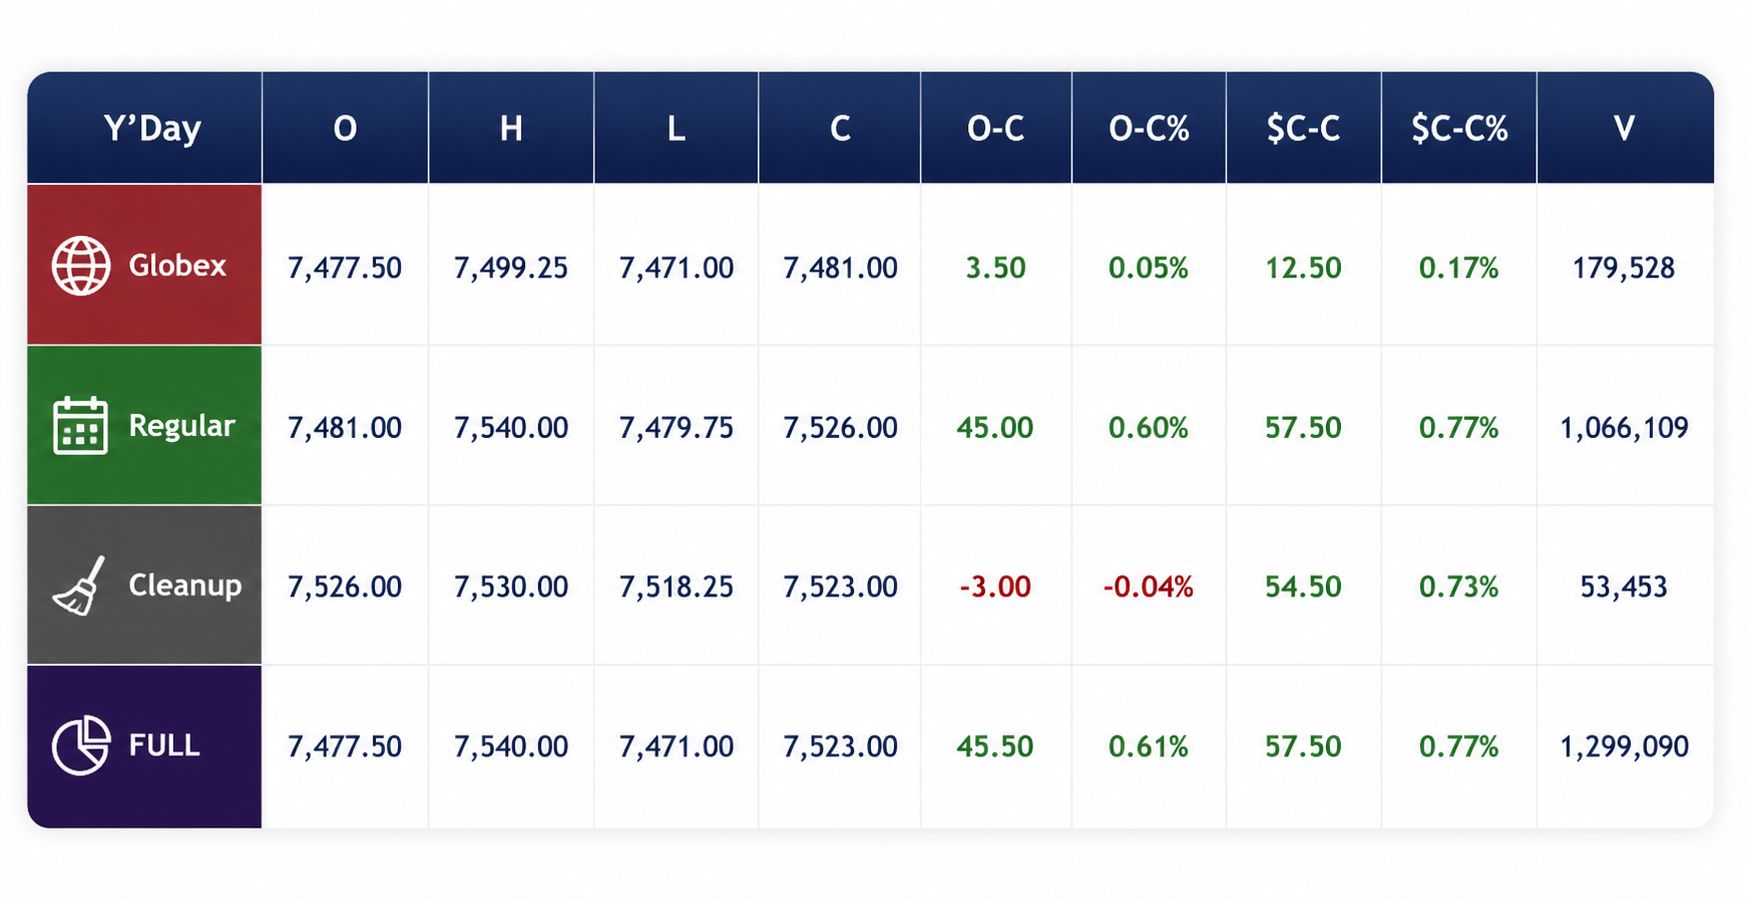
The ES had a 7499.25 to 7473.25 Globex trading range, with 184k contracts traded, and opened Thursday’s regular session at 7481.00, up 12.50 points or +0.17%.
After the open, the ES traded 7480.00 and did what it does best: rallied up to 7503.25 at 9:50, sold off down to 7485.75 at 9:55, rallied 22.25 points up to 7508.00 at 10:20, and rallied another 25.00 points up to 7533.00. By 11:35, the ES had pulled back to 7526.75 and then rallied 13.25 points up to 7540.00 at 12:05. It sold off just under the VWAP at 7507.00 at 1:20, rallied 20.00 points up to 7527.00 at 1:50, dropped 16.00 points down to 7511.00, and rallied 20.25 points up to 7531.25 at 3:40.
The ES traded 7527.75 as the 3:50 cash imbalance showed $600 million to sell, traded down to 7522.50, traded back up to 7527.00, and traded 7526.00 on the 4:00 cash close.
After 4:00, the ES went up one point to 7527.00 and settled at 7525.50, up 53.50 points or +0.72%. The NQ settled at 29,688.50, up 209.25 points or +0.71%; the YM settled at 50,156.00, up 364 points or +0.73%; and the RTY settled at 2,868.60, up 16.30 points or +0.57%.
In the end, the markets are taking no prisoners. In terms of the ES and NQ’s overall price action, they rally almost every day off the open, and every dip is being bought. In terms of the ES’s overall trade, volume didn’t reach 1 million contracts until 2:16 pm, and total volume was on the low side with only 1.2 million contracts traded.


Market-On-Close Recap
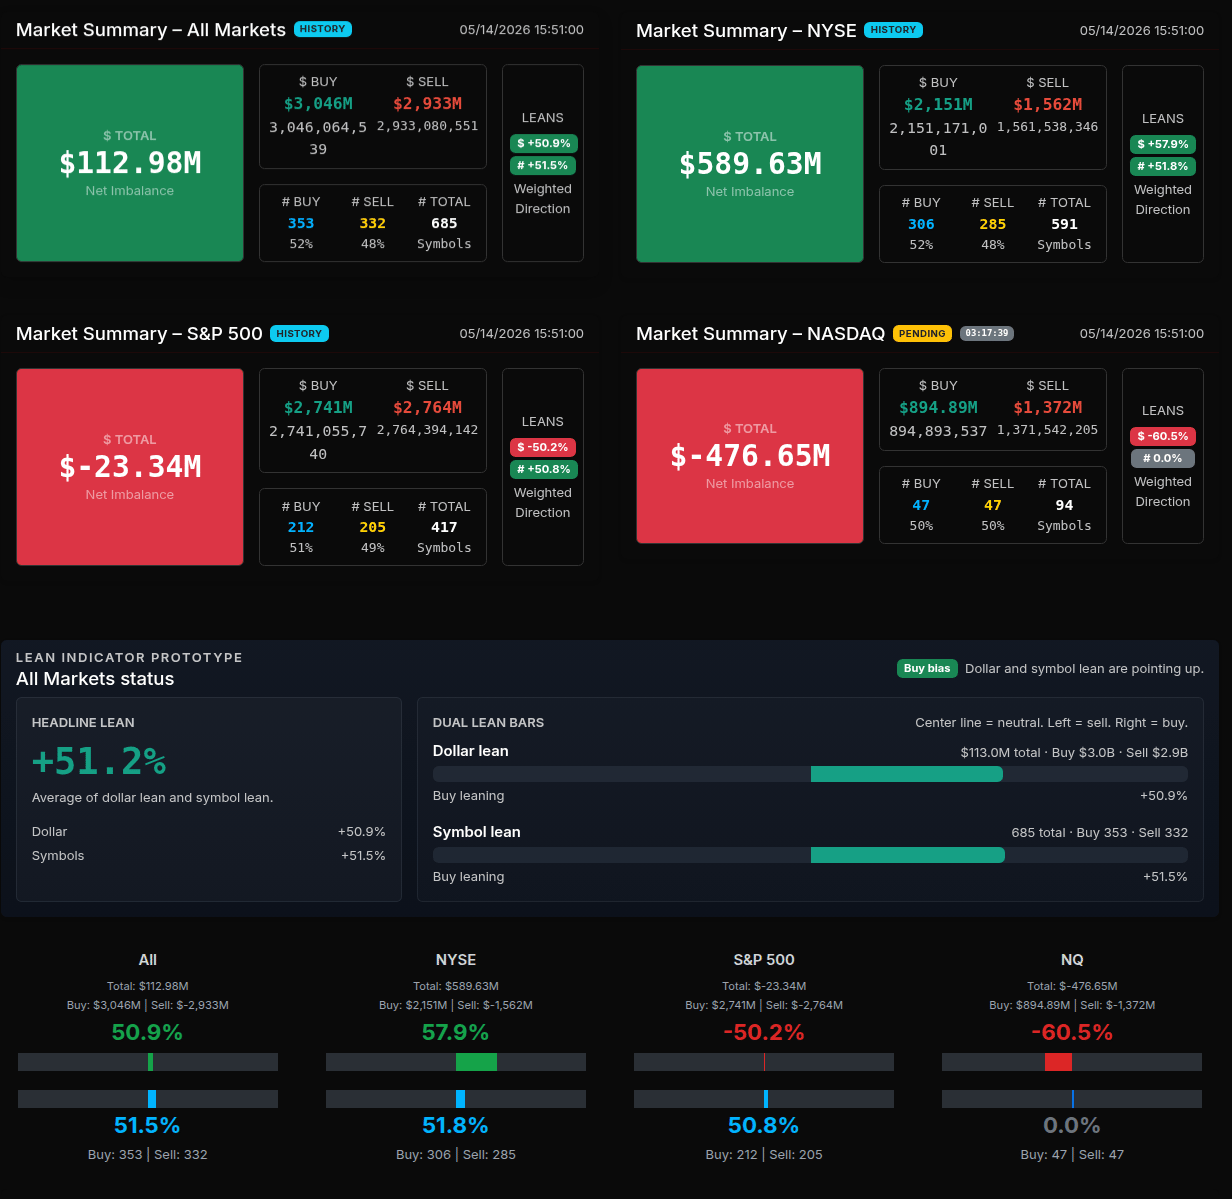
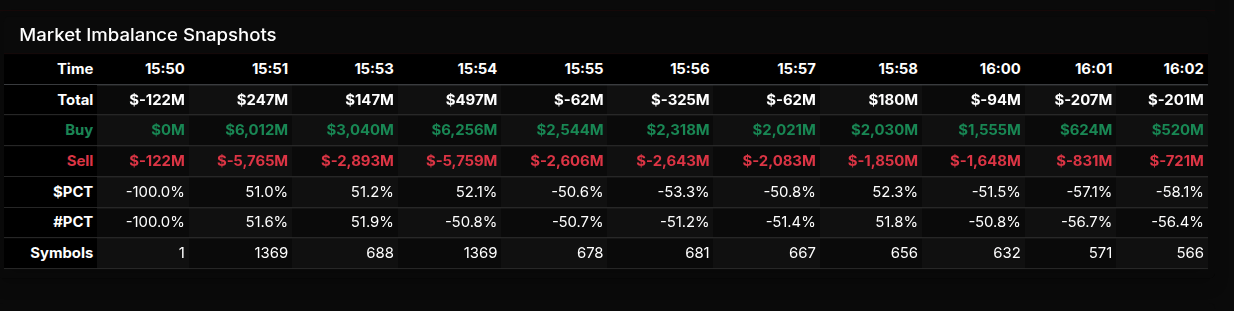
The MOC opened with a sharp, mixed imbalance that quickly expanded into a large two-sided auction. At 15:50, the market showed $6.01 billion to buy against $5.77 billion to sell. That left a modest $247 million net buy, showing broad participation but not a true wholesale buy program. The early lean was near +51%, which is more rotational than aggressive, even though the gross dollar flow was heavy.
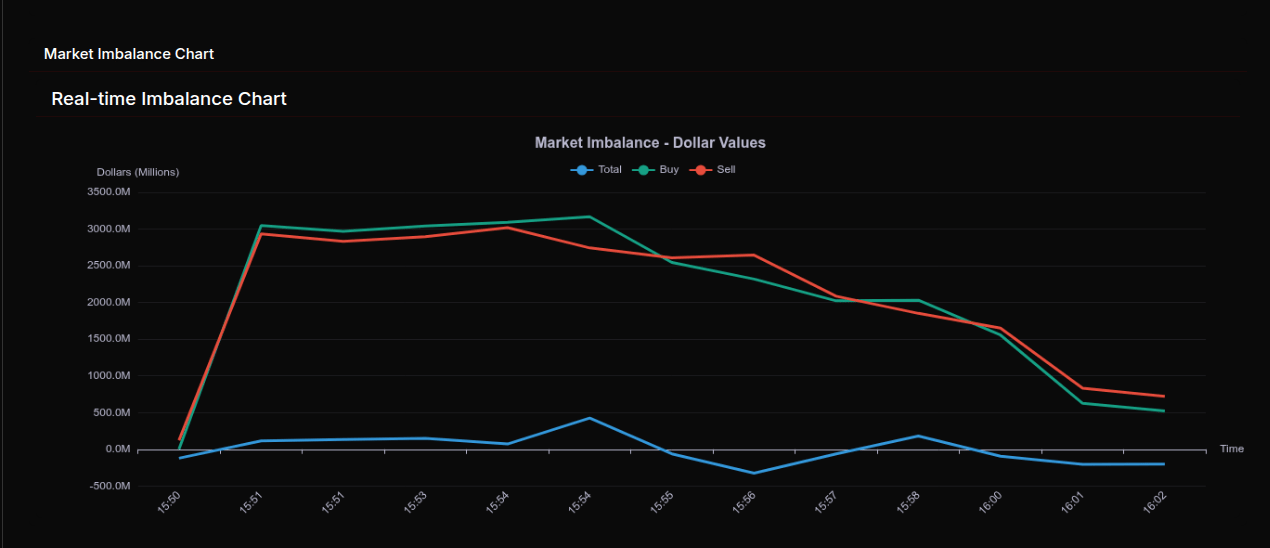
The high-water mark came around 15:54, when buy dollars reached $6.26 billion versus $5.76 billion to sell, producing a $497 million net buy. From there, the auction began to transition. By 15:55, the net flipped back slightly negative, and by 15:56, the sell side gained control with a $325 million net sell imbalance. The market briefly rotated back positive at 15:58 with $180 million to buy, but that was not sustained. Into 16:00 and after, the close settled into a sell-side finish, ending near $201 million to sell at 16:02.
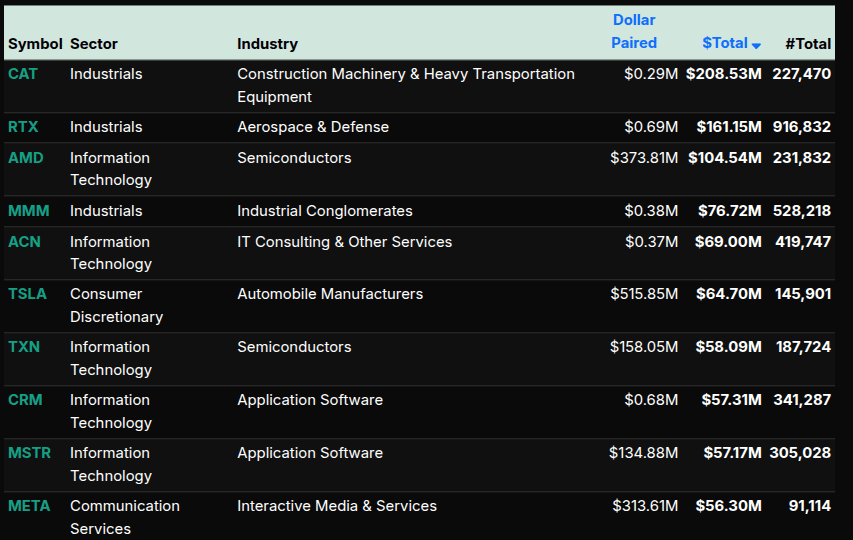
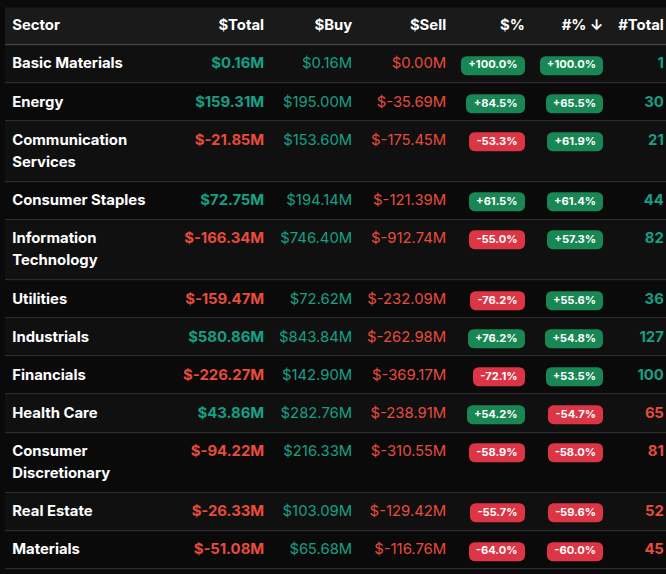
The sector and symbol mix showed where the real activity was concentrated. Industrials were prominent on the buy side, led by CAT at $208.53 million, RTX at $161.15 million, and MMM at $76.72 million. Information Technology also drew meaningful demand, with AMD, ACN, TXN, CRM, and MSTR all appearing in the top dollar imbalance list. Consumer Discretionary showed TSLA with $64.70 million, while Communication Services had META at $56.30 million.
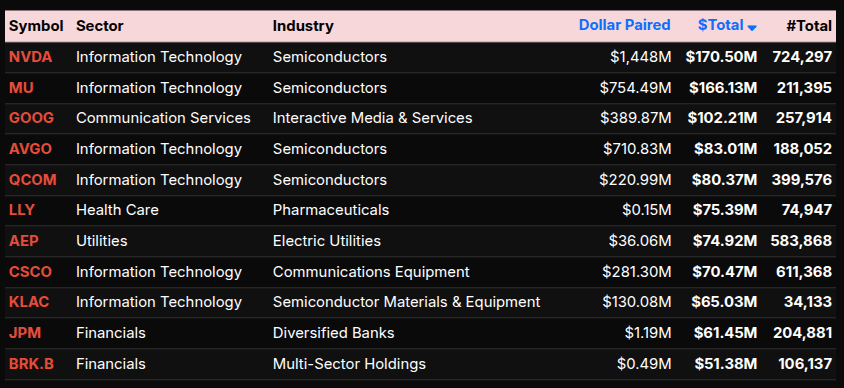
The broader market summary was constructive on the surface, with all markets showing a $112.98 million net buy and a +50.9% dollar lean, while the NYSE was stronger at +57.9%. However, the notable weakness was in NASDAQ, which showed a $476.65 million net sell and a -60.5% dollar lean. That is not quite beyond the -66% wholesale threshold, but it was the clearest institutional sell pressure on the board. The S&P 500 also leaned slightly sell at -50.2%, keeping the close more rotational than decisive.

/

ES Levels
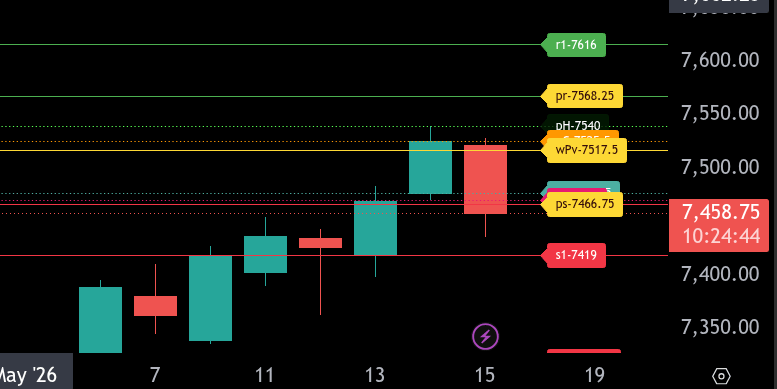
The bull/bear line for the ES is at 7517.50. This remains the key level that must be reclaimed and held for bullish momentum to resume. Below this level, ES remains in a bearish posture, and rallies should be treated cautiously unless buyers can regain control above 7517.50.
Currently, ES is trading around 7458.00, which places price below the bull/bear line and below the lower range target at 7466.75. This signals short-term weakness during the current Globex session. As long as ES remains below 7466.75, downside pressure can continue toward 7419.00, which is the next major support level below current price. The lower range target of 7466.75 now acts as immediate resistance after price slipped below it.
A recovery back above 7466.75 would shift focus toward 7477.50 and 7471.00, followed by the broader decision zone at 7517.50 to 7525.50. If ES can reclaim and hold above 7517.50, a move toward 7540.00 becomes likely, followed by 7568.25, the upper range target for today. Further upside resistance sits near 7616.00 and 7626.25.
On the downside, support is at 7419.00. If ES breaks and sustains below 7419.00, the structure weakens further and opens the door for continued downside extension. Until buyers reclaim 7466.75 and then 7517.50, sellers remain in control of the short-term structure.
Overall, ES remains bearish below 7517.50. The key decision area is 7466.75 to 7517.50: below this zone favors sellers, while a recovery back through it would improve the short-term outlook and shift focus toward 7525.50, 7540.00, and 7568.25.
NQ Levels
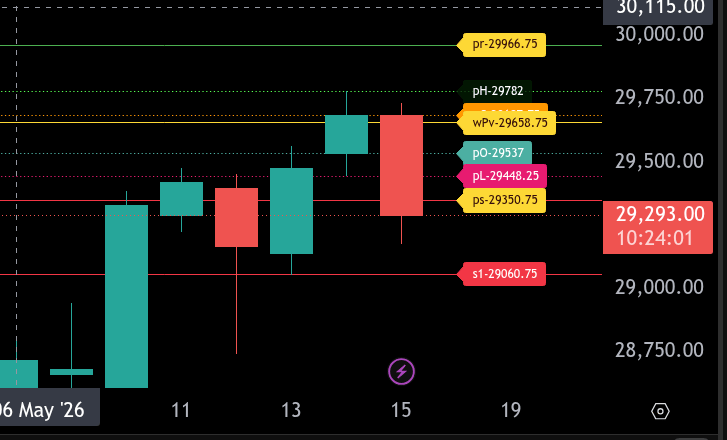
The bull/bear line for the NQ is at 29658.75. This is the key level that must be reclaimed and held for bullish momentum to resume. Below this level, NQ remains in a bearish posture and rallies should be treated cautiously unless buyers can regain control above 29658.75.
Currently, NQ is trading around 29301.50, which places price well below the bull/bear line and below the lower range target at 29350.75. This signals clear short-term weakness during the current Globex session. If NQ remains below 29350.75, downside pressure can continue toward 29060.75, which is the next major support level below current price.
The lower range target for today is 29350.75. Since price is currently below it, this level now acts as immediate resistance. A recovery back above 29350.75 would be the first sign that sellers are losing control, but NQ would still need to regain 29448.25 and 29537.00 before a stronger recovery attempt develops.
On the upside, resistance comes in first at 29350.75, then 29448.25 and 29537.00. Above that, the major decision zone is 29658.75 to 29687.75, with 29658.75 as the bull/bear line and 29687.75 as additional resistance. If NQ can reclaim this zone and hold above it, the next upside target is 29782.00, followed by 29966.75, the upper range target for today.
On the downside, support is at 29060.75. If NQ breaks and sustains below 29060.75, the structure weakens further and opens the door for continued downside extension. Until buyers reclaim 29350.75 and then 29658.75, sellers remain in control of the short-term structure.
Overall, NQ remains bearish below 29658.75. The key decision area is 29350.75 to 29658.75: below this zone favors sellers, while a recovery back through it would improve the short-term outlook and shift focus toward 29687.75, 29782.00, and 29966.75.

Fair Values for May 15, 2026
SP: 22.04
NQ: 102.71
Dow: 88.65
Daily Breadth Data 📊
For Thursday, May 14, 2026
• NYSE Breadth: 60% Upside Volume
• Nasdaq Breadth: 63% Upside Volume
• Total Breadth: 63% Upside Volume
• NYSE Advance/Decline: 60% Advance
• Nasdaq Advance/Decline: 58% Advance
• Total Advance/Decline: 59% Advance
• NYSE New Highs/New Lows: 132 / 45
• Nasdaq New Highs/New Lows: 339 / 158
• NYSE TRIN: 0.99
• Nasdaq TRIN: 0.82
Weekly Breadth Data 📈
Week Ending Friday, May 8, 2026
• NYSE Breadth: 48% Upside Volume
• Nasdaq Breadth: 57% Upside Volume
• Total Breadth: 56% Upside Volume
• NYSE Advance/Decline: 55% Advance
• Nasdaq Advance/Decline: 58% Advance
• Total Advance/Decline: 57% Advance
• NYSE New Highs/New Lows: 370 / 128
• Nasdaq New Highs/New Lows: 854 / 357
• NYSE TRIN: 1.37
• Nasdaq TRIN: 1.03

This Week’s High Importance

Polaris Trading Group Summary - For Thursday, May 14, 2026
Thursday’s session followed the Daily Trade Strategy very well, with ES completing another strong Cycle Day 3 Super Cycle. The room saw the overnight upside target fulfilled, the 7505 DTS level tagged and later defended at VWAP, and the CD3 Statistical Extreme target achieved into the afternoon.
Morning Trade
Overnight trade extended higher and fulfilled the 7495 target, with David identifying 7505 as the next DTS target.
The regular session opened with a neutral lean, with PH and PC called out as key references.
By late morning, ES tagged the 7505 DTS target, confirming the roadmap from the briefing.
David noted MB1 in play, while the room discussed upside pressure and the 7500 gamma level.
Midday Market Read
David highlighted another Three-Day Super Cycle developing.
Market discussion focused on narrow leadership, especially the Magnificent 7 driving index gains.
David’s key observation was that the “Foot Soldiers are NOT following the Generals,” meaning broader participation was weaker than the headline index strength suggested.
The lesson was to respect the trend, but remain aware that leadership was concentrated and not broad-based.
Positive Trades
Nicholas shared a disciplined sell-side trade:
Entry: 7523 at 12:32 PM
Target hit: 7516 at 12:56 PM
David congratulated the trade, reinforcing the value of patience and execution even when a trade feels slow.
The broader room also benefited from the DTS levels, especially the 7505 target and later VWAP hold.
Afternoon Action
After lunch, David called a sell-side shift, giving traders a clear change in tone.
By mid-afternoon, ES pulled back to VWAP near 7505, which David noted was holding beautifully.
ES then consolidated between 7505 and 7525.
Bulls needed to clear the 7525 area to push toward a strong close.
Closing Strength
ES fulfilled the Cycle Day 3 Statistical Extreme Target at 7533.50.
The high of day reached 7540.
David confirmed it as another 3 Day SUPER CYCLE.
The day ended with a reminder that Friday is OPEX and Capital Preservation Day.
Lessons Learned
Trust the DTS roadmap when price is respecting the levels.
Key references like 7505, VWAP, gamma levels, PH, and PC helped frame the day.
Narrow market leadership can still push indexes higher, but traders should recognize the risk when broader participation is lacking.
After a strong three-day cycle, the focus shifts to protecting gains and staying disciplined into OPEX.
DTG Room Preview – Friday, May 15, 2026
Macro Focus: US equity futures traded lower overnight as markets digested the Trump-Xi summit outcome and refocused on inflation and rate concerns.
Rates / Inflation: Treasury yields pushed to 1-year highs as markets price in potential U.S. rate hikes, while the BOJ is also expected to tighten as Japan battles energy-driven inflation and yen weakness.
Geopolitical: The summit carried a business-friendly tone with positive headlines for NVDA and BA, but little progress was made on Iran or Taiwan.
Energy: Oil remains a key risk with the Strait of Hormuz effectively closed, the U.S. naval blockade of Iranian ports still in place, and global inventories draining quickly.
AI / Semis: AI demand remains a bright spot after strong earnings reactions in AMAT and FIG.
IPO Watch: CBRS surged nearly 70% in its IPO debut, opening near double its IPO price as investors position it as a potential Nvidia competitor.
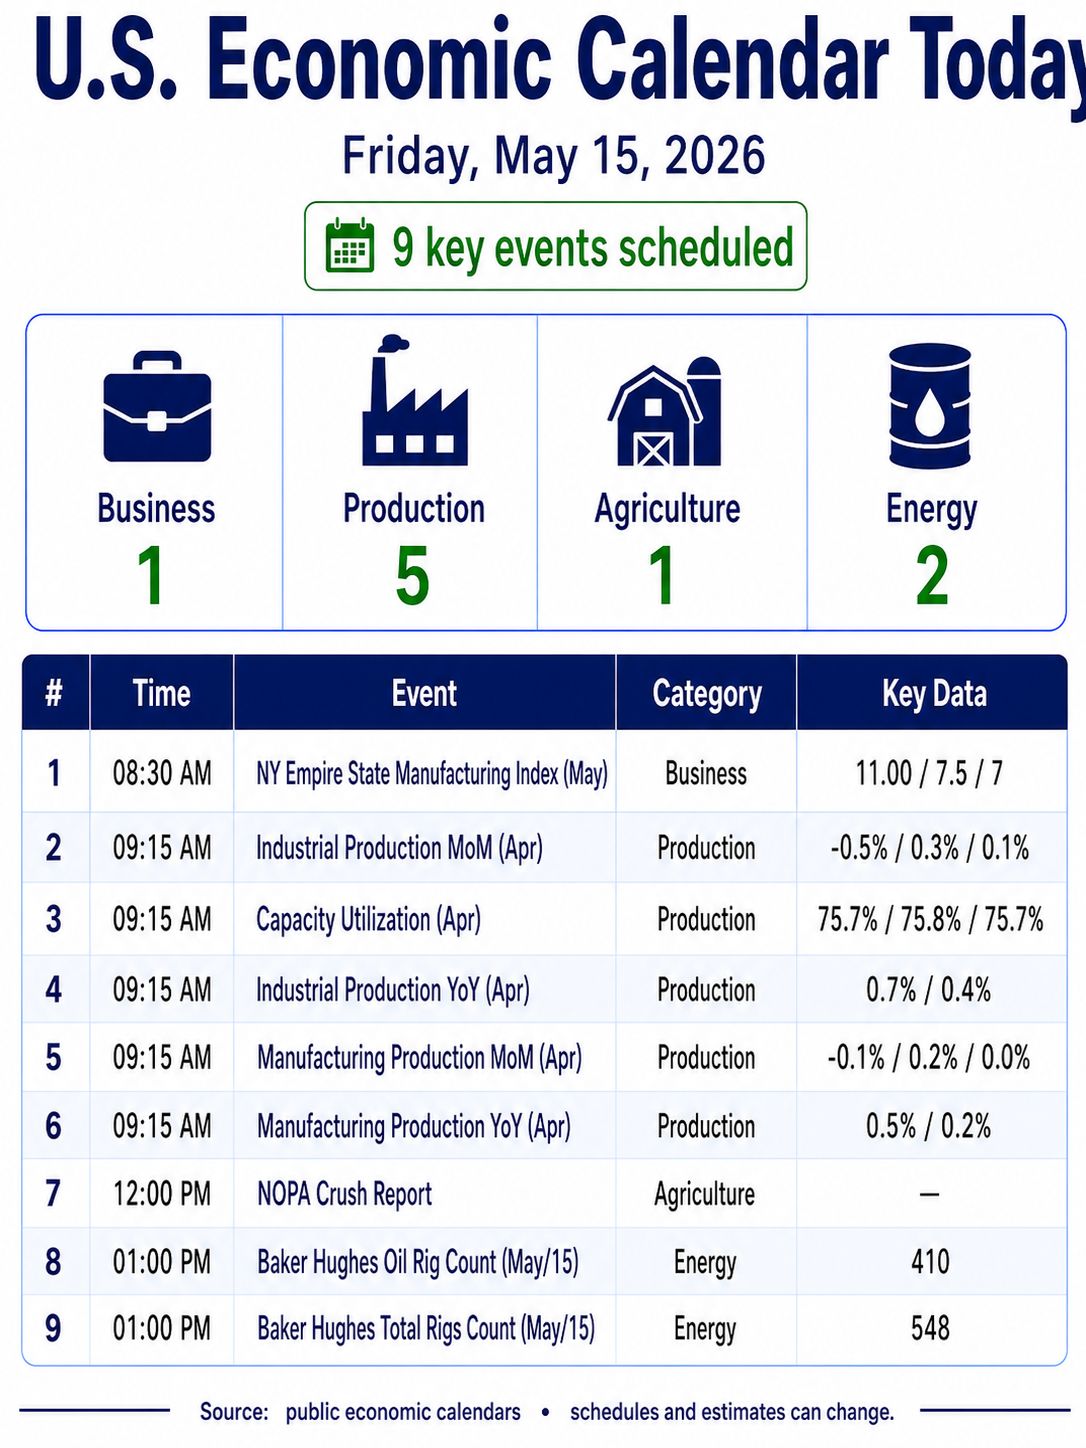
Calendar: Today’s economic calendar includes Empire State Manufacturing at 8:30 ET, followed by Capacity Utilization and Industrial Production at 9:15 ET.
Volatility / Flow: Volatility remains elevated, with the ES 5-day average daily range rising to 78.25 points. No clear whale bias overnight as large trader volume was light and mixed.
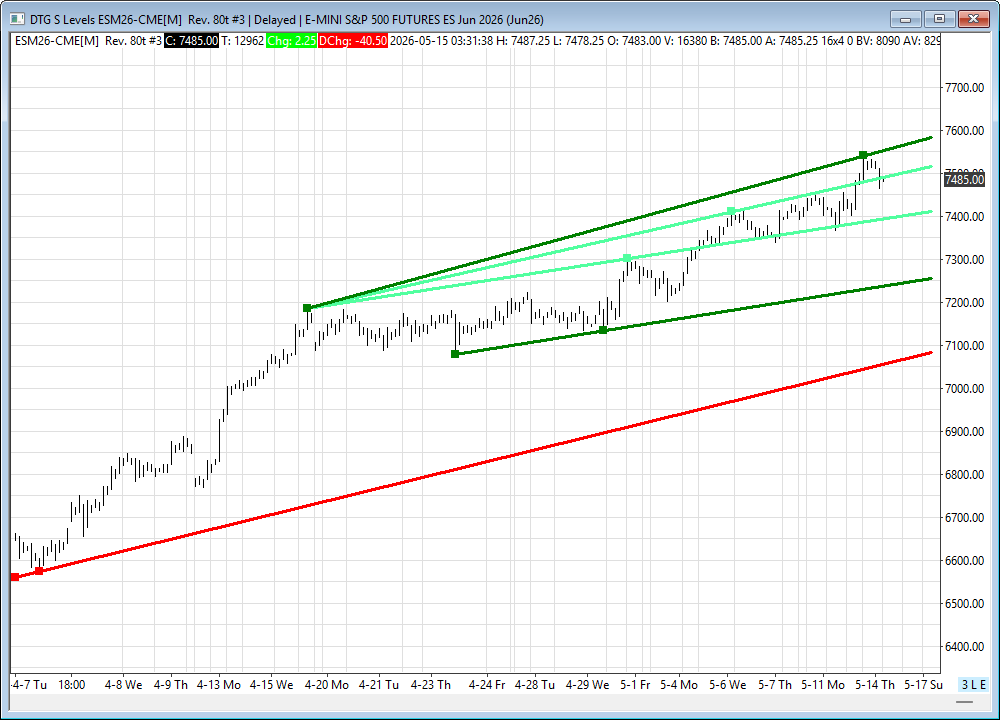
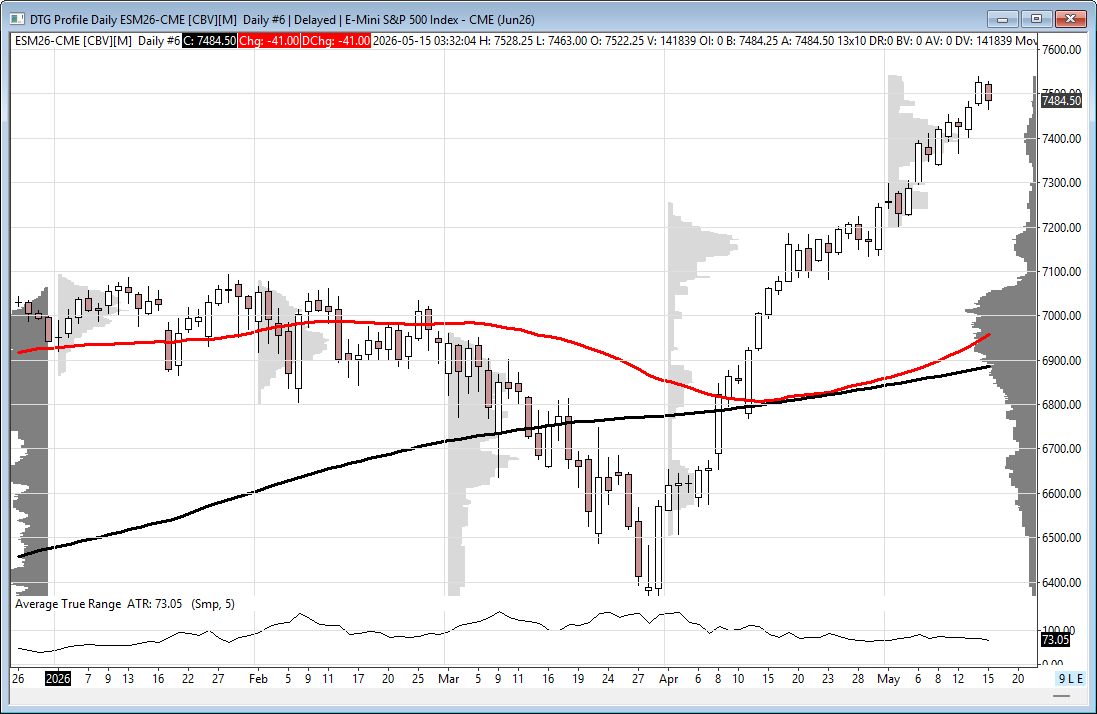
ES Technicals: ES remains longer-term bullish with the 50-day MA above the 200-day MA, but overnight weakness created a new swing high and puts downside support in focus.
ES Levels: Resistance at 7558/63s. Support at 7492/97s, 7397/02s, 7250/55s, 7078/83s.
Affiliate Disclosure: This newsletter may contain affiliate links, which means we may earn a commission if you click through and make a purchase. This comes at no additional cost to you and helps us continue providing valuable content. We only recommend products or services we genuinely believe in. Thank you for your support!
Disclaimer: Charts and analysis are for discussion and education purposes only. I am not a financial advisor, do not give financial advice and am not recommending the buying or selling of any security.
Remember: Not all setups will trigger. Not all setups will be profitable. Not all setups should be taken. These are simply the setups that I have put together for years on my own and what I watch as part of my own “game plan” coming into each day. Good luck!!
Follow @MrTopStep on Twitter and please share if you find our work valuable!