- The Opening Print
- Posts
- From Open Outcry to Algo Mayhem: Same Tape, Different Thieves
From Open Outcry to Algo Mayhem: Same Tape, Different Thieves
Danny Riley
February 05, 2026
Follow @MrTopStep on Twitter and please share if you find our work valuable!
Our View
The old saying goes, "The market giveth and the market taketh away," but today, it’s the algorithm that giveth and also taketh away. The entire structure of the markets is shifting—from humans trading on their keyboards to AI codes ushering in an entirely new wave of trading.
I swear on a Bible that I saw this coming when the CME began Globex trading in 1996. My desk went from being the highest-volume desk in the S&P open outcry system—amidst the roar of the pit—to flipping 5k to 20k lot ES orders and options. Back then, I used to say that the world was ever-changing and that it was never going back to what it was.
I also helped coin the term: “These are not our fathers' markets or charts, and they never will be again.”
And just a friendly reminder: There is no crying in baseball...
Our Lean
The ES traded up to 7017 on Monday and sold off to 6862 yesterday—a 152-point drop. Meanwhile, the NQ hit a high of 25,949.50 and a low of 24,783.50 yesterday, marking a 1,166-point loss in just two days.
Yes, the ES made several higher lows; yes, it rallied almost 80 points off its low; and yes, I think the crowd is short and the big firms are hedged up. But does that mean the low is in? I have to admit, I don’t know. There are many reports stating the US is unsure if they can negotiate a deal with Iran. If they can’t, Trump may be pushed into an attack, but I don’t think this will have the same results as the Israeli/US strikes on Iran’s nuclear and military sites back in June.
Our lean: I can’t rule out a big dead-cat bounce, but this is a very fluid situation. Right now, the headlines and the algos rule the tape.
Guest Posts:
Dan @ GTC Traders
The GTC Sample Portfolio … 2025 and 2026 … Part III
Last week we continued our discussion of the GTC Sample Portfolio. Both how we performed in 2025, and how we are looking ahead to 2026. As we stated then, the portfolio itself is comprised of three distinct ‘multi-strat’ programs, each designed to play a specific role in achieving our objective for this particular macro environment: linearity.
Previously, we discussed the first third of the portfolio; the Equity Fixed Income Hybrid Core program. This week, we move on to the second program. And once again, we will frame this discussion in the same way. How did we perform in 2025 according to what we were actually trying to accomplish? And then our thoughts for 2026, specifically as they relate to this program.
What we are going to discuss this week is the Long–Short Valuation Program.
The Long–Short Valuation Program in 2025
At first glance, this program may not look particularly impressive. And that is exactly why it is worth discussing.

In 2025, the Long–Short Valuation Program returned 2.27%. It is currently annualizing at approximately 4.60%. Those numbers, taken in isolation, are not going to turn heads. Especially in a year where broad equity indices continued to push higher.
But as we stress constantly … the point here is not raw performance. Before you begin to do anything … you need to define your objective.
Our drawdown relative to our annualized return for this program is 0.17 times our annualized return. As we have previously demonstrated in earlier articles … such drawdown performance is beyond outstanding. Most traders are considered very talented if their drawdown is 2 times their annualized return.
So before anyone rushes to conclusions, it is worth pausing and asking the correct question. Not “how much did it make?” But rather … what was this program designed to do?
As premium members know .. due to the current macro environment … we are running what we refer to as our Neutral-Carry Model at 100% in the Long-Short Valuation Program. That means we are running short exposure against the indices at effectively 100% of available capital. In fact, because all three programs are cross-margined to one another, it is actually a bit more than that.
Importantly, this is not done with options. There are no convex payoffs here. Just programmed, tactical outright, directional short exposure against indices, in an environment that we have repeatedly stated we believe to be a bubble.
When viewed through that lens, the numbers begin to look very different.
Across the industry, true short-only programs are notoriously difficult to maintain. Not because the managers are unsophisticated … but because clients hate them. These programs almost always bleed money over time. They are designed to. They are typically paired with long-only portfolios or large equity books, where their job is not to “win,” but to improve risk-adjusted performance at the total portfolio level. Look across professional, institutional databases for short-only programs. There are not many, as the AUM is notoriously … not ‘sticky’.
Most investors cannot tolerate that drag. They chase the hot hand. They watch markets grind higher year after year, and they abandon the hedge precisely when it is most valuable, and because it is accomplishing its objectives
That is the reality of short-only mandates. They are incredibly intelligent. But most bleed money as even institutional investors abandon them in favor of the ‘hot hand’ of equities on a bull run.
So when we look at this program and see that, over its life, it returned approximately 2.24% in late 2023, 6.98% in 2024, and 2.27% in 2025 … while maintaining world-class drawdowns relative to its return profile … the evaluation of the performance changes entirely.
Not only did this program adhere to its objective in 2025 … it did so in an environment that is historically hostile to exactly this type of mandate. And its performance is world-class among its peers. From our perspective, given the constraints, the structure, and the macro backdrop … this is not merely acceptable performance. It is exceptional.
And as we look ahead to 2026, our plan remains unchanged.
We will continue to operate this program with the Neutral-Carry Short Model at 100%, until such time that the broader macro metrics shift on us. At that point? And only at that point, we would transition this into a more traditional long–short valuation framework, of the type commonly seen across the industry. We have already outlined those conditions for premium members.
Market Recap:

The ES traded up to 6965.75 on Globex with 215k contracts traded and opened Wednesday's regular session at 6949.25. After the open, the ES traded 6950.25, then dropped to 6935.50 in the first minute. It then traded up to 6960.50 before selling off to 6910.25 at 10:00 a.m., followed by a rally to 6954.25 at 10:25 a.m.
The ES sold off to a higher low at 6918.75 at 10:35 a.m., rallied to 6948.50 at 10:40 a.m., then sold off to another higher low at 6911.25 at 11:05 a.m. From there, it rallied to a lower high at 6930.50, then sold off to a new low of 6888.50.
After a brief rally to another lower high at 6916.50 at 12:00 p.m., the ES sold off to a lower low at 6862.50 at 12:50 p.m. It then rallied to 6885.75, pulled back to a higher low at 6868.25 at 1:10 p.m., and rallied to 6896.00 at 1:40 p.m.
The market pulled back again to a higher low at 6876.75 at 1:50 p.m., rallied to 6900.50, and sold off to 6878.75 at 2:05 p.m. Going into 3:00 p.m., the ES rallied to 6930.25, pulled back to 6912.75 at 3:10 p.m., then traded back up to 6928.75 at 3:45 p.m.
The ES was trading 6928.25 when the 3:50 p.m. cash imbalance showed $1.5 billion to buy. It traded up to 6932.25, sold off to 6901.75, and settled at 6906.25 on the 4:00 p.m. cash close.
In after-hours trading, the ES rallied back up to 6922.00, sold off to 6890.75 after Google reported a revenue beat, then rallied again to 6922.00. It sold off once more to 6895.50, rallied to 6941.25 at 4:35 p.m., and finally settled at 6928.50.
Closing Index Summary:
ES: Settled at 6928.50, down 13.25 points (-0.19%).
NQ (Weak Link): Settled at 25,116.25, down 335.75 points (-1.32%).
YM: Settled at 49,547.00, up 197 points (+0.40%).
RTY: Settled at 2,638.50, down 18.30 points (-0.69%).
In the end, the uptick in volatility is clearly playing out in both the index and options markets. I hate to repeat myself, but I still believe 2026 is going to be the "Year of the VIX." As I wrote in yesterday's Opening Print, there seems to be constant liquidation in the AI and tech sectors.
Regarding the overall tone for the ES and NQ, it was another day of blasting lower right off the open. For the ES, overall trade volume was lower at 1.54 million contracts.
The Evolution of Trading: From Pit Arbitrage to AI Bots
When the market crashed in 1987, the NYSE blamed it on S&P 500 futures index arbitrage, which was total BS. During the 2010 Flash Crash, they blamed it on a London trader for spoofing, also total BS.
I remember when the PitBull first started trading at my desk. Yes, he knew I did a better job than the other guys he used, but it was more than that: I had flow. I had the UBS program trading business and massive hedge funds buying and selling through my desk.
When the SPU (the big S&P future) was going down and trading at a discount to the S&P cash, I was bidding the futures, and the hedge funds were hitting my bids. When the SPU was going up and trading at a premium to the S&P cash, I was offering, and the hedge funds would lift my offers.
That was what program trading was all about, and the PitBull hated it. He said it "killed" the XMI contract and wanted to take out a $500k ad in The Wall Street Journal condemning the practice, claiming it would someday ruin the SPU, which, back then, only accounted for 20% of pit volume.
As program trading became more electronic, that percentage jumped to maybe 30% or higher. This evolution invited in different types of electronic program trading, including algorithms and High-Frequency Trading (HFT), which now accounts for up to 70% of the daily trading volume on the NYSE and CME’s ES futures.
But today, it’s not just algos and HFTs whacking the markets around and exploiting price action—it’s the new AI bots and all the back-testing that have added to an already crowded trading space.
To give you an idea of the scale of these programs, I asked Grok:
"How many servers does the CME have at its Aurora, IL data center for HFT and algorithmic trading for hedge funds and prop trading firms?"
The answer I got:
"Hundreds to potentially thousands of servers are likely present from CME itself plus client firms."
I can't blame this on my poor trading orders, but—as I’ve said many times—I have never seen the ES act as erratically as it has over the last few months. It seems like it has reached a fever pitch recently. Clearly, things have changed, and not necessarily for the better.
This is a 2014 60 Minutes Overtime interview where Steve Kroft spoke with Michael Lewis about his book Flash Boys, which revealed how some high-speed traders worked the stock market to their advantage. Just think, this was 12 years ago...
👉 Watch the interview here
On Tap
8:30 a.m. – Initial Jobless Claims
10:00 a.m. – Existing Home Sales
After the close – Amazon reports
MiM
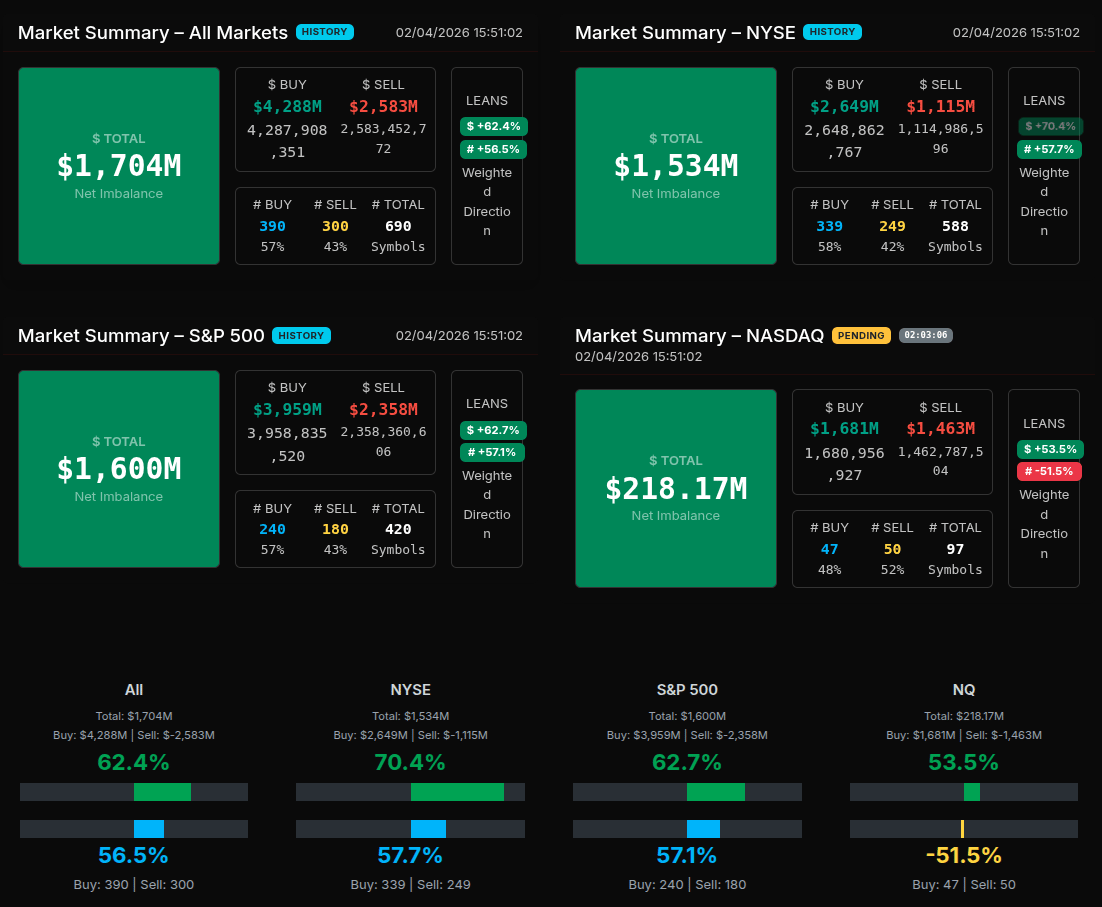
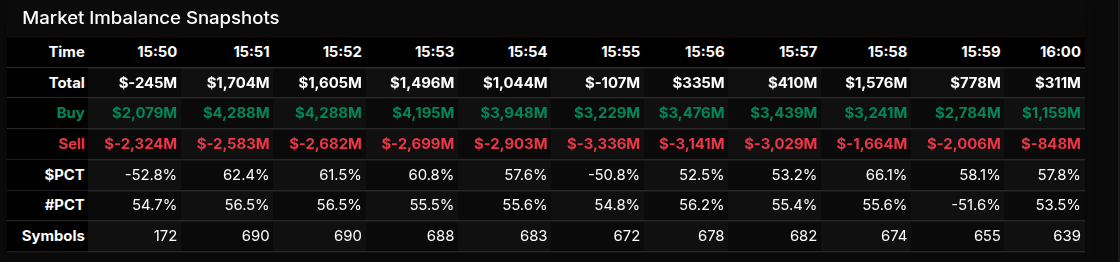
The Market-on-Close auction opened with a clear buy-side bias and never fully let go of that tone, even as the tape showed brief moments of hesitation and rotation. Early snapshots around 15:50 showed a small net sell imbalance, but that quickly flipped as buy programs asserted control. By 15:51, total imbalance surged to roughly $1.7B net buy, setting the framework for the rest of the close.
From there, the auction transitioned into a classic “bid-dominant but rotational” environment. Buy dollars consistently outweighed sell dollars, peaking north of $4.2B in buy interest while sell pressure expanded but failed to overwhelm the tape. The $PCT metric spent most of the window above +57%, with multiple readings pushing into the low-to-mid 60s. That is notable, as it signals more than just passive rotation—this was sustained institutional buying rather than two-way churn.
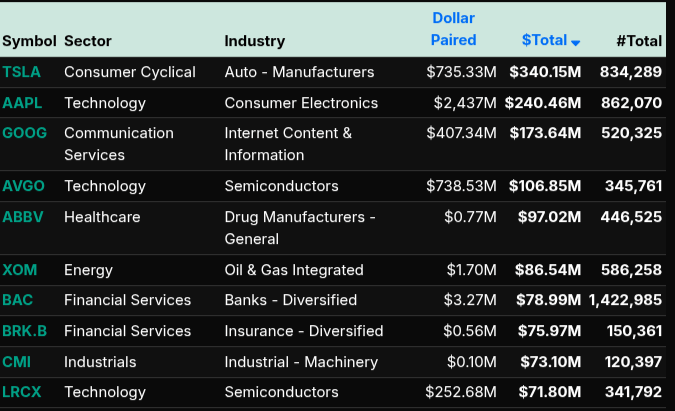
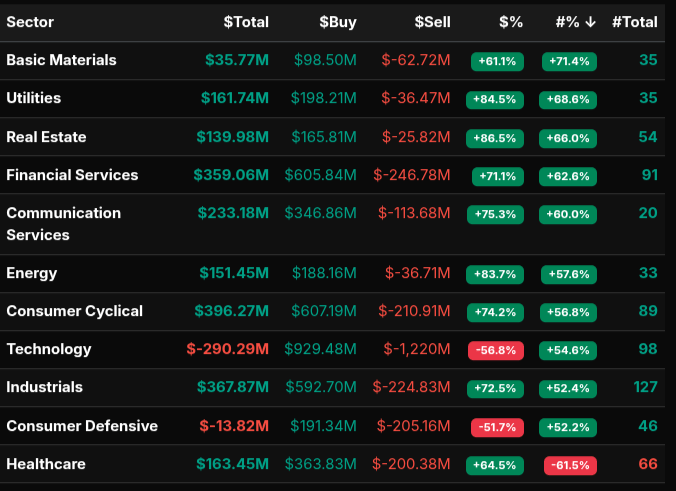
Sector flows reinforced that message. Financial Services, Consumer Cyclical, Industrials, and Communication Services all posted strong positive totals with percentage leans above +70%, pointing to broad risk-on participation. Utilities, Real Estate, and Energy also leaned decisively buy-side, suggesting defensive and yield-sensitive names were not being abandoned. Technology stood out as the exception: despite massive gross flow, the sector finished with a net sell imbalance, reflecting heavy internal rotation rather than outright liquidation. This aligns with the presence of mega-cap tech on both the buy and sell lists.
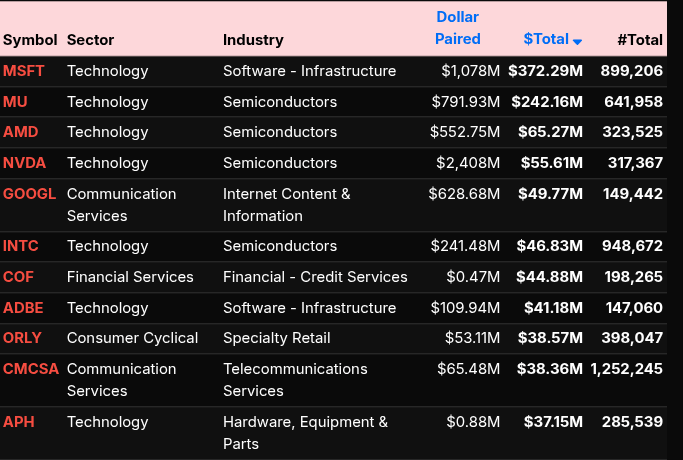
On the single-name level, the close was dominated by large, liquid symbols. MSFT, MU, AMD, NVDA, and AAPL all featured prominently, underscoring institutional rebalancing rather than event-driven spikes. Several of these names showed dollar-paired flows large enough to suggest wholesale execution, even where net results were modest.
Into the final minutes, the imbalance compressed but remained positive, closing near a $300M net buy. The NYSE and S&P 500 both held strong buy leans above +62%, while Nasdaq lagged, reinforcing the day’s key theme: steady accumulation outside of high-beta tech, with rotation—not panic—driving the close.

Technical Edge
Fair Values for February 5, 2026
S&P: 22.63
NQ: 97.55
Dow: 97.71
Daily Breadth Data 📊
For Wednesday, February 4, 2026
• NYSE Breadth: 63% Upside Volume
• Nasdaq Breadth: 40% Upside Volume
• Total Breadth: 43% Upside Volume
• NYSE Advance/Decline: 58% Advance
• Nasdaq Advance/Decline: 38% Advance
• Total Advance/Decline: 45% Advance
• NYSE New Highs/New Lows: 323 / 99
• Nasdaq New Highs/New Lows: 345 / 440
• NYSE TRIN: 0.95
• Nasdaq TRIN: 0.90
Weekly Breadth Data 📈
For the Week Ending Friday, January 30, 2026
• NYSE Breadth: 46% Upside Volume
• Nasdaq Breadth: 46% Upside Volume
• Total Breadth: 46% Upside Volume
• NYSE Advance/Decline: 47% Advance
• Nasdaq Advance/Decline: 35% Advance
• Total Advance/Decline: 39% Advance
• NYSE New Highs/New Lows: 452 / 119
• Nasdaq New Highs/New Lows: 667 / 458
• NYSE TRIN: 0.99
• Nasdaq TRIN: 0.64
S&P 500/NQ 100 BTS Trading Levels (Premium Only)
BTS are daily generated levels created using a combination of proprietary calculations and AI to define an upper range target and a lower range target, split by a bull/bear line. You receive daily charts along with clear descriptions of each level to help guide your trading.
Take a Free Premium Trial to see them in action.

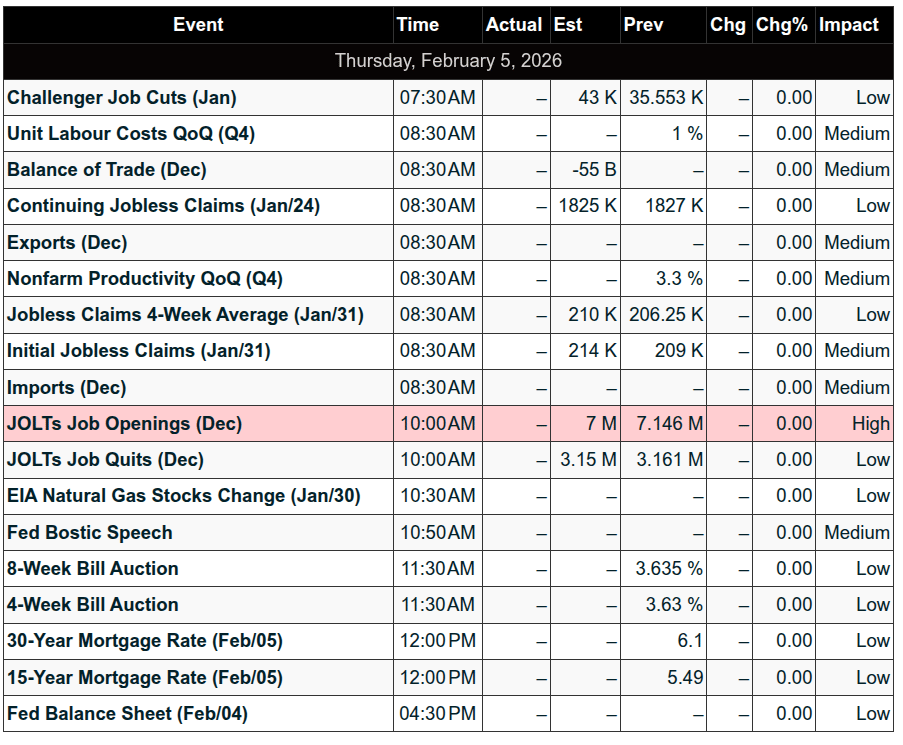
Economic Calendar Today
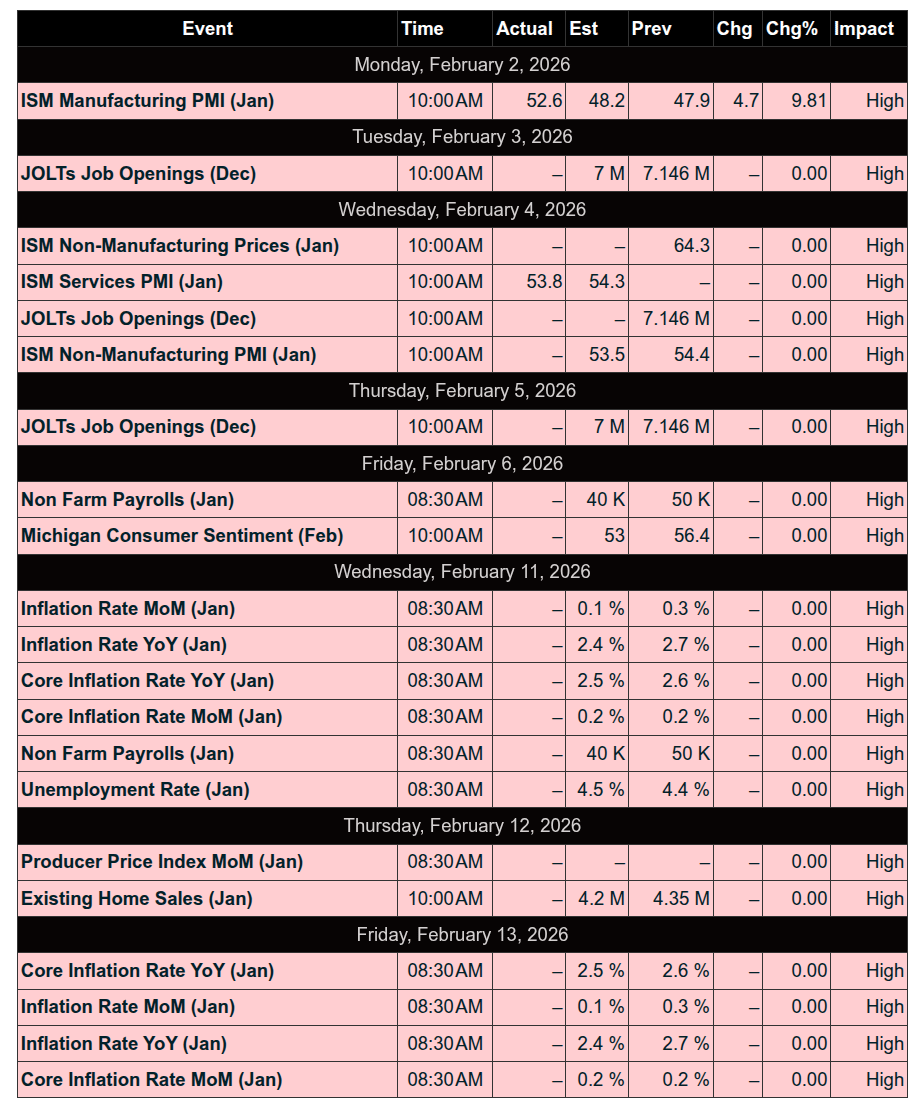
This Week’s High Importance
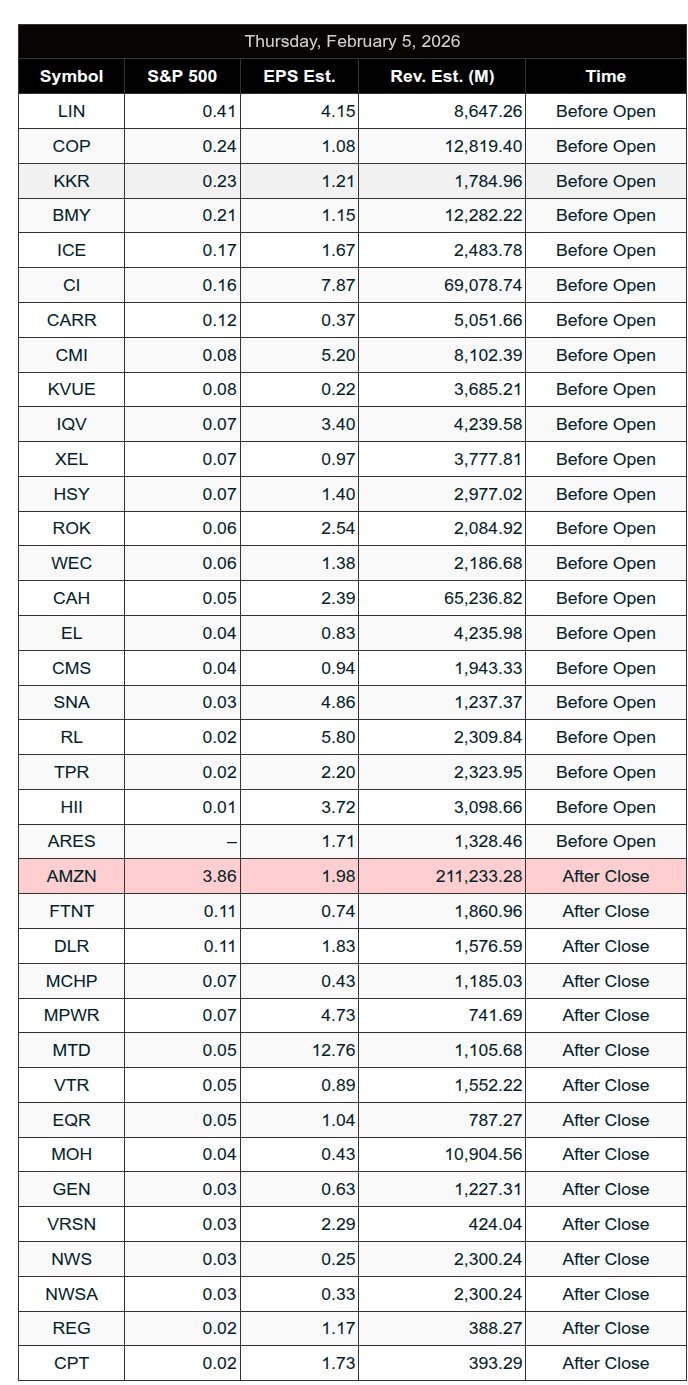
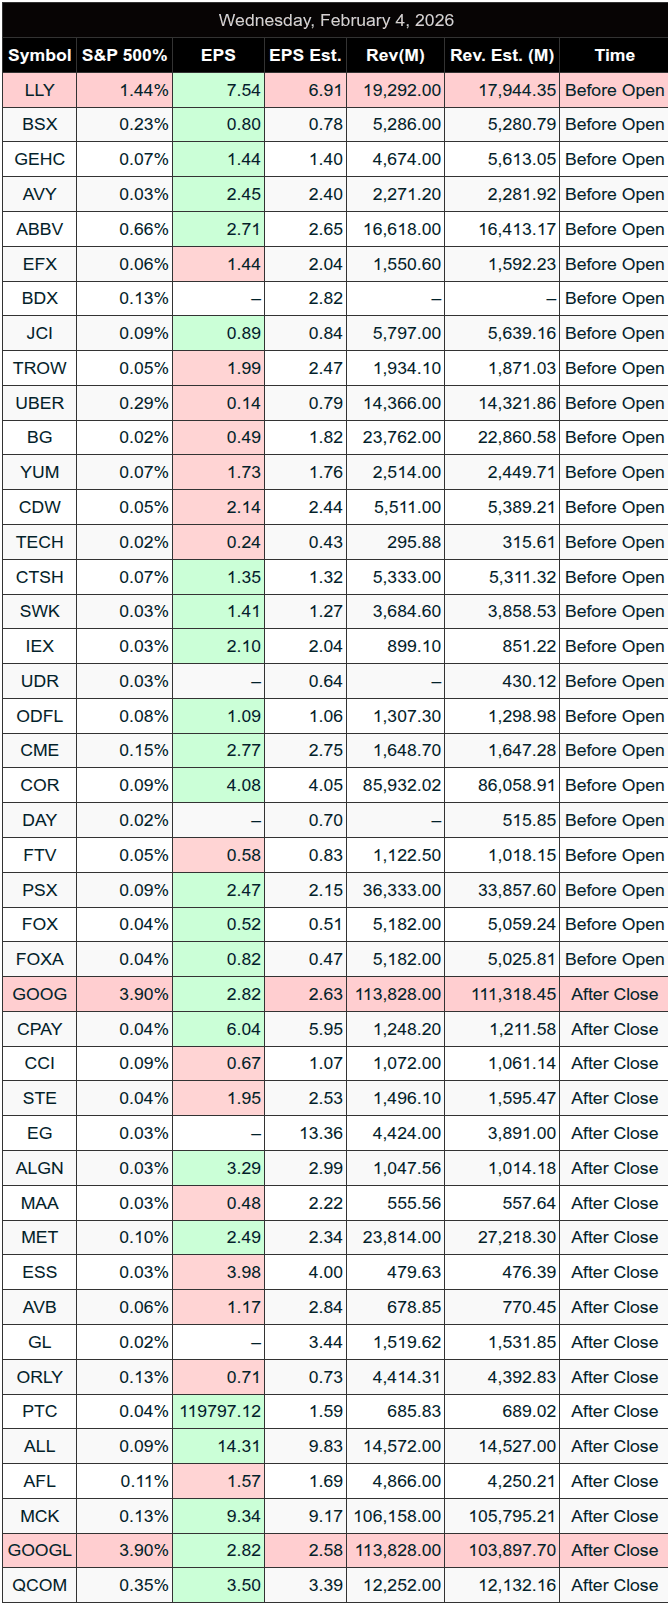
Earnings:
Recent
Trading Room News:
PTG Room Summary – Wednesday, February 4, 2026
A dynamic trading day in the PTG room led by David Dube (PTGDavid), with both bullish and bearish targets hit and multiple valuable lessons reinforced.
Morning Game Plan & Market Setup
Line in the Sand: 6950 was declared the key level.
Congested Zone: 6945–6975 identified as a tight resistance cluster, requiring resolution.
Initial Bias: Expectation for MATD (Morning After Trend Day) rhythmic action following the prior day's sharp decline.
Overnight Target: 6965 was hit pre-market, setting the stage.
Key Trade Highlights
@CL OPR Long: Early in the session, a long was called and the first target was fulfilled.
Bear Case: Below 6950 ± 5 pts, targets at 6930, 6920, and 6910 were all successfully achieved.
Bull Case: North of 6950 ± 5 pts, targets at 6965–6975 were also fulfilled, showcasing the two-sided nature of the day.
Lesson: Cycle Day 1 behavior delivered—pressing lower early to correct inventory, followed by a structured rebound.
Midday Price Action
Both Edges Tagged: 6965 (upper) and 6910 (lower) hit per DTS Briefing—textbook fulfillment of both directional scenarios.
CD1 Range Projection (6891.57) was tagged and bagged, confirming the accuracy of PTG’s projected levels.
Afternoon Reversal & Cycle Day Mastery
Around 1:30 PM, PTGDavid called for "Cycle Day 1 – Reload Longs...BTFD", a bold and timely alert.
Buyers staged a strong comeback from the D-Level/CD1 Violation Zone (6965–6967).
Those who took the long at the Violation Zone were "sitting on a solid gain" by late afternoon.
Teaching Moment: David emphasized the emotional challenge—“Were you fearing the Reaper at the DL Lows?”—reminding traders to trust the setup and not panic at support.
Closing Thoughts
By the end of the day, price returned to mid VWAP, and David turned neutral into the close.
He noted the Cycle Day 1 “did its job”: flushing weak hands and setting up the rally.
A notable $1.5B MOC buy imbalance hinted at strength into the final bell.
Key Takeaways
Precise levels work: All major projected targets (both bull and bear) were tagged—reinforcing trust in planning and discipline.
Cycle Day strategy remains a core edge for room participants.
Emotional composure matters—those who followed the plan without fear of the “reaper” were rewarded.
“Cycle Day 1 gameplay is about pricing out weak inventory before the rebound—play it right, and the reward comes with patience.”
Another strong day of tactical execution and learning in the PTG room.
DTG Room Preview – Thursday, February 5, 2026
Market Focus:
Corporate earnings, SAAS sector pressure, crypto volatility, and weekly Unemployment Claims.
Tech & AI Developments:
Alphabet (GOOG[L]) fell 1% premarket after earnings and a bold $185B AI spending forecast for 2026.
Nvidia (NVDA) and Broadcom (AVGO) gained on the AI optimism.
Qualcomm (QCOM) tumbled post-earnings on weak guidance tied to a global memory chip shortage.
Amazon (AMZN) reports after the bell.
SAAS Sector Under Pressure:
Ongoing weakness from Anthropic’s AI tools continues to challenge traditional software business models.
Microsoft (MSFT) now down 25% from ATH and 14% since last week’s strong earnings.
Crypto Selloff:
Bitcoin dropped below $71,000 after Treasury Secretary Scott Bessent stated the U.S. government would not bail out crypto markets.
Concerns mount over institutional holdings potentially being liquidated to realize tax losses, adding downside pressure.
Fed Spotlight – Kevin Warsh:
Trump’s Fed Chair nominee Kevin Warsh gaining attention.
Warsh is known for hawkish tones during his Fed tenure (2006–2011) and now works with billionaire Stanley Druckenmiller.
Advocates for AI-driven productivity and criticized outdated central bank models in a recent CNBC interview.
Earnings Calendar Highlights:
Premarket: BMY, CAH, CI, COP, CMI, HSY, IQV, LIN, SHEL, TRI, ICE, RL, EL, BCE, KKR, TPR, XPO, SNA, ROK, XEL, WEC, and more
After the bell: AMZN, AFRM, TEAM, FLS, FTNT, GEN, ILMN, MCHP, NWS, RDDT, RGA, RBLX, SSNC, UNM, VTR, WMG
Friday morning: BIIB, PM, AER, CG, CNC, LTM, NVT
Economic Calendar (ET):
Weekly Unemployment Claims – 8:30 AM
Atlanta Fed’s Bostic speaks – 10:50 AM
Volatility & ES Outlook:
ES futures have swung over 100 points in 4 of the last 5 sessions.
5-day average daily range now at 121.25 points.
Whale flows remain bullish into today’s Unemployment Claims release.
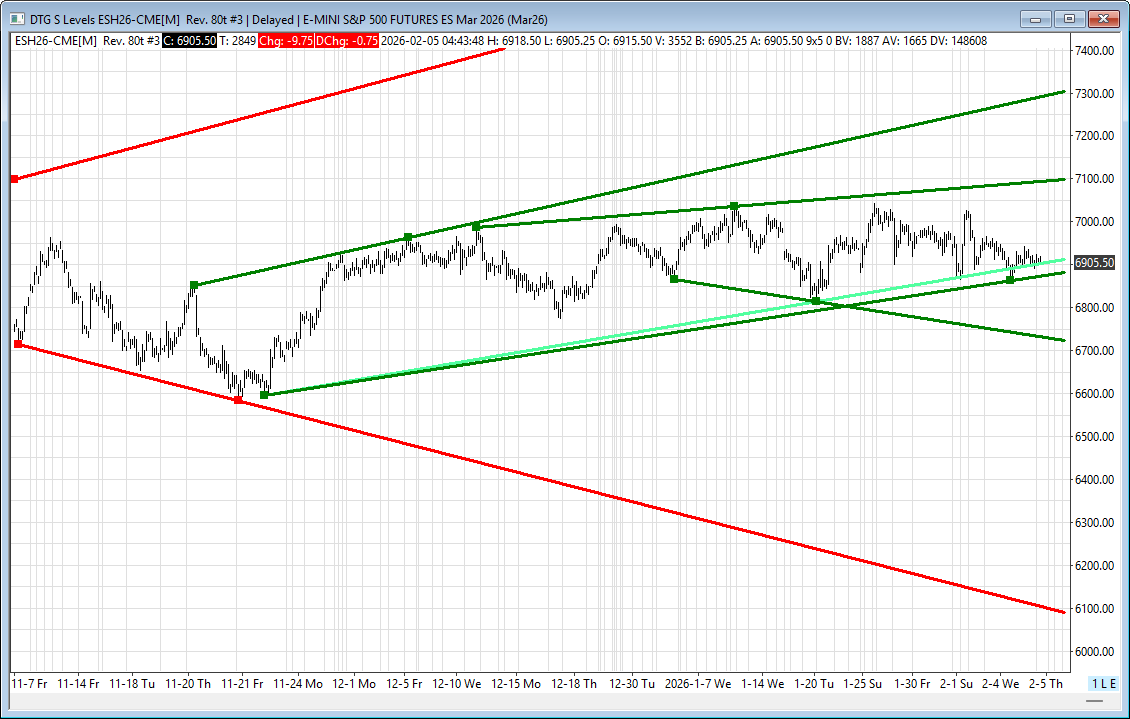
Key ES Technical Levels:
Support: 6877–6880, 6723–6718
Resistance: 7099–7104, 7308–7313
ES continues to trade in a 2+ month sideways range.
Closed below the 50-day MA (6931.25), a short-term bearish signal—but bulls could reclaim that level today.
The short-term uptrend channel bottom held firm Wednesday and remains a key level.