- The Opening Print
- Posts
- From Grocery Bills to Gap-Down Buys — Inflation’s Sticky but the Pit Smells 7050
From Grocery Bills to Gap-Down Buys — Inflation’s Sticky but the Pit Smells 7050
Danny Riley
January 13, 2026
Follow @MrTopStep on Twitter and please share if you find our work valuable!
Our View
While the talks about Goldilocks continue regarding further rate cuts in 2026, the markets are discounting the odds at 5% for a 0.25 bp rate cut during the Fed's two-day meeting on January 27th and 28th. If Trump had it his way, he would throw Powell in jail and jump at the chance to do larger rate cuts.
I get it—inflation has moderated, but the cost of U.S. food prices has not fallen overall. The latest data in November 2025 showed CPI for food rose 2.6% year-over-year, while food-at-home (grocery) prices increased 1.9% over the same period. That means prices are higher than a year ago, though the pace of increase has slowed from prior years.
Other CPI components like shelter are up 3.0–3.5% year-over-year, holding the largest weight at 36%, lagging softer market rents. Energy services such as electricity are up +6.9%, natural gas costs have increased +9.1%, auto insurance 7.5%, medical care costs rose +3.3%, and restaurant meals +3.7%.
I think all the increases are actually higher. My electric bill went from $230 a month in 2025 to $370 a month, and water has risen from $180 a month to $230. Every bill I pay has gone significantly higher.
Our View
In addition to the CPI number this morning, JPMorgan Chase (JPM) and Bank of New York Mellon (BK) are reporting before the bell, followed by Bank of America (BAC), Wells Fargo (WFC), and Citigroup on Wednesday.
Monday's close was the exact opposite of Friday’s, but I’m not sure that matters because the PPT and the switch from quantitative tightening to easing have increased liquidity. While I still think the markets are going higher, I also want to be cautious, and here’s the reason:
The ES has closed higher in 5 of the last 7 sessions, with one of the down days only being down 0.02%, for a total gain of +124 points. The NQ came off a 4-day losing streak with a loss of 495.25 points and has now been up 4 out of the last 5 sessions for a gain of 553 points. The YM has been up 5 of the last 6 sessions for a total gain of 3,473 points, and the RTY (Russell 2000) came off a 4-day losing streak where it lost 68.1 points but has been up 6 out of the last 7 sessions for a total gain of 151.3 points.
US STOCKS REACT TO TRUMP'S 10% CREDIT CARD RATE CAP AND THE $100 BILLION DROP IN MARKET CAP
$COF Capital One: -7% $AFRM Affirm: -5% $AXP American Express: -4% $C Citigroup: -3% $MA MasterCard: -3% $V Visa: -3% $USB US Bancorp: -3% $JPM JP Morgan: -2% $WFC Wells Fargo: -2% $BAC Bank of America: -1%
Aside from all uptick in economic reports this week it's also the start of the 2025 Q4 earnings season and the FRIday monthly options expiration. According to Bloomberg Intelligence, S&P earnings growth is expected to climb by +8.4% in Q4. Excluding the Magnificent Seven mega cap technology stocks, Q4 earnings are expected to increase by +4.6%. it may have been quiet Monday but that's set to change.

Our Lean — Danny’s Trade (Premium only)

Guest Post: Tom Incorvia - Blue Tree Strategies
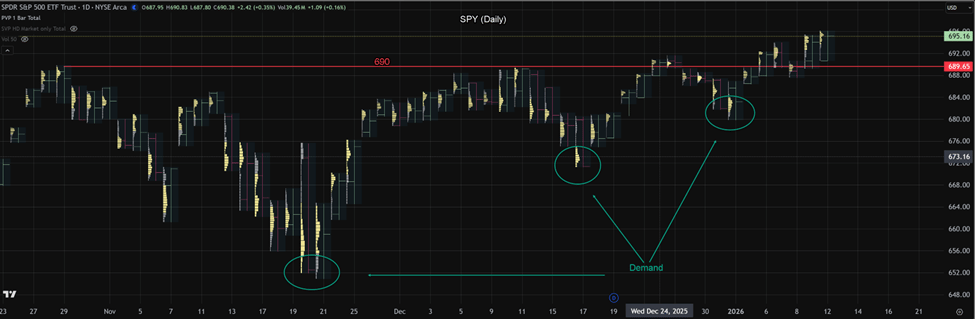
SPY closed at new all-time highs today, continuing a process that has been underway for several months. Since November, prices have repeatedly tested and re-tested the 690 level, establishing it as a key reference point in the current auction. These repeated tests have resulted in the development of multiple higher-demand zones, three of which are now clearly defined and continue to provide structural support to the advance.
The past two sessions have produced consecutive record closes, confirming that the market remains in an uptrend and is trading in largely uncontested territory above prior value. Value Area relationships remain constructive and continue to validate the broader rally.
However, despite the bullish structure, upside progress has been measured rather than impulsive. While acceptance above prior value is evident, there has been a lack of sustained directional conviction. For further confirmation of initiative buying, a strong directional session—characterized by expanded range and volume—would strengthen the case that higher prices are being actively pursued rather than passively accepted.
Until that occurs, the trend remains intact, but near-term continuation would benefit from clearer evidence of increasing demand.
You can purchase Tom’s Course on Volume Profile here.
Market Recap

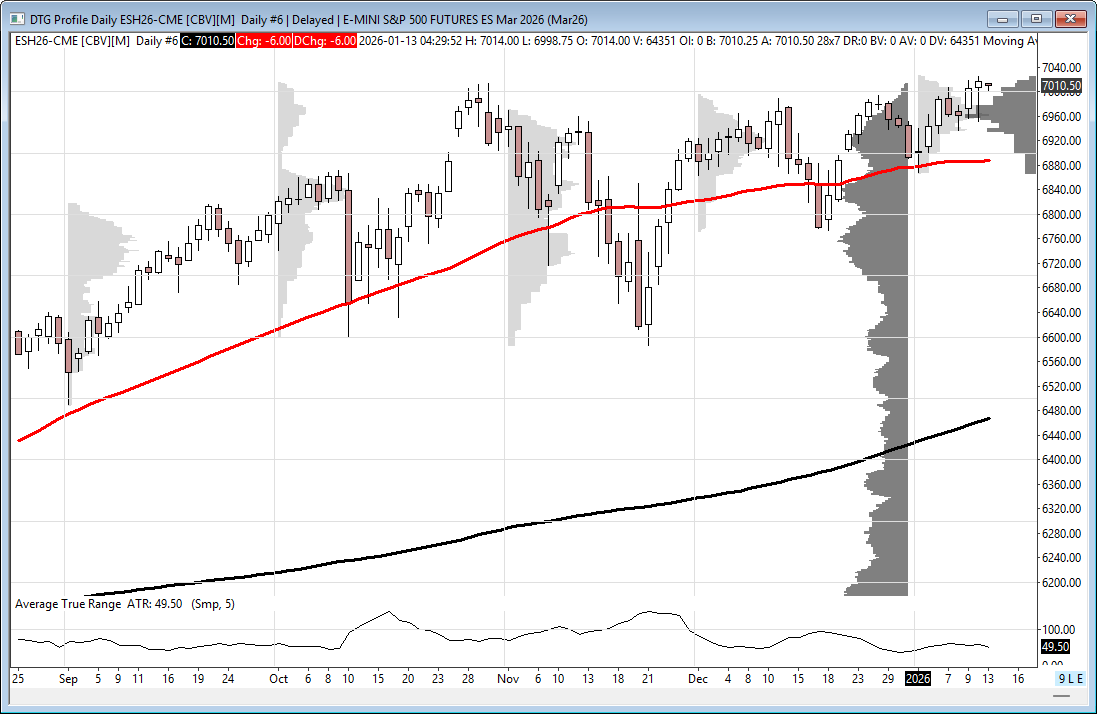
The ES traded down to 6950.00 on Globex and then up to 6969.50. After the open, the ES printed 6968.50, traded up to 7002.75, and pulled back to 6992.75 at 10:35. It then rallied to a double top at 7010.75 at 11:20, backfilled, and traded 7004.50 at 11:30 before pushing up to a new high at 7012.50.
After pulling back to 7004.50 at 12:40, the ES slowly stutter-stepped higher to a new all-time high at 7018.75 at 1:50. It then pulled back to 7013.50 before rallying to another new high at 7022.75 at 2:30. After a minor pullback, the ES climbed to 7025.00 at 3:00.
At 3:19 PM, I posted this:
IMPRO :DBOY 3:19:00 PM I think thats the high
IMPRO 3:19:20 PM here is always a late walk away
The ES then sold off down to 7016.00 at 3:20 and again at 3:40, before trading back up to 7020.00 at 3:48. It then dropped back down to 7015.75 and traded 7019.50 as the 3:50 cash imbalance showed $1.6 billion to sell. It rallied briefly to 7022.00 before selling off again to 7015.75 and closed at 7016.00 on the 4:00 cash close.
After 4:00, the ES sold off to 7010.00 and settled at 7016.50, up 11.5 points or +0.16%. The NQ settled at 25,956.75, up 18.5 points or +0.07%; the YM settled at 49,809.00, up 83 points or +0.17%; and the RTY was the outperformer, settling at 2,649.30, up 12.40 points or +0.247%.
In the end, the index markets really don’t seem to care about any of the negatives, even as the national debt hits a new high at $38.6 trillion (US Debt Clock).
In terms of overall tone, the index markets were firm throughout the session but gave up most of their gains after 3:30. Volume in the ES was the lowest since 12/31, when it was only 990k, with just over 1.005 million contracts traded on the day.
On Tap
The economic schedule picks up today and continues to build through the week:
6:00 AM – NFIB Optimism Index
8:30 AM – U.S. Consumer Price Index (CPI)
10:00 AM – St. Louis Fed President Alberto Musalem speaks
2:00 PM – U.S. Budget Deficit
4:00 PM – Richmond Fed President Tom Barkin speaks
MiM
Market-on-Close Recap – MiM
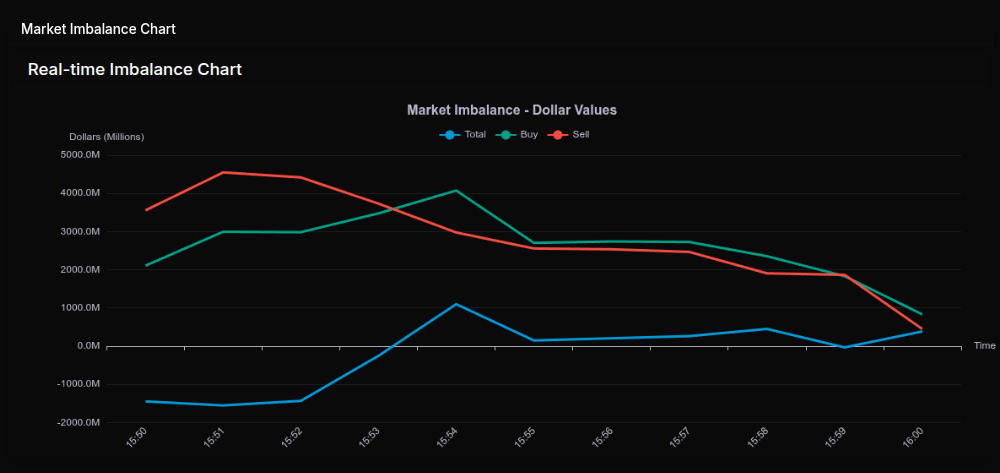
The market-on-close auction opened decisively on the sell side, with broad-based pressure evident immediately after the 15:50 ET imbalance release. Early snapshots showed net sell imbalances exceeding $1.4B, with sell dollars consistently outpacing buy interest through the first half of the window. This was not a tentative open; the initial tone reflected programmatic supply and de-risking rather than isolated stock-specific flows.
As the auction progressed, the tape briefly attempted to stabilize around 15:54–15:55, when total imbalance flipped positive near $1.1B and buy percentages pushed above the 50% threshold. That shift, however, proved rotational rather than structural. The close-to-50% readings suggested two-way trade and internal rebalancing, not sustained demand. By 15:59, the imbalance reverted back toward the sell side, confirming that buyers were largely reactive rather than in control.
Sector-level data reinforced this view. Technology and Communication Services were the clear sources of pressure, with Technology posting a net imbalance of roughly -$1.2B and Communication Services near -$500M. Both sectors carried sell leans well beyond -66%, marking wholesale selling rather than rotation. Financial Services also remained heavy, contributing nearly -$400M in net supply. Industrials and Energy added incremental downside, keeping the broader profile defensive.
On the buy side, Consumer Cyclical, Healthcare, and Consumer Defensive stood out, each posting positive net totals with leans above +66%. These flows were notable but selective, reflecting end-of-day allocation rather than broad risk-on behavior. Utilities and Real Estate also attracted modest demand, consistent with a defensive bid.
At the symbol level, buying was concentrated in large-cap, high-liquidity names such as MSFT, AAPL, NVDA, and META, while selling pressure persisted across index-heavy constituents tied to Nasdaq and S&P exposure. Overall, the auction resolved as a sell-dominated close with brief rotational pauses, leaving the final print firmly skewed toward distribution rather than accumulation.


Technical Edge
Fair Values for January 13, 2026:
SP: 39.23
NQ 169.09
Dow: 218
Daily Market Recap 📊
For Monday, January 12, 2026
• NYSE Breadth: 51% Upside Volume
• Nasdaq Breadth: 56% Upside Volume
• Total Breadth: 55% Upside Volume
• NYSE Advance/Decline: 58% Advance
• Nasdaq Advance/Decline: 55% Advance
• Total Advance/Decline: 56% Advance
• NYSE New Highs/New Lows: 220 / 18
• Nasdaq New Highs/New Lows: 397 / 93
• NYSE TRIN: 1.10
• Nasdaq TRIN: 0.95
Weekly Breadth Data 📈
For Week Ending Friday, January 9, 2026
• NYSE Breadth: 59% Upside Volume
• Nasdaq Breadth: 58% Upside Volume
• Total Breadth: 58% Upside Volume
• NYSE Advance/Decline: 74% Advance
• Nasdaq Advance/Decline: 72% Advance
• Total Advance/Decline: 72% Advance
• NYSE New Highs/New Lows: 414 / 89
• Nasdaq New Highs/New Lows: 701 / 246
• NYSE TRIN: 1.90
• Nasdaq TRIN: 1.81
ES & NQ Levels (Premium only)

Calendars
Economic Calendar
Today

Important Upcoming

Earnings

Recent
NONE
Trading Room Summaries
Polaris Trading Group Summary - Monday, January 12, 2026
Market Overview & Trade Highlights
Opening Trade: PTGDavid initiated the day with a long lean off the open, consistent with the Cycle Day 2 (CD2) playbook.
Key Level Identified: 6990 was marked as pivot support, and 7005 was declared the “Line in the Sand” — price action soon tested this level.
Breakout Move: Around 11:16 AM, a bullish breakout above the prior close confirmed momentum was shifting in favor of the buyers, exactly as PTGDavid outlined. The market followed through strongly.
Target Achievements:
7015, 7020, and 7025 upside targets from the Daily Trade Strategy were all hit.
David confirmed at 3:02 PM that 7025 was tagged, closing out the session with a highly successful bullish scenario.
Key Lessons & Performance
Cycle Structure in Action: The day served as a textbook Cycle Day 2 (CD2) with the market following its typical "rhythm" — initial choppiness followed by directional follow-through.
Dr. Dean's Stats: Shared strong personal performance metrics:
+$1,594 avg per trade on recent NASDAQ longs
Compared to -$394 avg per trade on shorts — reinforcing the value of staying aligned with prevailing market bias.
DTS Accuracy: PTGDavid’s Daily Trade Strategy was spot-on, with all primary CD2 targets reached.
Community Engagement: Traders were supportive, inquisitive, and collaborative, particularly around platform issues and strategy discussion.
Looking Ahead
Upside Targets (if momentum continues): 7032 → 7035 → 7041 → 7051
Retracement Levels: 6995 → 6985 → 6980
These levels will help guide setups heading into CPI data Tuesday.
Takeaways:
Trusting the Cycle Day Framework remains crucial — yesterday was a great example of patience through early chop paying off.
Bullish confirmation above 7005 was a critical intraday inflection point.
Traders who waited for confirmation of structure before committing likely benefited most.
Discovery Trading Group Room Preview – Tuesday, January 13, 2026
Market Snapshot – Early AM Focus: CPI data, big bank earnings, Fed independence concerns, and a looming Supreme Court tariff ruling are front and center for trading today.
Macro & Policy Themes
U.S. equities are near record highs despite ongoing political and policy tensions. Powell and former Fed chairs are pushing back against a DOJ criminal probe into Fed Chair Jerome Powell’s actions, framing it as a threat to Fed independence. Markets are watching this closely as a potential risk for monetary policy credibility.
Inflation: December CPI, delayed by the government shutdown, is due this morning and expected at ~2.7% yoy / 0.3% mom — a key input for Fed rate decisions with expectations of a 5% policy rate still in place.
Tariffs & Trade: President Trump has signaled new 25% tariffs on countries trading with Iran, raising geopolitical and inflation concerns. A Supreme Court decision on the legality of his tariff authority under IEEPA is expected soon (possibly today), with markets bracing for the implications on trade policy and executive power.
Trade Deal Updates: Talks continue on a tariff adjustment with Taiwan aimed at lowering tariffs to 15% and boosting semiconductor investment.
Corporate Earnings
Premarket: Delta Air Lines (DAL), JPMorgan Chase (JPM), BNY Mellon (BK)
Wednesday morning: Bank of America (BAC), Citigroup (C), Wells Fargo (WFC)
Economic Calendar
8:30 ET – December CPI
10:00 ET – New Home Sales
2:00 ET – Federal Budget Balance
Fed speakers scheduled from New York and Richmond branches
Volatility & ES Technicals
Volatility slightly higher but moderate; ES 5‑day range ~58 points.
ES tested trendline resistance (~7019/22) again; below here keeps resistance in play.
Key resistance levels: 7019/22s, 7138/43s, 7560/65s
Key support levels: 6886/91s, 6535/30s, 6275/70s