- The Opening Print
- Posts
- From 7000 Highs to 6750 Lows — The S&P’s Just Running in Circles
From 7000 Highs to 6750 Lows — The S&P’s Just Running in Circles
Danny Riley
February 18, 2026
Follow @MrTopStep on Twitter and please share if you find our work valuable!
FREE Two-Week Offer for the Opening Print Premium. Open up the Lean and other premium features for the next Two Weeks!
Our View
Early last week, I listed out all the old highs the ES made above 7000.00, and then I will post how many highs the ES has made at 6890 to 6940. Today, I want to talk about the 8 lows the ES made from 6820 to 6750.
I don’t know if the ES is setting up to take out the 6751.50 2/9/26 low, but it looks to me that the ES has fallen into a range trade. Is it waiting on the US / Iran negotiations? That would be my guess, but there are a host of potential market-moving headlines that could arise.
I am not going to do a big view or lean today. We continue to see the same ES prices over and over.
*The following was written after today’s “Our View” was written.
Chicago Fed President Austan Goolsbee signaled that several more interest-rate cuts could happen in 2026 if inflation continues moving sustainably toward the Fed’s 2% target.
He described recent softer inflation readings as somewhat misleading because services-sector prices remain persistently elevated. Goolsbee stressed the need for clear evidence that inflation is on a lasting path back to 2%, saying that only then would multiple additional cuts be appropriate.
He also noted that if any price increases tied to tariffs turn out to be temporary (one-time effects rather than ongoing), it would give the Fed greater flexibility to ease policy.
Goolsbee views a policy rate around 3% as a rough estimate of neutral—roughly 2% inflation plus about 1% real neutral rate—meaning there’s potentially room for 2–3 quarter-point cuts from current levels if the data cooperate.
This more dovish tone contrasts with some other Fed voices that prefer holding rates steady for longer or moving very cautiously. Markets have been pricing in expectations of deeper cuts overall, which could lead to lower borrowing costs for mortgages, loans, credit cards, and other rates if disinflation keeps progressing.
The “surprise shift” likely refers to the openness to more aggressive easing than the median Fed outlook had previously suggested. No immediate change is on the table—everything remains data-dependent.


META 1 Day Chart

I told the PitBull that I thought the ES was in a big back-and-fill pattern, and as you can see by the ES 5-day chart, it looks that way.
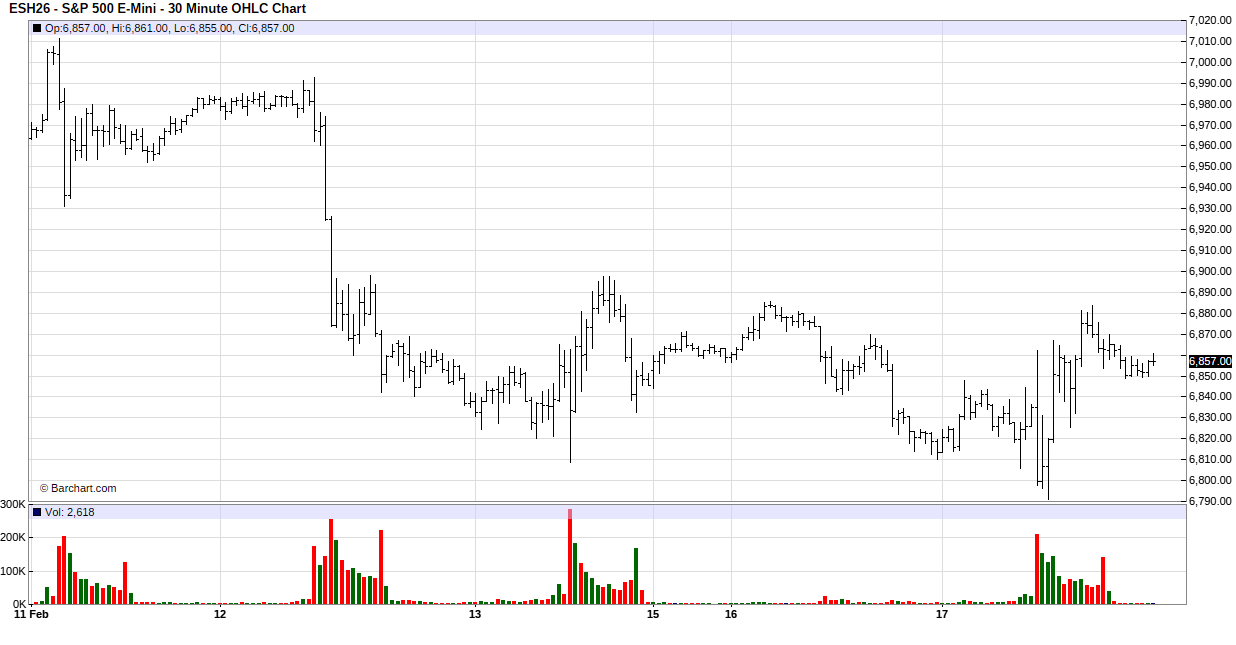
But, and there is always a but with the way these markets act, it can change on a dime.
Our lean: I can’t rule out trading a big gap in either direction on the open, but I may regret this, and I am looking at buying the pullbacks / drops using tight stops.
Technical Price Ladder
Price | Technical Event / Indicator |
6,927.51 | Price 2 Standard Deviations Resistance |
6,907.88 | Price 1 Standard Deviation Resistance |
6,906.25 | Price Crosses 9 Day Moving Average Stalls |
6,905.09 | Price Crosses 9 Day Moving Average |
6,900.33 | Pivot Point 1st Resistance ($R_1$) |
6,897.25 | 14-3 Day Raw Stochastic at 50% / 50% Retracement |
6,884.17 | 14 Day %k Stochastic Stalls |
6,877.54 | 3-10 Day Moving Average Crossover Stalls |
6,867.28 | 38.2% Retracement From 13 Week High |
6,864.75 | Daily High |
6,862.85 | 38.2% Retracement From 4 Week Low |
6,860.50 | Previous Close |
6,859.50 | *Latest Price |
6,848.75 | Daily Low |
6,845.67 | Main Pivot Point (P) |
6,838.95 | 14-3 Day Raw Stochastic at 30% |
6,830.50 | Price Crosses 40 Day Moving Average Stalls |
6,819.83 | Target Price |
6,813.12 | Price 1 Standard Deviation Support |
6,813.00 | 50% Retracement From 13 Week High/Low |
6,809.80 | 14-3 Day Raw Stochastic at 20% |
6,805.83 | Pivot Point 1st Support ($S_1$) |
6,793.49 | Price 2 Standard Deviations Support |
6,778.43 | Price 3 Standard Deviations Support |
Our Lean — Danny’s Trade (Premium only)

Market Recap

The ES traded down to 6805.75 and made a high at 6869.75 on Globex and opened at 6856.00. After the open, the ES traded down to 6834.00. It then traded up to 6861.75 and dropped 65 points down to 6796.25 at 10:00. The ES rallied 35 points back up to 6831.25 at 10:20. It then made a 6791.50 low, retested 6791.50 at 10:35, and traded 6791.00 at 10:40.
The ES then rallied 75.75 points up to 6866.75, sold off down to 6859.25, rallied up to 6883.75 at 2:20, sold off down to 6854.50 at 3:38, traded up to 6867.50 at 3:44, and traded 6861.75 as the 3:50 cash imbalance showed $2.3 billion to buy. It then traded 6866.50, traded down to 6853.50, traded 6863.50 on the 4:00 cash close, and settled at 6860.50, up 10 points or +0.15%.
The NQ settled at 24,767.75, down 35.50 points or -0.14%, the YM settled at 49,612, up 43 points or +0.09%.
In the end, it was another rough and tumble trade. I am convinced that when the “crowd” gets too short or long, the bots know. In terms of the ES’s overall trade, the continued liquidation in the tech / AI sectors is ongoing. In terms of the ES’s overall trade, volume was higher at 1.8 million contracts traded.
On Tap Today: Alibaba Group Holding Ltd (BABA), Analog Devices (ADI), Moody’s (MCO), and Garmin (GRMN) report earnings before the bell. At 8:30 am: Housing Starts (delayed report) for November and December, Building Permits for November and December, Durable-Goods Orders (delayed report), and Durable-Goods minus Transportation. This is followed by Industrial Production and Capacity Utilization at 9:15 am, and the Minutes of the Fed’s January FOMC meeting at 2:00 pm. Booking Holdings Inc (BKNG) and DoorDash (DASH) report after the close.
Things remain very unstable. The continued tech / AI selling, US / Iran negotiations, Walmart earnings, PCE, and the January Friday expiration. I would like to think that things will change for the better, but like I have said, “everything” seems so unstable.
Guest Posts

S&P 500 (ES)

Transition: Cycle Day 1 → Cycle Day 2
“The Only Easy Day Was Yesterday”
Cycle Day 1 was the gift.
The market did what it was supposed to do — emotional relief, mechanical responses, opportunistic entries for traders who were patient enough to wait for the decline and disciplined enough to act.
Now that gift is gone.
Cycle Day 2 doesn’t reward hope. It rewards execution.
Just like the SEALs’ mantra, the lesson is simple:
Yesterday's difficulty is today’s baseline — not today’s challenge.
What the Market Is Teaching Here
Comfort is temporary
The easy trades are behind us. Liquidity thins, reactions sharpen, and the market starts separating tourists from professionals.Discipline replaces enthusiasm
Cycle Day 2 isn’t about chasing strength — it’s about managing risk, respecting levels, and letting price prove itself.Adaptation is mandatory
What worked on Cycle Day 1 won’t work automatically today. Context shifts. Volatility changes character. Patience becomes a weapon.
Cycle Day 2 Mindset
Expect harder trade location
Expect faster punishment for mistakes
Expect fewer, higher-quality opportunities
Demand better execution than yesterday
This is where traders either:
Lean on process
Or get exposed by emotion
Cycle Day 1 rewarded those who waited and executed at the correct time.
Cycle Day 2 rewards those who stay sharp after being right.
Because in markets — just like in elite training —
The only easy day was yesterday.
🎯 Cycle Day 2 — Scenarios in Play
🟢 Bull Case — Buyers Stay in Control
Acceptance north of 6855 ±5
Upside objectives:
• 6875
• 6885
• 6895
Momentum remains constructive as long as price holds above the pivot zone.
🔴 Bear Case — Rotation / Reset
Acceptance south of 6855 ±5
Downside objectives:
• 6835
• 6825
• 6815
Failure to reclaim the pivot opens the door for a controlled reset, not panic.
📊 Key Reference Levels
• PVA High Edge: 6880
• PVA Low Edge: 6832
• Prior POC: 6859
⚠️ Tactical Takeaway
Of course, nothing changes for PTG…Simply follow your plan. Take only Triple A setups and manage the $risk. ALWAYS HAVE HARD STOP-LOSSES in-place on the exchange.
PTG’s Primary Directive (PD) is to ALWAYS STAY IN ALIGNMENT with the DOMINANT FORCE.
ESH

— PTG
From Jeff Hirsch from @AlmanacTrader
February’s Monthly Options Expiration Week Bearish Recently
February’s monthly option expiration week has been mixed with a mild bullish lean over the past 31 years, but it has been outright bearish over the last six years. Weekly average gains range from a meager 0.15% by NASDAQ to slightly better 0.35% by DJIA. Based upon the number of positive weeks, DJIA has the best track record. From 2006 through 2019, S&P 500 was up 12 of 14, but has been down the last six straight February monthly expiration weeks. Monthly option expiration Friday and the week after have a bearish record with average losses over the last 31 years.


MOC Recap
The Market-on-Close imbalance opened with a decisive buy program and held firm for much of the run before a late sell wave flipped the script into the bell.
At 15:50, the market showed a modest $33M buy imbalance, but by 15:51 that expanded aggressively to +$2.15B, with $4.69B to buy versus $2.53B to sell. The $PCT reading surged above 64%, clearly signaling broad demand rather than simple rotation. The S&P 500 reflected this strength with a +$2.05B imbalance, and the Nasdaq showed +$1.44B, where the lean reached +76% — firmly wholesale buying territory.
Sector flows confirmed institutional participation. Technology led with +$565M, Financial Services +$416M, Healthcare +$322M, and Consumer Cyclical +$297M. Energy and Basic Materials both printed above +85% buy lean, strong directional sponsorship. Communication Services posted +82.7%. Utilities showed +59%, more rotational than aggressive. The notable outliers were Industrials at –63.2% and Consumer Defensive at –52.5%, indicating meaningful supply in those groups.
On the tape, MSFT (+$399M), JNJ (+$356M), and NVDA (+$182M) were among the top buy imbalances. TSLA and AAPL also attracted steady demand. On the sell side, MU (–$196M), AVGO (–$90M), CAT (–$70M), and MDT (–$67M) stood out, with semiconductors split between buyers and sellers — suggesting internal rotation rather than uniform distribution.
The turning point came around 15:55 when total imbalance briefly flipped negative (–$133M) and sell pressure accelerated to –$3.3B. By 16:00, the market closed with a –$1.09B net imbalance as buy interest collapsed to $597M against $1.69B to sell. The late $PCT reading of –73.9% marked wholesale selling into the close.
Overall, the MOC transitioned from broad-based institutional buying to aggressive end-of-day distribution — a sharp reversal that traders will need to respect going into the next session.


Technical Edge
Fair Values for February 18, 2026:
SP: 14.81
NQ: 62.26
Dow: 61.08
Daily Market Recap 📊
For Tuesday, February 17, 2026
• NYSE Breadth: 42% Upside Volume
• Nasdaq Breadth: 47% Upside Volume
• Total Breadth: 46% Upside Volume
• NYSE Advance/Decline: 52% Advance
• Nasdaq Advance/Decline: 48% Advance
• Total Advance/Decline: 50% Advance
• NYSE New Highs/New Lows: 188 / 64
• Nasdaq New Highs/New Lows: 152 / 286
• NYSE TRIN: 1.53
• Nasdaq TRIN: 1.03
Weekly Market 📈
For the week ending Friday, February 13, 2026
• NYSE Breadth: 50% Upside Volume
• Nasdaq Breadth: 52% Upside Volume
• Total Breadth: 51% Upside Volume
• NYSE Advance/Decline: 55% Advance
• Nasdaq Advance/Decline: 42% Advance
• Total Advance/Decline: 46% Advance
• NYSE New Highs/New Lows: 653 / 174
• Nasdaq New Highs/New Lows: 675 / 590
• NYSE TRIN: 1.21
• Nasdaq TRIN: 0.63
ES & NQ Futures trading levels (Premium only)


Trading Room Summaries
Polaris Trading Group Summary - Tuesday, February 17, 2026
Cycle Day 1 – Textbook Two-Way Auction with Powerful Cycle Precision
Tuesday was a classic Cycle Day 1 rotational session that showcased the strength of the PTG framework — especially the precision of Cycle Levels, Violation Levels, VWAP structure, and target projections.
Morning Session: Bear Case Executed Early
David identified early that it was Cycle Day 1, which statistically favors an initial decline. The plan was clear:
🔴 Bear Case:
Hold below 6845 ±5 targeting 6835 → 6825 → 6815
✅ The lower target 6815 was fulfilled early in the session.
Price rejected the 6865 “Line in the Sand” and broke the lower sandbox (6845–6865), with aggressive sellers stepping in. The Cycle Day 1 Range Low violation occurred, giving traders a defined structural framework.
The Open Range Strategy trades were stopped out, reinforcing that even well-structured setups can fail in fast-moving auction conditions.
Lesson reinforced: Stops are part of the business. The key was remaining flexible when structure shifted.
Mid-Morning Shift: Violation Low Became the Launchpad
After the early breakdown, price:
Tagged the Cycle Day 1 Violation Level
Aligned with the D-Level Money Box
Converged with the PUT Wall
Rejected lower pricing
David highlighted the inventory transfer process as it unfolded:
Liquidate old inventory → renew lower-priced inventory → draw in shorts → squeeze higher.
That sequence played out cleanly.
🟢 Bulls regained control above Midpoint VWAP
🟢 “Mid-Whopper” cleared
🟢 A squeeze play unfolded
What looked chaotic to many was structured auction behavior.Targets Hit with Precision
Once momentum flipped, the upside projections were executed almost mechanically:
Upside Achievements:
✅ 6865 Range High projection fulfilled
✅ Bull Case 6875 target fulfilled
✅ Three-Day Cycle Target 6880.09 fulfilled
Price pushed into 6885 proximity after clearing 6865 and converting it to support.
David emphasized:
Once Cycle Targets are fulfilled, risk increases for new long entries.
That awareness kept traders from chasing late highs.
Afternoon Structure & Range Context
Total range: 92.75 points
Nearly identical to 3-day average: 94.75
MOC Buy Imbalance: $2.3B (absorbed quickly)
6855 became key late-day decision level
6854 held into the close
A late-day A4 short play was taken and managed via scale-and-trail — demonstrating disciplined system execution even late in session.
Major Lessons Reinforced
Cycle Levels Continue to Dominate
The rally began precisely from:
Cycle Day 1 Violation Level
D-Level
PUT Wall confluence
The structure worked exactly as designed.
Auction Theory in Action
Yesterday was a clean example of:
Inventory transfer
Stop runs
Short squeeze
Target fulfillment
Mean reversion after objectives completed
Mr. Market ran the same “script” again — and PTG traders recognized it.
Flexibility > Bias
Morning bearish bias worked.
Midday required flipping alignment.
Long inventory was repriced lower and strengthened.
Chasing after targets = increased risk.
Staying aligned with structure — not ego — was the edge.
Looking Ahead
Today: Cycle Day 2
Wildcards only apply to Cycle Day 3.
With 3-Day Cycle targets fulfilled, expect higher sensitivity and possible rotational behavior.
Overall Assessment
Tuesday was a strong execution day for those following:
Cycle projections
VWAP structure
Sandbox levels
Scale and trail management
Despite early Open Range stops, the room adapted and captured the larger move. The precision of the Cycle framework continues to stand out.
Discovery Trading Group Room Preview – Wednesday, February 18, 2026
Macro Focus
FOMC January meeting minutes at 2:00pm ET
Ongoing AI impact concerns beneath the surface
Possible Supreme Court ruling this week on legality of Trump-era tariffs
AI & Data Center Expansion
Meta Platforms extended its multi-year AI partnership with Nvidia
Deploying Nvidia’s full AI platform (Blackwell & Rubin GPUs, Grace CPUs, networking stack)
Chips to be rolled out via Nvidia Cloud Partners including CoreWeave and Crusoe
Signals preference for Nvidia over Google TPUs
Nvidia CEO highlighted Meta’s AI scale powering billions of users
India expansion:
Yotta Data Services to build one of Asia’s largest AI hubs using Nvidia Blackwell Ultra chips
~$2B project; 4-year deal worth $1B+
Expected to go live by August in New Delhi
Microsoft and Amazon also expanding AI data centers in India
Earnings
Premarket: ADI, CLH, EBAY, GRMN, GPN, DINO, JLL, PHG, MCO, OMC
After Close: BKNG, CVNA, CF, CRH, DoorDash, EIX, HST, KCG, Molson Coors, NTR, OXY, RS, TS, WES
Thursday Morning: Alibaba, CVE, CNP, DE, EVRG, LYG, PWR, SO, TRGP, FTI, TECK, Walmart, W
Economic Calendar
Durable Goods Orders (delayed release)
Building Permits & Housing Starts (delayed releases)
Capacity Utilization & Industrial Production – 9:15am ET
Fed Governor Michelle Bowman speaks at 1:00pm ET
ES Technical Outlook
Volatility elevated
5-day average daily range: 101.75 points
No whale bias overnight (light large-trader volume)
ES holding intermediate-term uptrend channel
Key support: 6794/97s (held prior LOD)
Next support: 6695/90s
50-day MA: 6934.25 (near-term resistance, in play)
Trendline resistance: 6991/88s, 7145/50s
Structure: Short-term downtrend channel inside intermediate-term uptrend
Broader backdrop: 3+ month sideways consolidation with room for upside within trend structure

