- The Opening Print
- Posts
- Fear’s Still in the Pit, Vol’s Cooling Off, and the Smart Money’s Betting the Range
Fear’s Still in the Pit, Vol’s Cooling Off, and the Smart Money’s Betting the Range
Danny Riley
April 02, 2026
Follow @MrTopStep on Twitter and please share if you find our work valuable!
Our View
Yesterday, prediction markets saw a surge in activity, including over $53 million in wagers on conflict outcomes. According to Polymarket, traders recently assigned a roughly 65% chance that the U.S. and Iran will announce a cease-fire by June 30, a notable increase from 52% in late March.
Simultaneously, data from the Intercontinental Exchange revealed aggressive hedging in the energy sector; traders snapped up options betting that Brent crude could either plummet to $85 a barrel or lower next month or catapult to $120 and above.
While there has recently been a lot of front-running in the futures and options markets, the predictive markets have proven to be where a lot of the inside information bets show up. No matter what happens during tonight's speech, I will not be changing anything I have written.
Our Lean
There should be absolutely no surprise about what's going on. Trump has a history of making bullish headlines after the stock market falls. Since the start of his second term in January 2025, several high-profile instances stand out where market-moving rhetoric shifted following significant drops.
April 2, 2025: “Liberation Day” tariff announcement (start of 11% plunge)
April 9, 2025: Administration pauses tariffs (the “bullish pivot”)
June 2025: Major indices recover all losses to hit new all-time highs
Early October 2025: S&P 500 suffers its sharpest decline since April
October 13, 2025: Administration signals openness to a China trade deal (market rebound)
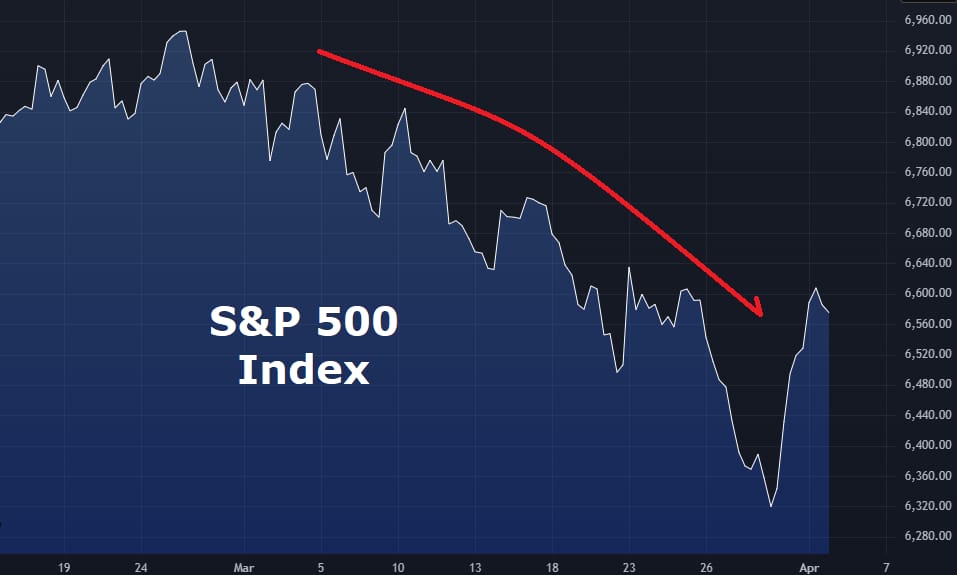
March 2026: S&P 500 enters technical downtrend (8.7% drop from records)
March 26, 2026: Bullish comments follow a 450-point Dow drop
April 1, 2026: Wall Street rallies on ceasefire speculation and the June 30 deadline
So far, I have never thought the war was over. Iran has not agreed to negotiate an end to the war in any straightforward or unconditional way. There is indirect messaging and some diplomatic activity, but Tehran has repeatedly rejected U.S. proposals.
At the end of the day, Trump has mixed this with threats of further strikes on Iranian energy infrastructure if no deal is reached quickly by his April 6 deadline.
The two-day rally is the largest since April 10, 2025, and the largest percentage gain since May 13, 2025, but there have also been some large drops or reversals. The VIX has fallen from 35.45 on March 9th down to 23.49 at 12:00 PM yesterday and settled at 24.54, down 0.71 points or -2.81%.
While still elevated, there seems to be a lower level of fear, yet the Fear and Greed Index is still showing extreme fear.
Our lean: Are the lows in? I don’t know. I asked GROK if the lows were in, and it said:
"Bottom line: April 1's up day was encouraging and tied to hopes the Iran conflict eases (echoing your previous questions on negotiations). But it's too early to call the absolute lows in — this remains a high-uncertainty environment with geopolitical headlines dominating. A sustained break above recent resistance or clear progress on Iran/U.S. talks would strengthen the case for a bottom. If fighting continues or escalates, new lows are very possible."
This pretty much says what I said last week: if there is a negotiated end to the war, the markets will go back up, but traders have made a lot of money betting with Trump after big sell-offs.
My gut says the markets can go higher, my street smarts says... this isn't over until it's over, and we have already rallied sharply. Trump’s speech could be a sell-the-news event.
Claude ES Market Profile Levels
Multi-Timeframe Value Areas

Resistance — Above Current Price (6525.00)
6812.31 — 28-Day MA: Long-term dynamic resistance and proxy for 50-day MA; price is 287 pts below, signaling sustained selling pressure ★★★★☆ strong
6785.00 — VAH Full 28-day: Upper boundary of value area; rejection confirms distribution ★★★★☆ strong
6753.42 — Session High: Key short-term reference; watch for rejection wicks ★★★☆☆ moderate
6725.13 — 50% Retrace 13-Wk: Major mean reversion level; part of 6720–6725 resistance cluster ★★★★☆ strong
6703.58 — Pivot R2: Extended upside target; less relevant intraday ★★☆☆☆ minor
6685.00 — VAH Recent 5-Day: First meaningful bull signal if reclaimed ★★★★☆ strong
6675.00 — POC Full 28-Day: Highest volume node; major structural resistance ★★★★★ key level
6663.68 — VWAP 28-Day: Confirms bearish bias below; reclaim = recovery signal ★★★★☆ strong
6660.67 — Pivot R1: Intraday upside target; part of 6660–6675 resistance cluster ★★★☆☆ moderate
6641.28 — 18-Day MA: Short-term trend resistance ★★★☆☆ moderate
6620.00 — POC Recent 5-Day: Near-term fair value; reclaim signals strength ★★★★☆ strong
6617.75 — Previous Close: Key reference for intraday bias ★★☆☆☆ minor
6610.83 — Daily Pivot: Bull/bear dividing line; price below = bearish tone ★★★☆☆ moderate
Current Price
6525.00 — At VAL Recent / Current; critical level
Support — Below Current Price
6575.00 — VAL Full 28-Day: Needs reclaim to restore value acceptance ★★★★☆ strong
6567.92 — Pivot S1: First downside target; part of 6568–6575 support zone ★★★☆☆ moderate
6549.44 — 9-Day MA: Now resistance on bounce attempts ★★★☆☆ moderate
6525.00 — VAL Recent 5-Day: Key level; breakdown opens downside ★★★★★ key level
6518.08 — Pivot S2: Immediate support below; failure accelerates selling ★★★☆☆ moderate
6491.48 — Stochastic 30%: Oversold warning zone ★★☆☆☆ minor
6475.17 — Pivot S3: Extreme downside level; panic signal if reached ★★★☆☆ moderate
6469.60 — 2 Std Dev: Statistical support; outside normal range ★★★☆☆ moderate
6445.40 — Stochastic 20%: Deep oversold; bounce potential ★★☆☆☆ minor
6436.31 — 3 Std Dev: Extreme outlier; high-probability mean reversion ★★★★☆ strong
6353.25 — 13-Week / 1-Month Low: Major breakdown level ★★★★★ key level
6306.16 — 61.8% Retrace 52-Wk: Long-term support target ★★★★★ key level

Guest Posts:
Dan @ GTC Traders
Overall Bias … Process … Execute
In the beginning of March, GTC Traders mentioned in it’s X stream we were both hedged on core positions, as well as short major indices in our individual models and programs. We have been pretty vocal in the X stream, that we have maintained those hedges, and outright short postions.
Pretty sagacious …
We have outlined that we feel ones should be looking at the WTI Crack Spread in Energy, as in this environment we feel this is an good indication of stress through the refining of Oil products. I wish I had better news to report this morning … but … the WTI Crack Spread is moving higher since last night. Dramatically so ...
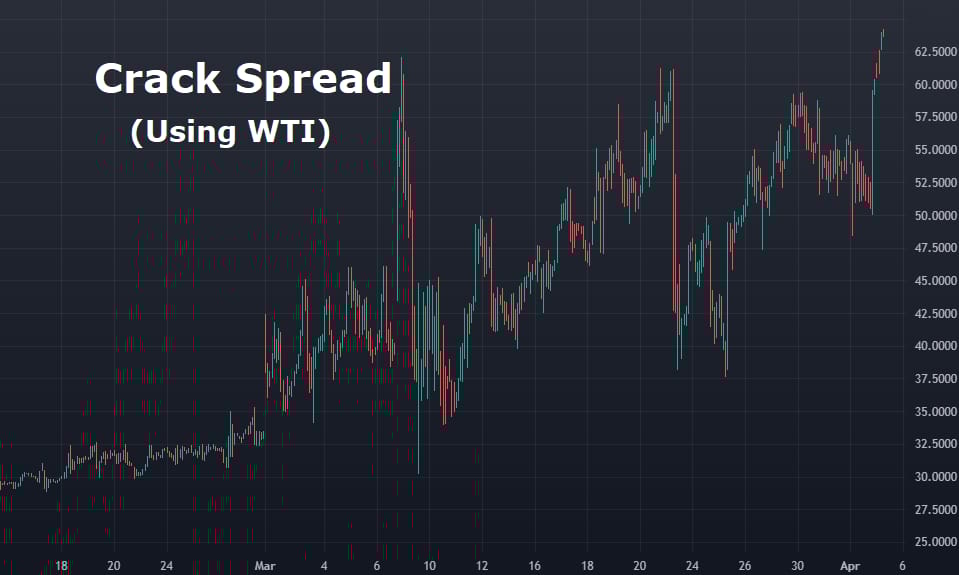
But we have experienced the rally here in the last few days.
So now what?
We are very process driver traders. It doesn’t matter what overall market we have positions in. You will find the exact same overall … outline … to looking for trades.
Overall Bias on that instrument, or risk, which leads to a process to look for positive expectancy. And then you can ‘execute’ trades to a given risk model.
So, with the rally of the last few days, again we ask … now what?
Bias: Our Bias has not changed. We are net ‘bearish’ on risk. That can change with an unpredicatble future. But ‘today’ our bias on risk, is that we are bears.
Process: We don’t, as we say in the industry: style-drift. The parameters of all of the 9 models that we demonstrate, will remain. This is to say, simply because we seem to be moving to a new ‘regime’ in markets for the last 30 days … ... we are not going to reinvent our wheel or abandon the core mechanics that have consistently defined our edge.
Execute: The parameters we have established for entering trades can be either ‘loose’ … or ‘tight’.
We are now reaching a stage in this regime, where the rally at the end of March does not really mean much to us, other than an opportunity to get short.
This morning, we are actively looking for a way to get short when our models give us the ‘green light’. And quite frankly after talking over events with Partners? We’re fine with ‘loose’ parameters to get short. It is simply important to us that those models that have given us the ‘green light’?
We get short.
That’s simply our thoughts … not yours. Until next time … stay safe … and trade well.
Market Recap:

The ES made a low at 6561.0, rallied up to 6643.75, and opened Wednesday's regular session at 6606.25, up 37.25 points or +0.56%.
After the open, the ES traded 6602.50, rallied up to 6628.50 at 9:35, sold off down to a 6598.00 “double bottom”, rallied 41.75 points up to 6639.75 at 11:20, and pulled back to 6627.25. It then rallied 22.50 points up to 6649.75 at 11:55, pulled back to 6636.25, and rallied up to a new high at 6653.25 at 1:20 (brick wall), before selling off 49.25 points down to 6604.00 at 2:35.
The ES traded back up to 6622.25, pulled back to 6609.00 at 2:55, then traded up to 6634.75 at 3:40. It traded 6626.75 as the 3:50 imbalance came out flat but flipped to $1.5 billion to sell, traded down to 6614.50 at 3:55, and traded 6615.50 on the 4:00 cash close.
After 4:00, the ES traded up to 6623.75, flatlined around the 6620.00 level, and settled at 6615.50, up 46.50 points or +0.71%. The NQ settled at 24,394.25, up 165.75 points or +0.68%, the YM settled at 46,592, up 129 points or +0.28%, and the RTY settled at 2480.90, up 10.10 points or +0.41% on the day.
From Monday’s Globex low at 6353.25 to yesterday's high at 6653.75, the ES has gained 300.50 points or 4.73%. From Monday’s Globex low at 22,961.50 to yesterday's high at 24,348.25, the NQ has gained 1386.75 points or 6.04%. From Monday’s Globex low at 40,052 to yesterday's high at 47,090, the YM has gained 7,038 points or 17.57%, and from Monday’s low of 2418.80 to yesterday's high at 2557.00, the RTY has gained 138.20 points or 5.71%.
In the end, the markets have performed nicely over the last 3 sessions, with big gains and little pullbacks. In terms of the ES’s overall tone, it was firm. In terms of the ES’s overall trade, volume was lower at 1.69 million contracts traded.
I'm not going to do a big OP tonight. We all know President Trump will be addressing the nation at 9:00 ET, and he has already said what he will be talking about: the wind-down of U.S. military operations within a few weeks without securing the opening of the Strait of Hormuz, which will probably keep oil prices and inflation high.
He will more than likely share his views on leaving NATO. This brings us back to when there was another monster rally after he announced his Liberation Day last year, when he suddenly paused his tariffs, which pushed the Nasdaq up 10% in one day.
MiM
The MOC session opened with a relatively balanced tone, showing a modest net buy imbalance of +$67M, masking what would quickly evolve into a much heavier sell-driven environment. Early prints around 15:50–15:51 showed strong buy programs hitting the tape, with over $2.9B in buy-side flow, but this strength was immediately met—and then overwhelmed—by aggressive sell pressure. By 15:52, the tape flipped decisively, and the imbalance expanded sharply to the downside, ultimately reaching a peak sell skew of roughly -$1.3B around 15:54.
From a structural standpoint, this was not rotational flow—it was directional. The sustained readings between -50% and -62% through the bulk of the window confirm persistent institutional sell programs rather than two-way trade. The close never meaningfully rebalanced, finishing with a -62.5% lean, reinforcing that supply dominated into the bell.
Sector participation was notably polarized. Technology (+69.8%) and Consumer Cyclical (+67.1%) showed strong buy-side interest, indicating targeted accumulation, particularly in semiconductors. Names like NVDA ($253M), AMAT ($145M), AVGO ($138M), and MRVL ($132M) were aggressively bid, suggesting continued institutional preference for AI and chip exposure. Energy (+66.9%) also leaned buy, though with less breadth.
On the sell side, the pressure was far more broad-based and aggressive. Healthcare (-78.5%), Consumer Defensive (-73.8%), and Communication Services (-70.7%) all registered extreme negative leans, signaling wholesale liquidation. Financials (-67.7%) and Basic Materials (-68.2%) also crossed the -66% threshold, confirming systematic distribution across defensives and cyclicals alike.
Index-level divergence was also key. Nasdaq showed a strong buy imbalance (+60.4%), driven by tech inflows, while the NYSE (-56.8%) and S&P 500 (-51.6%) reflected broader market selling. This split underscores a concentrated bid in mega-cap tech against a backdrop of wider market de-risking.
Overall, this MOC was characterized by programmatic selling into the close, partially offset by targeted accumulation in semiconductors—suggesting defensive rotation out of broad equities and into select growth leadership.


Technical Edge
Fair Values for April 2, 2026
S&P: 43.26
NQ: 186.9
Dow: 232.72
Daily Breadth Data 📊
For Wednesday, April 1, 2026
• NYSE Breadth: 53% Upside Volume
• Nasdaq Breadth: 55% Upside Volume
• Total Breadth: 54% Upside Volume
• NYSE Advance/Decline: 65% Advance
• Nasdaq Advance/Decline: 66% Advance
• Total Advance/Decline: 66% Advance
• NYSE New Highs/New Lows: 31 / 59
• Nasdaq New Highs/New Lows: 91 / 115
• NYSE TRIN: 1.66
• Nasdaq TRIN: 1.57
Weekly Breadth Data 📈
For the Week Ending Friday, March 27, 2026
• NYSE Breadth: 54% Upside Volume
• Nasdaq Breadth: 47% Upside Volume
• Total Breadth: 50% Upside Volume
• NYSE Advance/Decline: 47% Advance
• Nasdaq Advance/Decline: 39% Advance
• Total Advance/Decline: 42% Advance
• NYSE New Highs/New Lows: 156 / 308
• Nasdaq New Highs/New Lows: 217 / 837
• NYSE TRIN: 0.74
• Nasdaq TRIN: 0.72
S&P 500/NQ 100 BTS Trading Levels (Premium Only)
BTS are daily generated levels created using a combination of proprietary calculations and AI to define an upper range target and a lower range target, split by a bull/bear line. You receive daily charts along with clear descriptions of each level to help guide your trading.
Take a Free Premium Trial to see them in action.
This Week’s High Importance

Earnings:

Recent

Trading Room News:
PTG Room Summary – For Wednesday, April 1, 2026
The session unfolded as a clean, structured Cycle Day 2, with solid execution around key levels and a strong emphasis on reading market conditions correctly.
Morning Outlook & Key Levels
David framed the day early with a “make or break” macro backdrop, noting the potential for:
Upside toward ~6645–6750 on de-escalation
Or sharp downside if risk escalated
Right out of the gate, the 6645 target (±5) was essentially nailed, with price tagging 6643.75 HOD—a strong example of level precision and preparation paying off.
Trade Structure & Market Behavior
The core framework revolved around:
6580 pivot zone
Above = bullish recovery targets (6605 → 6615 → 6645)
Below = controlled distribution (6560 → 6530)
The market behaved as expected for much of the session:
Balanced, rotational price action early
No panic selling—orderly, grinding structure
Transition into bullish consolidation and range expansion
David later confirmed this clearly:
Cycle Day 2 early bullish consolidation → upside continuation
What Worked Well
$BOX and D-levels continued to perform reliably
Precision on key levels (6645 callout)
Recognition of Cycle Day 2 behavior (balance → expansion)
Manny’s levels and timing added confluence:
+5 pts executed (6646 → 6651)
Market respected intraday timing ("the clock")
Key Lessons & Insights
1. Market Type Matters
Several traders noted the difficulty of trading a range-bound environment
Important takeaway:
→ Not all days are worth aggressive trading
→ Wait for alignment + momentum (ATR expansion) when possible
2. ATR & Structure Awareness
Great discussion on:
ATR “shelves” = consolidation clues
ATR4 vs ATR7 behavior in ranges
Reinforces: context > signals
Afternoon & Close
Market stayed balanced overall
Typical Cycle Day 2 behavior:
Settled near mid-VWAP
No strong directional conviction into close
Notable:
MOC sell imbalance (~$1.5B) late
Final characterization:
→ Balanced day with slight upside lean
Overall Takeaway
This was a textbook structure day, not a trend day:
Levels worked
Structure held
But required patience and realistic expectations
Best performers:
Traders respecting levels and taking quick, disciplined profits
Those recognizing conditions vs forcing trades
DTG Room Preview – Thursday, April 2, 2026
Macro Focus: Markets remain centered on the Iran conflict and fallout from Trump’s speech. Lack of clarity on exit strategy pressured risk assets while boosting oil.
Market Reaction: Crude +6% (~$107). Equities and futures lower; Treasuries, gold, and BTC also sold off.
Key Theme: Energy shock > oil shock. Middle East disruptions impacting not just oil, but also gas, fertilizer, and broader supply chains.
Macro Outlook: BofA now sees mild stagflation—slower growth, higher inflation (~3.6% in 2026), and sustained ~$100 oil.
Holiday Impact: Good Friday closure tomorrow → expect lighter liquidity and muted moves later today. Jobs report Friday will be digested Sunday night.
Volatility: Recently elevated but may compress into the holiday.
Positioning: No strong whale bias; overnight flow light/mixed.
ES Technicals:
Back inside downtrend channel after brief breakout
Resistance: 6642–6647, then 6682–6687
Support: 6300–6295
200DMA (6777) remains out of reach near-term
Today’s Data / Events:
Job Cuts (7:30 ET), Claims + Trade Balance (8:30 ET)
Fed speakers: Logan (10:15), Bowman (12:45)
Bottom Line:
Geopolitics driving price action, with energy markets leading. Expect choppy, lighter conditions into the long weekend unless headlines shift materially.

