- The Opening Print
- Posts
- Discovery Lower, No Peace in Sight — This Tape’s Got More Pain To Come
Discovery Lower, No Peace in Sight — This Tape’s Got More Pain To Come
Danny Riley
March 24, 2026
Follow @MrTopStep on Twitter and please share if you find our work valuable!
Our View
This shit is not over, and while I’m not betting the bank on it, I think we will see new lows. Trump has had a long history of making unfounded statements, and he doesn’t like it when the stock market falls. It really feels like the Indians are circling the wagons. The deadline Trump set for Iran to reopen the Strait of Hormuz is Friday. The 2200 Marines of the 31st MEU arrive in CENTCOM on Friday, and the USS Tripoli and USS New Orleans dock the same day.
Bottom line: the war is not over, nor is it going to be anytime soon. In fact, Ali Larijani, Iran’s top security official who warned Trump to tread carefully, was killed by an Israeli missile strike last week, eliminating one of the remaining moderate voices left in the Iranian government. I also think Trump was taking heat when he put out the garble about talking to Iran about ending the war when he was at Mar-a-Lago at 7:31 am Monday.
I think the big question is... does Trump have an exit strategy? And if he does, does that mean the Israelis will just stop fighting? Furthermore, do you really think Iran will agree to the demands set by the U.S.?
A five-year missile program halt
Zero uranium enrichment
The decommissioning of Natanz, Isfahan, and Fordow nuclear facilities
Strict observation protocols on nuclear-related machinery
Arms control treaties with regional countries
No financial support to proxy groups, including Hezbollah, Houthis, or Hamas
I don’t think so. Japan is out of oil. There is a spyware attack affecting hundreds of millions of iPhones that allows hackers to use a new malware tool called DarkSword if users have not recently updated their software, according to cybersecurity researchers. You just can’t make this shit up!
Our Lean — Danny’s Trade (Premium only)

Guest Posts:
From Jeff Hirsch from Stock Traders Almanac
follow on Twitter @AlmamacTrader
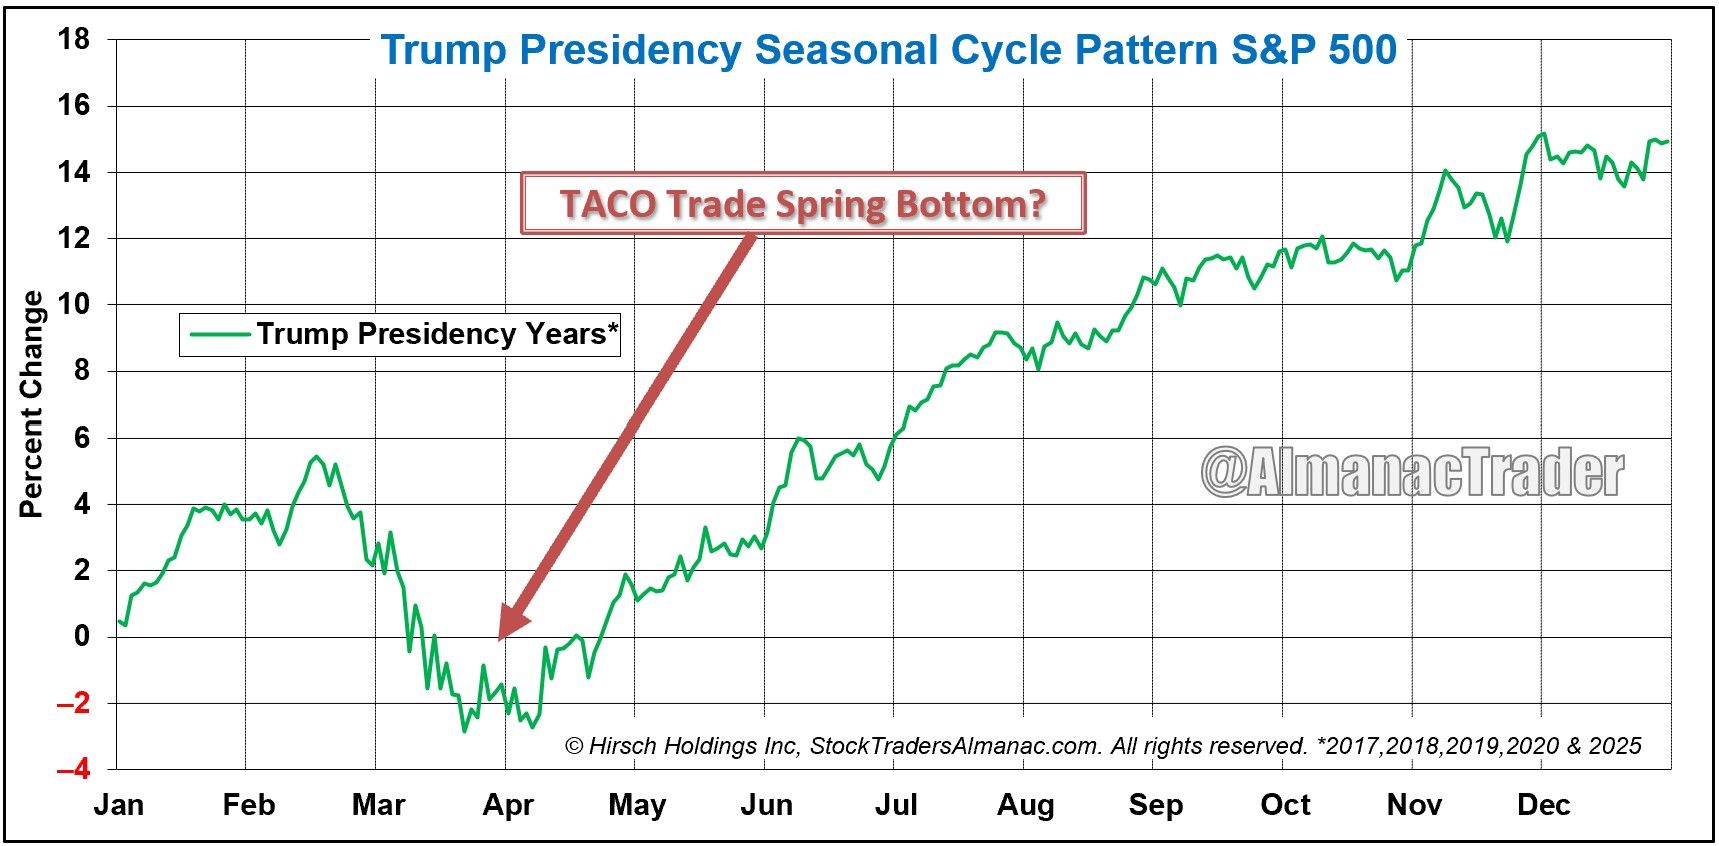
Trump Presidency Seasonal Cycle Pattern: Q1 Shock. Q2-Q4 Awe. Is this another Trump TACO Trade Spring Bottom? Dow Futures up 1,200+ points on Iran deal news this morning. VIX over 30 at the open. And one of the classic TACO trades in recent memory — the 5th biggest 5-minute bar of all time.Five Trump presidency years — 2017, 2018, 2019, 2020, 2025 — same pattern every time: Q1 turbulence, Q2 bottom, then a sustained rally into year-end. Art of the Deal, seasonal edition.#TACO #TACOTrade #TrumpSeasonality #SpringBottom #MarketCycles #Seasonality #StockTradersAlmanac #SPX #VIX #ArtOfTheDeal--
Tom Incorvia - Blue Tree Strategies
SPY: S&P 500 ETF

What stands out is how cleanly the market has organized into three distinct distributions, separated by low-volume areas. This is the market moving from price discovery → slower advance → extended balance.
1) April–June: strong directional auction
2) June–September: directional, but more two-sided trade
3) October–Present: 7-month balance, clear value established
The Key Level: 649
Price is now testing ~649, a low-volume boundary between distributions. This is a structural decision point.
Acceptance below 649 → rotation toward the next value area at 607
Rejection → continued rotation within the current balance
Bottom Line
If accepted below 649, the market is likely transitioning to the 607 value area—not breaking down, but moving to the next distribution.
You can purchase Tom’s Course on Volume Profile here
Market Recap
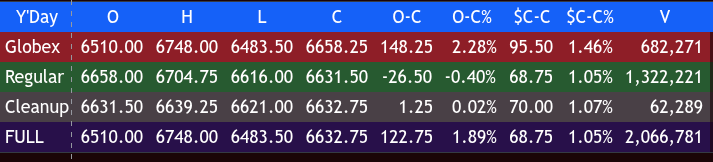
After Trump’s 48-hour deadline, he TACOed. The ES sold off down to 6535.00 on Globex Sunday night, rallied up to 6648.00, and opened Monday’s regular session at 6658.00.
After the open, the ES traded 6643.75, rallied up to 6662.00, then sold off down to 6638.00 at 9:35. The ES made 6 higher highs up to 6701.50 at 10:20, then sold off down to 6677.50 at 10:45, rallied up to a new high at 6704.75 at 11:00, then sold off 69 points down to 6635.50 at 11:55. It rallied up to 6653.75 at 12:10, sold off down to 6616.00 at 12:25, rallied up to 6644.75 at 12:50, then sold off down to 6620.00 at 1:20. It rallied up to 6659.75 at 1:35, sold off down to the VWAP at 6640.00 at 1:45, traded up to 6660.75 at 2:00, then sold off down to 6642.50 at 2:05. It traded back up to 6674.25 at 2:38, then sold off down to 6647.75 at 3:25, rallied up to 6661.25 at 3:47, then sold off down to 6652.50 at 3:48, and traded 6655.75 as the 3:50 cash imbalance showed $1.6 billion to sell.
The ES then sold off down to 6621.00 and traded 6631.50 on the 4:00 cash close.
After 4:00, the ES rallied up to 6639.25 at 4:40 and settled at 6634.75, up 75.75 points or 1.15%. The NQ settled at 24,101.50, up 308.50 points or 1.30%, the YM settled at 46,208, up 629 points or 1.38%, and the RTY settled at 2509.60, up 28.40 points or 1.14% on the day.
In the end, one has to ask... who got long before Trump came out saying Iran and the U.S. want to make a deal to end the war? In terms of the ES’s overall tone, the best way to describe it was “wishy-washy.” In terms of the ES’s overall trade, volume was on the higher side at 2.069 million contracts traded.
The $9 Trillion Maturity Wall
Broader or cumulative views (including extensions from prior years and multi-year waves) cite figures like over $1.5 trillion in CRE loans maturing by the end of 2026 (or well over that when combining 2025–2026 activity), with some sector-specific outlooks (e.g., CMBS loans) highlighting ~$100 billion+ maturing in 2026, over half at high default risk.
This “wall” (or “wave”) stems from shorter-term loans (5–10 years) originated in a low-rate environment now rolling over into a higher-rate one, potentially leading to extensions, restructurings, higher delinquencies (already elevated in office), or distress sales—but many analysts view it as manageable and anticipated, creating opportunities in private credit or selective refinancing rather than a systemic crisis.
Regarding China selling (likely U.S. Treasuries or bonds), recent developments show Beijing urging its banks and institutions to limit or reduce holdings of U.S. Treasuries, citing market volatility, concentration risks, and security concerns (reported in early February 2026). China’s official holdings have trended downward over the years (halved since 2013 peaks, now around the $700–900 billion range depending on data adjustments for custodians), with net selling in recent months and BRIC nations quietly reducing exposure.
This has contributed to temporary upward pressure on Treasury yields and “Sell America” chatter, though impacts have been muted so far—markets see it more as gradual diversification/geopolitical hedging than aggressive dumping. No direct link ties China’s Treasury sales to the CRE maturity wall, but broader bond market dynamics (e.g., higher yields from any foreign selling) could indirectly raise refinancing costs for CRE borrowers.
MiM
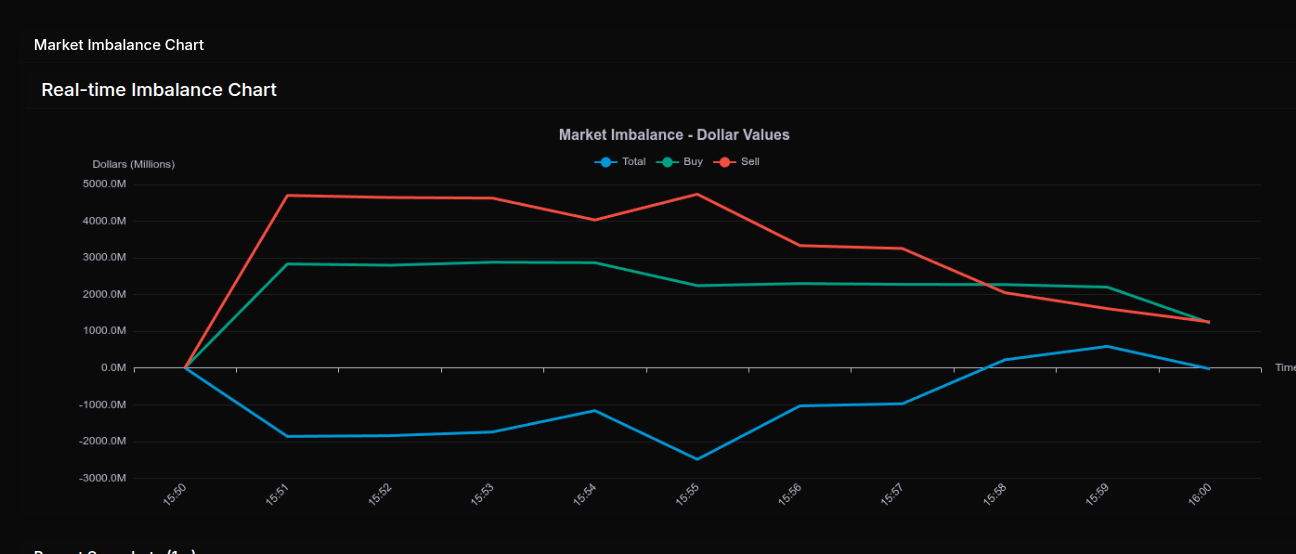
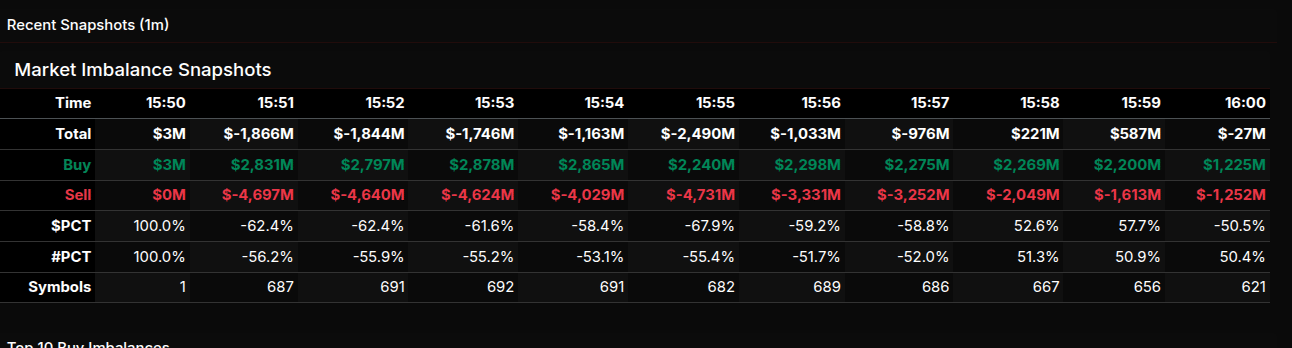
Market-on-Close Recap – MiM
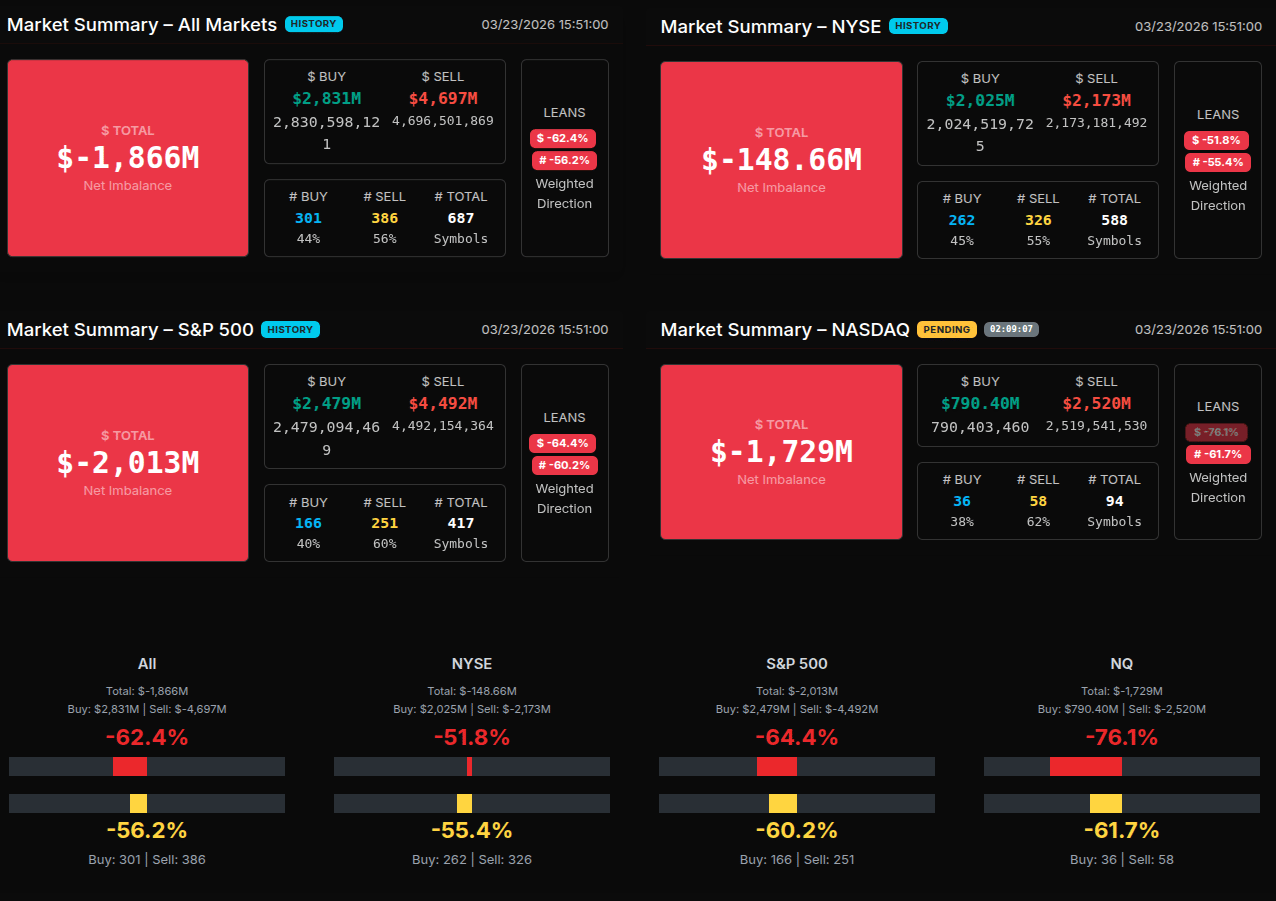
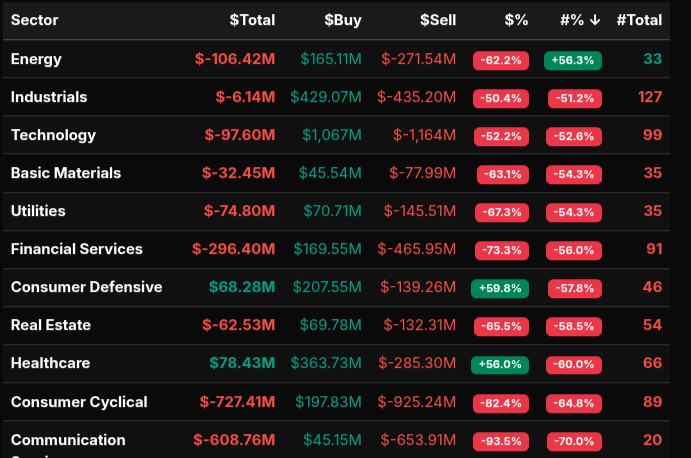
The MOC session opened with immediate and aggressive sell-side pressure, setting the tone for a broadly risk-off close. At 15:51, the market quickly expanded to a -$1.86B imbalance with a -62.4% lean, clearly signaling institutional supply overwhelming demand. This was not rotational activity—this was directional selling. The sell pressure persisted and intensified into 15:55, where the imbalance peaked near -$2.49B and maintained a strong negative skew of -67.9%, confirming sustained program-driven liquidation.
From a sector perspective, the sell-side was widespread and decisive. Communication Services (-93.5%) and Consumer Cyclical (-82.4%) showed extreme downside leans, well beyond the -66% threshold, indicating wholesale selling rather than two-way flow. Financials (-73.3%) and Utilities (-67.3%) also participated in heavy distribution, reinforcing the broad-based nature of the sell program. Even typically defensive areas like Real Estate (-65.5%) and Basic Materials (-63.1%) leaned heavily negative.
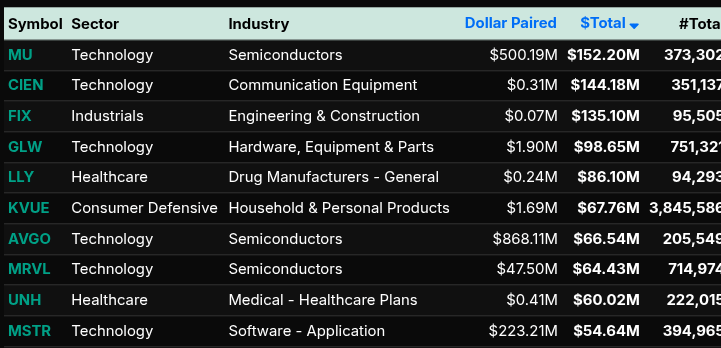
There were pockets of relative strength, but these were more rotational than structural. Healthcare (+56.0%) and Consumer Defensive (+59.8%) saw buy imbalances, though neither exceeded the +66% threshold, suggesting repositioning rather than aggressive accumulation.
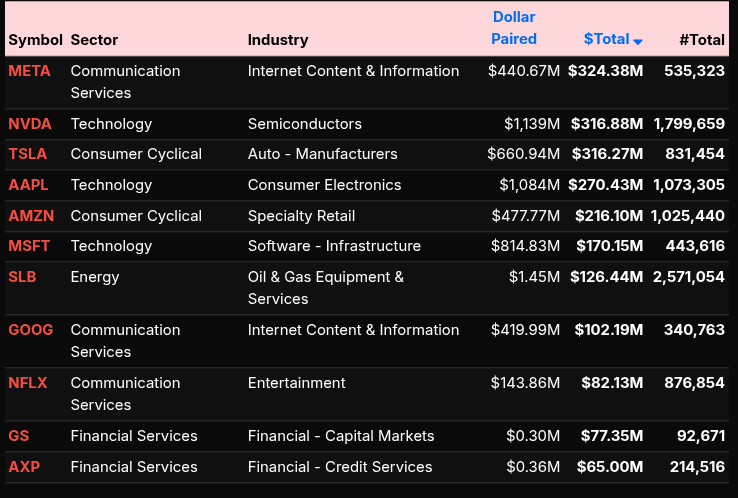
On the symbol level, the sell pressure was concentrated in high-beta and index-heavy names. TSLA (-$316M), NVDA (-$316M), META (-$324M), and AAPL (-$270M) dominated the tape, alongside AMZN and MSFT. This aligns with the Nasdaq imbalance of -76.1%, the most extreme among the indices, confirming tech-led distribution. Financial names like GS and AXP also contributed to the downside.
Into the final minutes, the market attempted a modest recovery, flipping briefly positive at 15:58 (+52.6%), but this lacked conviction and quickly faded back to a -50.5% lean into the close. This late rotation suggests some short covering or pairing, but not a meaningful shift in control.
Overall, this was a structurally bearish MOC driven by systematic sell programs, with limited evidence of true buy-side sponsorship.
Technical Edge
Fair Values for March 24, 2026:
SP: 51.54
NQ: 218.88
Dow: 297.55
Daily Market Recap 📊
For Monday, March 23, 2026
NYSE Breadth: 79% Upside Volume
Nasdaq Breadth: 75% Upside Volume
Total Breadth: 76% Upside Volume
NYSE Advance/Decline: 81% Advance
Nasdaq Advance/Decline: 74% Advance
Total Advance/Decline: 76% Advance
NYSE New Highs/New Lows: 28 / 57
Nasdaq New Highs/New Lows: 56 / 196
NYSE TRIN: 1.07
Nasdaq TRIN: 0.93
Weekly Breadth Data 📈
For Week Ending Friday, March 20, 2026
NYSE Breadth: 41% Upside Volume
Nasdaq Breadth: 45% Upside Volume
Total Breadth: 44% Upside Volume
NYSE Advance/Decline: 28% Advance
Nasdaq Advance/Decline: 29% Advance
Total Advance/Decline: 28% Advance
NYSE New Highs/New Lows: 155 / 291
Nasdaq New Highs/New Lows: 194 / 716
NYSE TRIN: 0.53
Nasdaq TRIN: 0.48
ES & NQ Levels (Premium only)
Calendars
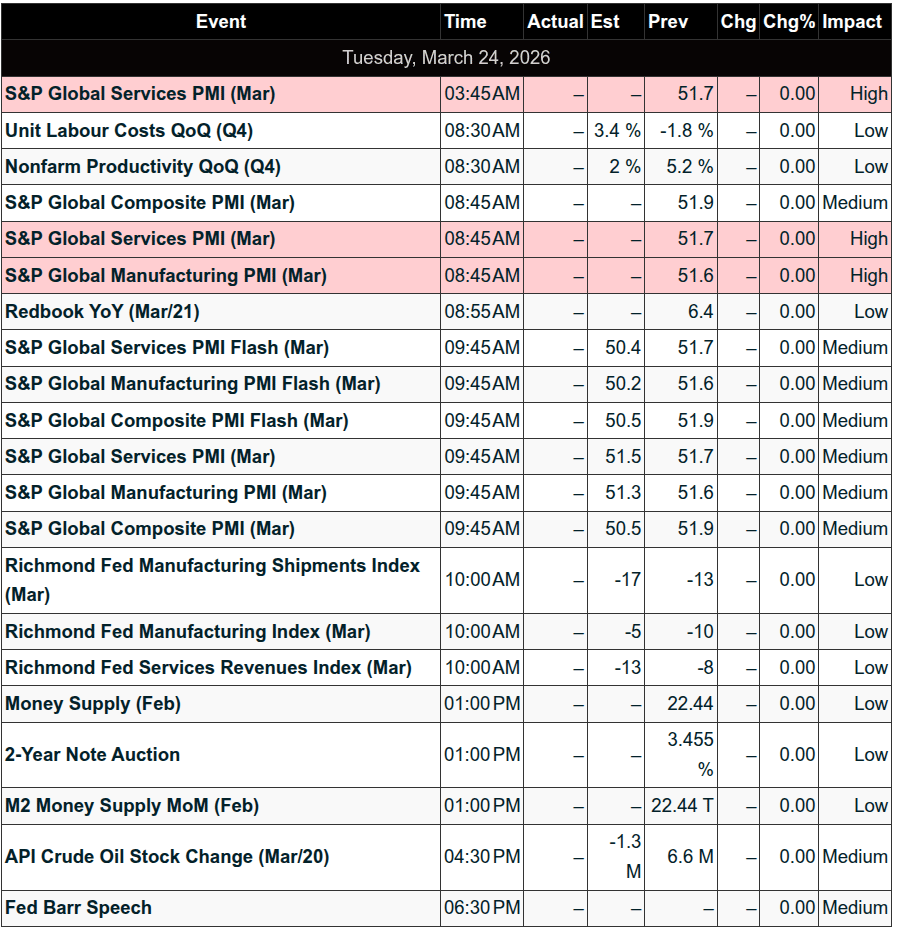
Economic Calendar
Today
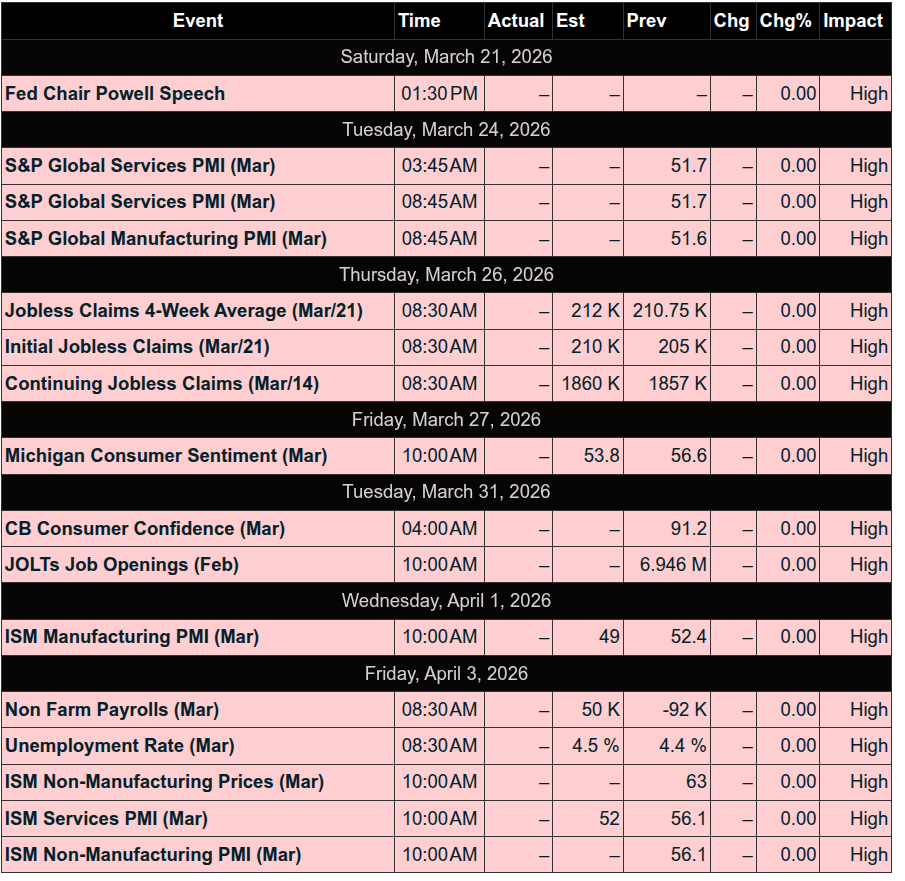
Important Upcoming
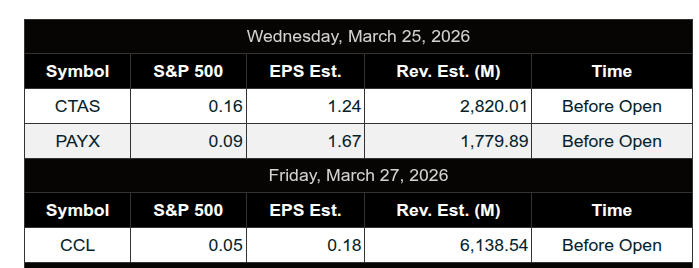
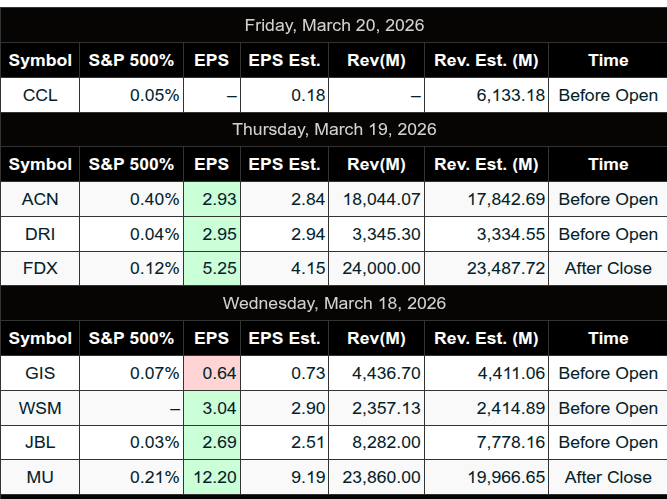
Earnings
Recent
Trading Room Summaries
Polaris Trading Group Summary - Monday, March 23, 2026
The day started off a bit rough operationally with technical difficulties at the open, delaying the usual structure and communication. Despite that, once things got going, the focus quickly shifted back to process and execution.
Market Context & Expectations
The ES had an extremely large overnight range (~264 points) driven by external news (POTUS comments).
This immediately set the tone: high volatility, wide rotations, and a non-standard Cycle Day 1 (levels blown out).
David emphasized: nothing changes for PTG — stick to the system (SSDD).
Key Levels & Trade Logic
6685 → Bullish trigger (clear & convert = squeeze potential higher)
6640 → Critical risk marker for longs
Market respected these concepts with:
Rotations around key levels
Repeated tests (notably the 6640 back-test later in the day)
David reinforced decision-based trading:
“What needs to happen next?” thinking
Clear separation of bull vs bear scenarios
Intraday Price Action
The session evolved into a classic “round-robin” day:
Push higher
Full reversal of gains
This type of environment:
Punishes directional bias
Rewards level-to-level execution and flexibility
Into the close:
$1.6B MOC sell imbalance
Reinforced the late-day weakness / reversal structure
Trader Development & Room Insights
Some really strong process-oriented discussions today:
Flat at end of day = mental edge
Reduces emotional carryover
Promotes consistency
Repetition & backtesting
One trader logged 1400 trades of data
Immersive learning (“seeing tick charts in sleep”) = pattern recognition forming
Dealing with doubt
Acknowledged as part of the journey
Reinforces importance of rules over feelings
Pattern recognition & AI discussion
Interest in identifying unfavorable conditions
Shows progression from execution → analysis
Key Lesson of the Day
Volatile, news-driven markets amplify rotation — not trend.
Don’t chase breakouts blindly
Trust risk markers and level reactions
Stay neutral and responsive, not predictive
Discovery Trading Group Room Preview – Tuesday, March 24, 2026
Macro Focus: Middle East tensions + Flash PMIs driving sentiment
Geopolitics:
Trump delayed Iran energy strikes by 5 days → boosted equities
Claims of “productive” US-Iran talks denied by Iran
Backchannel negotiations reportedly ongoing via Egypt, Turkey, Pakistan
Conflicting headlines keeping uncertainty elevated
Market Reaction:
Stocks surged premarket Monday on de-escalation hopes
Heavy oil selling (~6M barrels in minutes) preceded Trump announcement
Volatility elevated; ES 5-day avg range now ~152 pts
Earnings:
Today: GME
Tomorrow: CTAS, PAYX
Economic Data (Today):
8:15 – ADP Employment
8:30 – Productivity & Unit Labor Costs
9:45 – Flash PMIs
10:00 – Richmond Fed
Positioning:
No clear whale bias (light, mixed overnight flow)
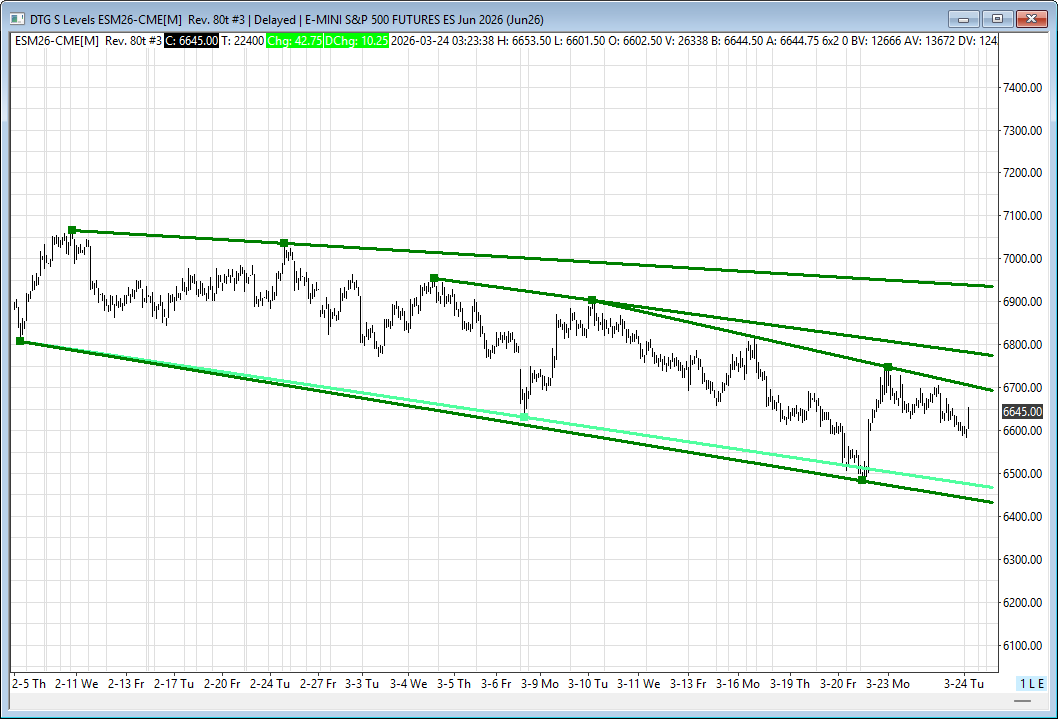
Technical Setup (ES):
200-day MA (~6767) = key resistance
Price rejected near that level Monday
Short-term downtrend channel shifted slightly lower
Key Levels:
Resistance: 6712–6707, 6775–6770, 6940–6935
Support: 6445–6440