- The Opening Print
- Posts
- Dead Cat Bounces, 6900 Fights, and a Supreme Court Wild Card — Welcome to the 4-Day Meat Grinder!
Dead Cat Bounces, 6900 Fights, and a Supreme Court Wild Card — Welcome to the 4-Day Meat Grinder!
Danny Riley
February 17, 2026
Follow @MrTopStep on Twitter and please share if you find our work valuable!
Our View
Last week, when Chinese regulators advised financial institutions, including banks, to limit or reduce their holdings of U.S. Treasuries, it was one of the largest data points in a very long time and shows China no longer wants to deal in the U.S. dollar. Am I surprised by this? Absolutely not. The move is part of a broader trend where China has been gradually reducing its overall reliance on U.S. debt.
As I stated early last week, at its highs China held $1.3 trillion in U.S. Treasuries. As of the end of 2025, it dropped to $888.5 billion. I don't know all the detail, but Goldman Sachs economist Jim O'Neill coined the acronym BRIC (Brazil, Russia, India, China) in 2001, and the actual intergovernmental cooperation started in 2006 on the sidelines of the UN General Assembly in New York, with the first formal BRIC summit occurring in June 2009 in Yekaterinburg, Russia.
When I started writing this and typed in BRICs, a Wall Street Journal story came up titled Forget the 'Sell America' Trade. Here Comes 'Hedge America.' and the first line of the story was this...
The threat that foreigners could dump U.S. assets—or “Sell America”—has loomed over markets since President Trump returned to office last year and upended the world order.
The slide in the dollar to multiyear lows is the clearest sign that foreigners are nervous about the U.S., where they have invested $36 trillion into stocks and long-term bonds. Foreign purchases of U.S. Treasuries have slowed, and some investors, like European pension funds, have turned to sellers.
Here is a link to the story. Unfortunately, it is behind a pay wall. If you do not have a subscription to the WSJ, I suggest finding some way to read it or asking an AI tool to recap the story. Forget the ‘Sell America’ Trade. Here Comes ‘Hedge America.’
It’s a striking shot of the “divestment” of America and the U.S. dollar and how, with its weakness now, the investing calculus has changed and, at least to me, it seems like it is far from over. Below is a 5-year chart of the Dollar Index (DXY). As you can see, in October of 2022, the dollar was trading above 114.65 and made a low at 95.55 on 1/27/26. Below is a 5-year chart of the DXY as of Friday’s close.
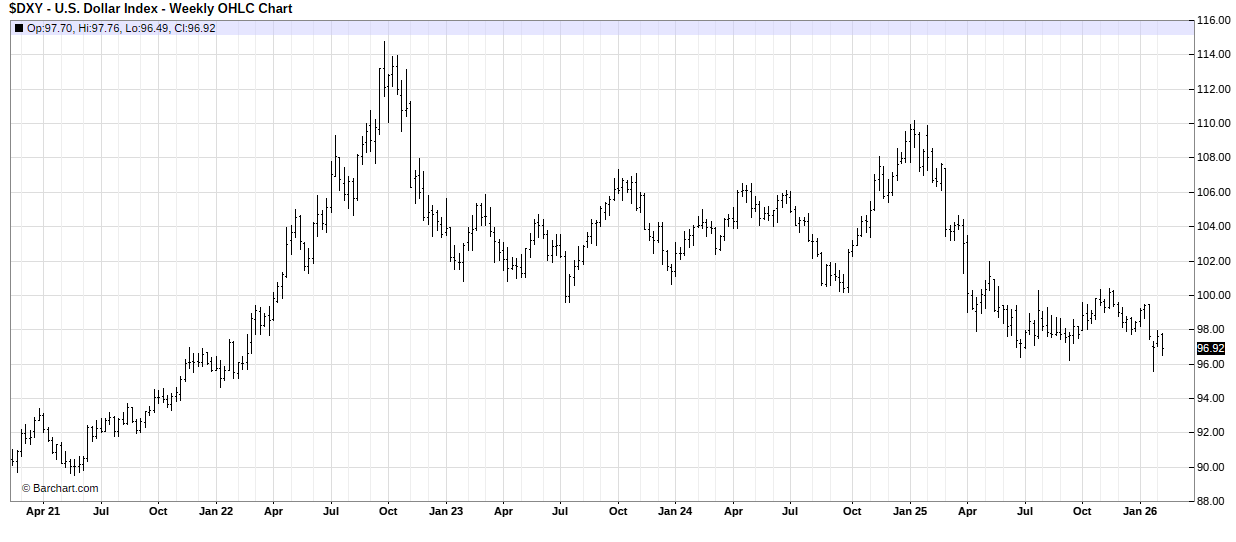
I get it, we are still not back to the 2021 lows, but look at the 1-year chart.

As I have always said, I am not smarter than you, and I am not a Wall Street analyst. I am just a guy who grew up in a small town and found my way to the trading floors of the Chicago Board of Trade and the Chicago Mercantile Exchange, and I ended up building the largest S&P 500 futures and options desk on the floor. If anything, I am a street guy who learned the ropes of how things work in the trading and investing world. Do I know how this is going to end up? No, I don’t, but as I always say... “these are not our father markets or chart and nor will they ever be again.”
They Cram A Lot Into 4-Day Weeks - On Tap
Tuesday: Home Depot reports earnings before the bell, 8:30 Empire State manufacturing survey, 10:00 Home builder confidence index, and Palo Alto Networks (PANW) and Cadence Design Systems (CDNS) report after the bell.
Wednesday: Alibaba Group Holding Ltd (BABA), Analog Devices (ADI), Moody’s (MCO), and Garmin (GRMN) report earnings before the bell, 8:30 am Housing starts (delayed report) for November and December, Building permits for November and December, Durable-goods orders (delayed report), and Durable-goods minus transportation, followed by Industrial production and Capacity utilization at 9:15 am, and concluding with the Minutes of the Fed’s January FOMC meeting at 2:00 pm. Booking Holdings Inc (BKNG) and DoorDash (DASH) report after the close.
Thursday: Walmart (WMT) is scheduled to report earnings before the open, 8:30 Initial jobless claims, U.S. trade deficit, Philadelphia Fed manufacturing survey, Advanced U.S. trade balance in goods, Advanced retail inventories, and Advanced wholesale inventories, followed by Minneapolis Fed President Neel Kashkari speaking at 9:00 am and the Leading economic index at 10:00 am.
Friday: 8:30 am February options expiration, GDP, Personal income, Personal spending, PCE index, PCE (year-over-year), Core PCE index, and Core PCE (year-over-year), followed by the S&P flash U.S. services PMI and S&P flash U.S. manufacturing PMI at 9:45 am, and concluding at 10:00 am with New home sales (delayed report) for November and December and the University of Michigan’s Consumer sentiment index.
According to the latest FactSet Earnings Insight (as of February 13, 2026), 74% of S&P 500 companies have reported actual results for Q4 2025 (note: this refers to the fourth quarter of calendar year 2025, often labeled as 4Q or Q4 in earnings contexts). This places the earnings season in its late stages, with 74% of those reporting companies beating EPS estimates (slightly below the 5-year average of 78% and the 10-year average of 76%), and aggregate EPS surprises at +7.2% above estimates.
S&P 500 Earnings Season Update: February 13, 2026
FactSet’s broader Insight blog hub for earnings-related content (including archives of these weekly reports) is at: Factset Insight
Our View
In addition to all the economic data, earnings, and the January options expiration, the justices of the Supreme Court put Trump's tariff decision on a fast track at the administration’s urging. The Supreme Court has announced February 20, 24 and 25 as “decision days” or opinion announcement days. These are sessions where the justices may release opinions in argued cases, typically starting at 10 a.m. ET.
During arguments, justices, including Barrett and Sotomayor, expressed skepticism about the government's position, with comments and questions on whether “regulate importation” has ever been used for tariff authority elsewhere in the U.S. Code, and noting tariffs as a form of tax not previously applied this way in foreign affairs. If the Court strikes down or limits the tariffs, it could pave the way for more Federal Reserve rate cuts, benefit U.S. companies by reducing costs and uncertainty, and signal limits on executive power in trade policy.
I have an old saying that I have used in the past, and this isn't just about Trump's Supreme Court tariff decision. There were over 350 mentions of Trump in the Epstein files... I believe there is reason to be concerned.
Our Lean — Danny’s Trade (Premium only)

Guest Posts:
Tom Incorvia - Blue Tree Strategies

From a broader index perspective, last week’s ~150 bps decline in the S&P-500 did not materially alter the prevailing market structure. Price remains within its established value framework and, at this stage, the pullback appears rotational rather than distributive.
The tone is notably different in mega-cap growth leadership. The Roundhill Magnificent Seven ETF (MAGS) violated a well-defined support region that had developed since September 2025. That multi-month high-volume area represented a prolonged zone of liquidity and two-sided trade — effectively a market consensus of fair value. Acceptance below such a region is typically more consequential than a simple price dip because it signals a migration of value rather than short-term volatility.
Auction dynamics suggest that once price is accepted outside a major balance area, the market tends to seek the next area of prior agreement. In this case, the next meaningful high-volume node resides near 52–54, which becomes a logical downside reference if supply continues to dominate.
Over recent months the S&P-500 has quietly outperformed the mega-cap complex, but sustained weakness in the leadership cohort would likely broaden risk-off conditions. A rotation lower toward the 52–53 region in MAGS would increase the probability that selling pressure transmits to the broader equity market rather than remaining isolated to large-cap growth..
You can purchase Tom’s Course on Volume Profile here.
Market Recap
Monday’s Globex Session
The ES and NQ settled slightly higher as bond yields fell.
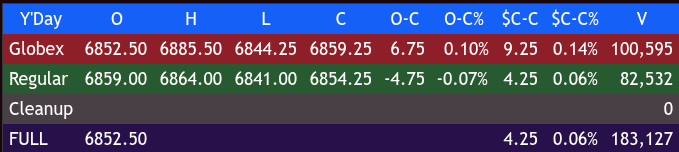
The ES traded down to 6819.50 on Globex at 6:30 am, traded up to 6843.75 at 7:55, sold off to a higher low at 6821.50 at 8:20, and traded up to 6867.00 after the CPI number rose 0.2% on all items for January. It then sold off down to 6845.00 at 9:10 and opened Friday’s regular session at 6851.00.
After the open, the ES sold off down to 6809.25 at 9:40, rallied up to 6863.25 at 9:48, sold off to 6830.50 at 9:55, traded up to 6881.00 going into 10:35, sold back off down to 6842.50 at 10:45, rallied up to a lower high at 6877.00 at 11:05, pulled back to 6852.75 at 11:20, rallied up to 6897.75 at 12:40, sold off down to 6875.50 at 1:05, traded back up to the high at 6875.75 at 1:20, and then started to drift lower, trading all the way back down to 6832.75 at 3:40.
The ES traded up to 6848.75 at 3:45 and traded 6847.00 as the 3:50 cash imbalance showed $1.3 billion to sell. It traded 6850.00 on the 4:00 cash close. After 4:00, the ES traded 6856.75, pulled back to 6845.50, and flatlined into the end of the session, settling at 6850.50, down 0.50 points or -0.01%.
The NQ settled at 24,803.25, up 35.25 points or +0.14%, the YM settled at 49,569, up 46 points or +0.09%, the RTY settled at 2653.10, up 32 points or -1.22%, the VIX settled at 20.60, down 0.22 points, and the DXY settled at 96.92%, down 0.01%.
In the end, the ES covered hundreds of points even before the 9:30 open. Part of this was the CPI number, and the other, larger part was the week two $4 trillion expiration that had high levels of open interest at the 6890 to 6900 level (high of the day 6897.75). In terms of the ES and NQ’s overall tone, they rallied nicely, but they also gave back much of the gains late in the day. In terms of the ES’s overall trade, volume was lower than on Thursday at 1.725 million contracts traded.
ES 5-day change: down 102.25 points or -1.47%
NQ 5-day change: down 360 points or -1.43%
YM 5-day change: down 636 points or -1.27%
RTY 5-day change: down 24.50 points or -0.93%
VIX 5-day change: up 2.48% or +15.99%
DXY 5-day change: down 0.72 points or -0.74%
MiM
Market-on-Close Recap – MiM
The February 13th MOC session began with heavy sell pressure and a clear risk-off tone. At 15:50, the market showed a –$519M imbalance, which quickly expanded to –$1.06B by 15:51 as sell programs accelerated. Sell flow peaked early with $3.2B for sale versus $2.1B to buy, driving the S&P lean to –59.9%. The Nasdaq was even more extreme at –76.2%, firmly in wholesale sell territory (greater than –66%), signaling aggressive institutional distribution rather than simple rotation.
The tone shifted around 15:54. Total imbalance flipped positive to +$598M and then surged to +$1.53B by 15:55 as buy orders ramped to nearly $4.0B. The $PCT reading moved above +60%, confirming a broad-based buy response. However, the late buy skew moderated into the close, finishing with a still-positive but reduced +$483M imbalance at 16:00.
Sector flows were mixed but showed defined pressure in growth and communication names. Communication Services led on the downside at –$400.9M with an –85.8% sell skew, clearly wholesale. Technology followed at –$345.6M with a –64.1% lean, just shy of full liquidation but still heavily offered. Healthcare (–$223.5M, –68.2%) and Basic Materials (–$121.6M, –74.3%) also reflected institutional selling.
On the buy side, Financials stood out at +$91.1M with a +58.9% lean, more rotational than aggressive. Consumer Cyclical posted +$81.1M (+59.1%), while Real Estate and Utilities both leaned modestly positive.
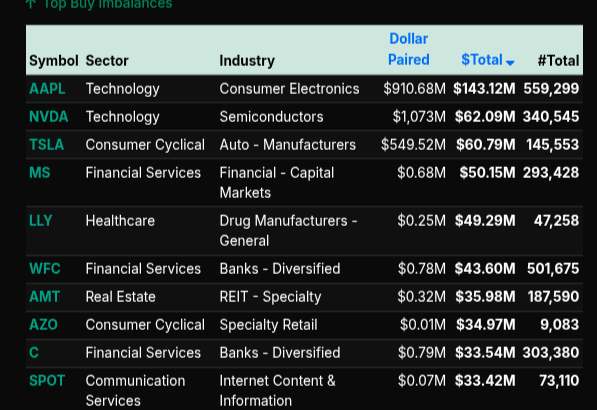
Single-name activity highlighted the split tape. Strong buy imbalances appeared in AAPL (+$143.1M), NVDA (+$62.1M), TSLA (+$60.8M), MS (+$50.1M), and LLY (+$49.3M). Conversely, heavy sell pressure hit GOOGL (–$185.9M), META (–$142.4M), QCOM (–$103.6M), and MU (–$79.7M), reinforcing weakness in Communication Services and Semiconductors.
Overall, the session evolved from early wholesale selling—particularly in Nasdaq components—into a late rotational buy program, but the close still reflected meaningful distribution in key growth sectors.


Technical Edge
Fair Values for February 17, 2026:
SP: 15.17
NQ: 64.39
Dow: 65.49
Daily Market Recap 📊
For Friday, February 13, 2026
• NYSE Breadth: 64% Upside Volume
• Nasdaq Breadth: 68% Upside Volume
• Total Breadth: 66% Upside Volume
• NYSE Advance/Decline: 73% Advance
• Nasdaq Advance/Decline: 65% Advance
• Total Advance/Decline: 68% Advance
• NYSE New Highs/New Lows: 192 / 49
• Nasdaq New Highs/New Lows: 140 / 196
• NYSE TRIN: 1.46
• Nasdaq TRIN: 0.85
Weekly Breadth Data 📈
For Week Ending Friday, February 13, 2026
• NYSE Breadth: 50% Upside Volume
• Nasdaq Breadth: 52% Upside Volume
• Total Breadth: 51% Upside Volume
• NYSE Advance/Decline: 55% Advance
• Nasdaq Advance/Decline: 42% Advance
• Total Advance/Decline: 46% Advance
• NYSE New Highs/New Lows: 653 / 174
• Nasdaq New Highs/New Lows: 675 / 590
• NYSE TRIN: 1.21
• Nasdaq TRIN: 0.63
ES & NQ Levels (Premium only)
Calendars
Economic Calendar
Today

Important Upcoming

Earnings

Recent

Trading Room Summaries
Polaris Trading Group Summary - Friday, February 13, 2026
Cycle Day 2 | CPI Reaction | “FRYday” Capital Preservation
The session opened with a clear reminder from Manny: new day, fresh start — consistent process, clean setups, disciplined execution. David reinforced structure immediately with the Daily Trade Strategy (DTS) and clearly defined Cycle Day 2 scenarios.
Pre-Market Plan: Clear Levels, Clear Intent
Key Pivot: 6845 ±5
🟢 Bull Case (Acceptance above 6845)
Targets: 6865 → 6885 → 6895
🔴 Bear Case (Acceptance below 6845)
Targets: 6822 → 6807 → 6801
Before most traders had finished their coffee, the initial bear target 6822 was fulfilled — confirming responsiveness to downside structure early.
CPI Catalyst: Controlled Reaction
CPI printed slightly softer than expected (headline 0.2% vs 0.3% est.), creating two-way volatility. Rather than guessing, David stayed anchored to structure:
Lower targets completed
Reclaim of CD1 Low (6842)
Shift in control back to buyers
This transition was a textbook example of structure > emotion.
Execution Highlights
Open Range Strategies (CL, ES, NQ)
All hit first targets
Remaining position scratched
Result: Paid and protected
This is professional trade management — take the base hit, eliminate risk.
Mid-Morning Rotation: Bulls vs Sellers
At one point, bulls failed to maintain bid above 6845 (LIS), temporarily shifting dominance to sellers. Open Range shorts played out.
But here’s the key lesson:
When 6845 was reclaimed and accepted — control flipped.
Bull Case Unfolds Perfectly
Once acceptance held above 6845:
6865 fulfilled
6885 fulfilled
6895 fulfilled
All upside objectives from the morning DTS briefing were achieved.
That’s not prediction — that’s preparation meeting execution.
David’s comment after 6895 hit:
“You are now free to move about the cabin…”
Mission accomplished.
Education & Process Reinforcement
Several strong learning moments today:
🔹 BDL (Buy Day Low) Discussion
Great question from Chris on BDL violations frequency.
This reflects traders thinking statistically — not emotionally. Long-term data matters more than recent memory bias.
🔹 Automation & Execution Tools
Slimmm asked thoughtful questions about:
Auto vs manual execution
Platform mechanics
Trade notifications
Monitoring without obsessing over P&L
David emphasized structure and process — not watching P&L tick-by-tick.
Bruce shared a powerful honesty moment:
“One of my biggest challenges is to not monitor the P&L.”
That’s real trader growth — awareness precedes discipline.
FRYday Principle: Capital Preservation
David reinforced:
Fridays = Capital Preservation.
Hit objectives. Reduce exposure. Avoid late-week overtrading.
End-of-day notes:
$1.266B MOC sell imbalance
Risk-off tone into close
Room stayed disciplined through the close.
Major Takeaways
Pre-defined levels remove emotional decision-making.
Reclaim & acceptance matter more than knee-jerk reactions.
First targets pay — runners are a bonus.
Structure shifts — good traders shift with it.
Fridays are about protecting the week.
Discovery Trading Group Room Preview – Tuesday, February 17, 2026
AI Disruption Driving Price Action
AI remains the dominant macro/theme narrative this week.
Salesforce (CRM) and ServiceNow (NOW) sold off on concerns AI could disrupt traditional software models.
Broader tech weakness:
Nvidia (NVDA)
Alphabet (GOOGL)
Amazon (AMZN)
Logistics stocks hit after an AI-powered freight announcement claiming 300–400% volume scaling without added headcount:
CH Robinson (CHRW)
Universal Logistics (ULH)
Reinforcement learning emerging as a fast-growing AI service niche (~$17M industry per Pitchbook).
Firms like Mercor are hiring experts across medicine, law, finance, sports, and more to train AI models.
Debate building around AI-driven job displacement.
Macro Backdrop
Labor Market
January payrolls: +130K (beat expectations)
2025 revisions: -400K jobs
2025 average job growth now ~15K/month
Inflation
CPI slowed to lowest rate since Dec 2021
Sticky categories (core goods & non-shelter services) surprised to the upside
Fed Expectations
50% probability of a rate cut by June (per FedWatch)
Powell’s term ends in May
Earnings Watch
This Week
Walmart (WMT)
DoorDash (DASH)
Molson Coors (TAP)
Energy:
Constellation Energy (CEG)
Energy Transfer (ET)
Southern Company (SO)
Today – Premarket
ALLE, BLDR, CNH, CEG, DTE, ET, GMAB, GPC, DVUE, LH, LDOS, MDT, OMC, SUN, VMC, WSO
After the Bell
CDNS, DVN, EQT, EXE, FE, IAG, MKSI, PANW, RBA, RSG, TOL
Wednesday Premarket
ADI, CLH, EBAY, GRMN, GPN, DINO, JLL, PHG, MCO, OMC
Economic Calendar (Today)
8:30am ET – Empire State Manufacturing Index
10:00am ET – NAHB Housing Market Index
12:45pm ET – Fed Governor Michael Barr
2:30pm ET – SF Fed President Mary Daly
Volatility & Positioning
ES 5-day average range: 89.75 (down from 114.75)
Volatility cooled Friday but remains moderately elevated
Whale bias: leaning bullish into U.S. session open
Overnight large trader volume: light
ES Technical Structure
Short-term: Downtrend channel
Intermediate-term: Uptrend channel
Broader backdrop: 3+ month sideways consolidation
Bulls have technical room to the upside
Key Levels
Support
6786/89 – Intermediate channel bottom (first key test)
6703/98 – Short-term channel bottom (stronger support below)
Resistance
6934.50 – 50-day MA (loose resistance)
6996/91
7140/45

