- The Opening Print
- Posts
- Crude Oil Rises After Israel Strikes Iran's Major Energy Sites and the Feds Walk Away
Crude Oil Rises After Israel Strikes Iran's Major Energy Sites and the Feds Walk Away
Follow @MrTopStep on Twitter and please share if you find our work valuable!
Our View
Even before the Middle East conflict, I never believed the Fed would lower rates three or four times this year. That view was reinforced yesterday after the U.S. Bureau of Labor Statistics released the Producer Price Index (PPI) report for February. The numbers came in significantly "hotter" than economists expected, and Fed Chair Jerome Powell immediately highlighted the risk of higher energy prices driving up inflation.
The timing was stark: with oil hitting its highs and index markets tumbling, he told reporters that policymakers are now in a "difficult situation."
Let’s face it, the Middle East war is not going to stop anytime soon. The prospect of a prolonged conflict has led investors to scale back stock positions and drastically revise interest-rate expectations, with CME FedWatch data showing a 48% chance that the Federal Reserve will not cut rates at all in 2026—a sharp increase from just 4% before the conflict began.
Highlighting the compounding economic pressures, Powell noted that the economy has faced a "tariff shock" and a "pandemic," and is now grappling with an "energy shock of some size and duration" that threatens to destabilize inflation expectations. Furthermore, Powell expressed frustration that services inflation, excluding housing, remains stubbornly high, stating clearly that the central bank is "not seeing progress there."
It was, as I said on my Twitter live stream, a day of non-stop headlines that went right into the end of the day.
Our View
If you recall, last week I said I looked at the ES chart, and if it started breaking under 6500, it looked like an air pocket down to 6300. I asked Grock, and it points out the 6350 level as a key support area.
The yield on the 10-year note climbed to 4.256% yesterday; the last time it was this high was January 29, and before that, September 2, 2025. Then you throw in credit markets that are under increasing pressure as credit spreads balloon, with investment-grade spreads climbing to 120 basis points and high-yield "junk" bond spreads surging toward 470 basis points.
This environment has created a "maturity wall," where analysts warn of a "coupon shock" as companies attempting to roll over old debt face interest costs that have nearly doubled compared to their previous low-rate agreements. I admit I do not know how all this works, but what I can say is that it’s looking like a snowball rolling down a hill.
Our Lean
As I have said in the past, no one promised us a rose garden, but they also never told us what a shit spin this would fall into. I'm sorry I can't mix my words any other way than to say the markets continue to look like they are in trouble.
The year-to-date net changes show the Russell, Dow, and Nasdaq are closing in on the 10% correction levels. Again, I do not want to get ahead of myself, and after a big sell-off, the ES tends to rally on Globex, but that was one shitty close yesterday.
Our lean: Can it rally after the open? Sure, but again, all the rallies have been dead cat bounces. It doesn't matter if it’s a 50-point, 100-point, or 200-point rally; it's going to end up going back down. How you get from point A to B is up to you.
Lastly, the PitBull said he wanted to buy puts a month ago, but he keeps trying to buy stocks, and you know what I keep saying to him? It's one of my favorite sayings... less is better.
Below are my Clause Ai levels. Today I am going to do a live stream on Twitter and YouTube about the exact steps I use and the code I use to make them. If you don’t get to see the live stream, I will post the link for you to view.
ESM26 Market Profile Levels
Market Sentiment: The market is currently trading at 6,669.25, positioned below the Point of Control (POC) and within the lower bounds of the session range.
🔴 Overhead Resistance (The "Sellers" Zone)

🟡 Mid-Range & Momentum Reference
6,707.58 – 14 Day %k Stochastic Stall (Momentum Resistance)
6,698.80 – 14-3 Day Raw Stochastic @ 20%
6,682.00 – Single Print Boundary (Unfilled gap; acts as a magnet)
6,677.00 – Previous Close
6,669.25 – LATEST MARKET PRICE
🟢 Downside Support (The "Buyers" Zone)

Key Takeaways for the Session
The POC Magnet: Price is currently hovering below the Point of Control (6,712.00). Watch for a rotation back to this level if we hold the Initial Balance Low (6,648.50).
The Value Gap: Trading below the VAH (6,762.50) suggests the bears are currently in control of the short-term auction.
Volatility Warning: A break below the 1-Month Low (6,631.50) could trigger a fast move toward the S1 Support (6,616.33).

Guest Posts:
Dan @ GTC Traders
Actually, Not What’s Taking Place Today … But What’s Already Taken Place ...”
Everyone has a favored financial movie. Some love “Wolf of Wall Street” (though why, I’ll never be able to ascertain). Some …. “The Big Short” (great great film, but too many oversimplifications for me). I make no secret, that mine is “Margin Call”. Besides all of the A-list actors that shine brilliantly, there are many fine details that make the movie … almost … perfect.
Let’s refer to one such scene. Everyone knows it.
The CEO Mr. Tulde has been brought in, as has the entire board at “an ungodly hour” in the early morning, and a risk analyst (Mr. Sullivan played by Zachary Quinto) is left to explain how the copula-driven models they relied on to quantify risk had effectively collapsed. What had been reduced to a single, clean “risk number” was built on correlation assumptions that worked in normal conditions … but broke the moment stress entered the system; and theta had complicated what was already a stressed system. Entire portions of the risk, particularly in the tails, were never properly accounted for.

There are four lines that are delivered. They didn’t have to be there. But it was a stroke of genius, that they were in the final cut of the movie.
Mr. Tulde (played by Jeremy Irons who was beyond genius in the role), asks:
“What I’m guessing it says is that considering the, shall we say, bumpy road we’ve been on the last week or so, that the figures your brilliant co-workers up the line ahead of you have come up with don’t make much sense anymore considering what’s taking place today.”
Sullivan: “Actually, not what’s taking place today, but what’s already taken place over the last two weeks”
Tulde: “So you are saying this has already happened?”
Sullivan: “Sort of”
This was brilliant, as it explains that one of their many assumptions was that risk could be reduced to a static, correlation-based framework. Their Gaussian copula did not account for deterioration through time. As the underlying collateral weakened and correlations moved toward one, the system was not simply wrong … it was compounding its own error. Time was not neutral in the model. It was corrosive.
Just three lines of script. And yet they express a fundamental aspect of many problems that occur throughout finance.
The passage of time compounds many problems in non-linear ways. As I repeated to students throughout 2008: “All dislocations and tail events and in risk are non-linear in nature, by definition. It will bite you in a way you cannot and did not expect as the problem progresses through time.”.
Ok.
Great.
Why are we talking about this?
The Strait of Hormuz, effectively remains closed …
Now, we will refer you to what we said in this space last week:
“Higher inflation is not coming. It’s already here, and people just don’t realize it yet. We’re just waiting for the April print of the number is all.
The problem for equities is not simply valuations, although those remain historically stretched. Risk assets more broadly feel increasingly unstable as geopolitical tensions and commodity inputs reassert themselves. Yet the market has not fully broken down either. The result is a macro environment where conviction shorts across the board remain difficult. We feel this is due to the fact that the market really hasn’t woken up to the coming surge in inflation either. So that rules out Treasuries as well. When everyone is ‘hip’ to the fact that inflation will surge? Watch Treasuries scream to higher yields.”
Now anyone that knows me? Knows that I hate predictions. And I want to be clear.
Although yields are higher, and equities sank, while we profited off of the Oil Trade as noted in the stream? Although what I said last week looks like a prediction in hindsight? It was not.
All I did was try to desperately understand, log and note if there was any change in evolving initial conditions. Although it looks like a prediction in hindsight?
Because the Strait of Hormuz remains closed. And there is a deterioration in shipping that will not take place. I quote Mr. Sullivan:
“Actually, Not What’s Taking Place Today … But What’s Already Taken Place …”
It’s already happened, and continuing to happen. As was so well illustrated in that scene in “Margin Call”. Now, what none of us can know is the downside volatility and the strength of that volatility that we may all experience. Or not experience. It’s the future, and those sorts of variables are complete unknowns.
But, while we all find ourselves within this particular regime?
We are firmly in the stance of the line spoken by the character Jared Cohen, played by Simon Baker ...

“Sell it all … today …”
And please be aware, we are using that line as a metaphor, and a bit of a hyperbole.
No, we are not going to sell everything we own in some sort of idiotic ‘firesale’ fashion. As we said, what none of us can know is the downside volatility and the strength of that volatility that we may all experience. Or not experience. It’s the future, and those sorts of variables are complete unknowns.
But we are hedged up on all of our core holdings, and even looking for an opportunity to increase those hedges. We are net short in our Long-Short Valuation Account. And our shorter term programs are beginning to flat signals to get short in key areas along a multiple of risk instruments. And as we have already stated? I wouldn’t look to Treasuries to be much of a ‘hedge’ in this environment.
We are cautious, and we are looking for opportunities where we can sell all rips.
Until next time, stay safe and trade well.
Dan

Goldman Sachs: Record $7.1 Trillion Options Expiration
Goldman Sachs estimates that tomorrow will mark the largest “quadruple witching” event on record. With over $7.1 trillion in notional options exposure set to expire, the scale represents approximately 10.2% of the Russell 3000’s total market capitalization—a 20% increase over the previous year.
Breakdown of Notional Value
The expiration is driven by a massive surge in options trading, particularly high-volume, short-dated (0DTE) contracts.

Market Recap:

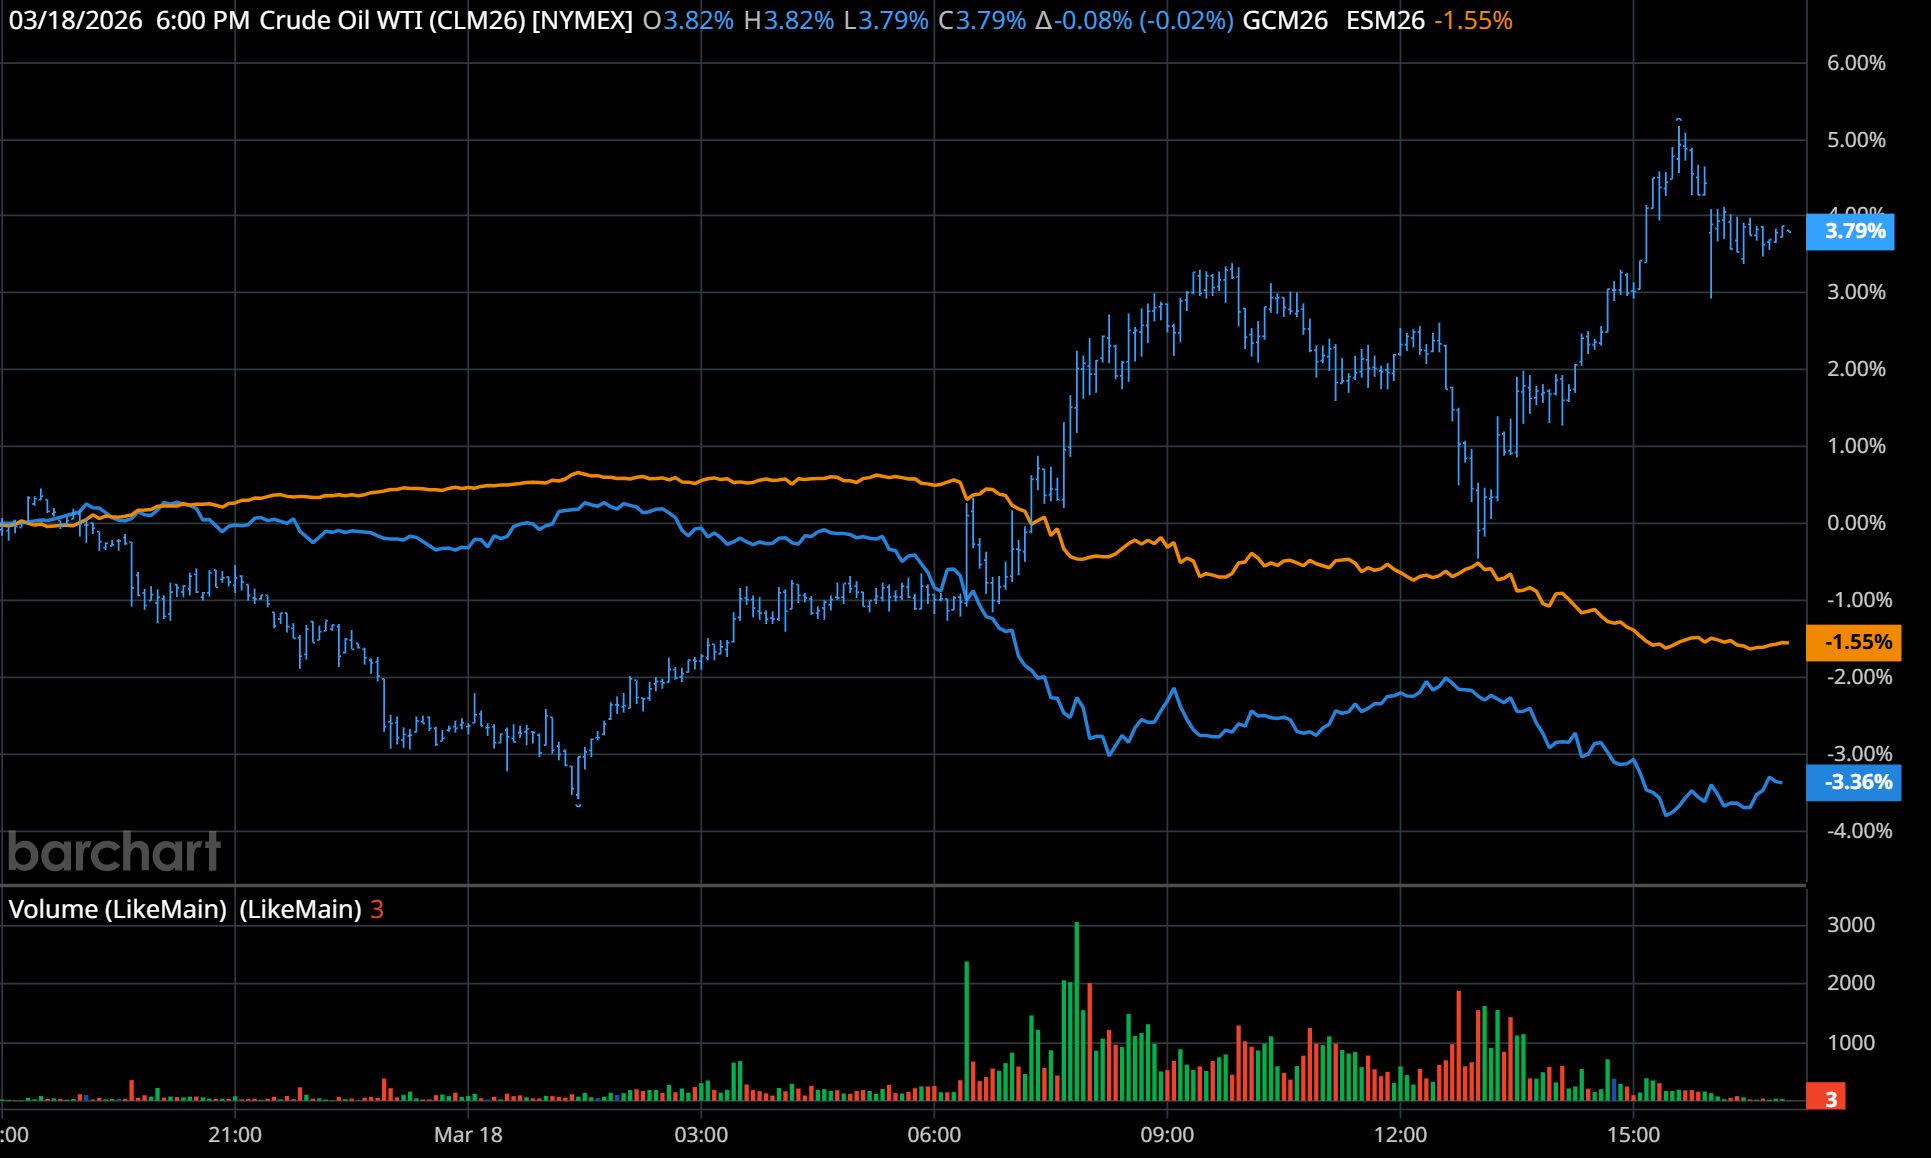
The chart above is a daily comparison of the 15-minute $ES, $GC, $CL charts. As you can see, as crude oil made new highs, gold and the ES fell.
The ESM (June) made a high at 6814.00 and traded down to 6732.00 on Globex and opened Wednesday's regular session at 6746.50, down 25.25 points or -0.37%.
After the open, the ES traded 6741.75, rallied up to 6759.75, sold off down to 6719.25 at 10:25 (I posted 6720 support), traded up to 6732.25, sold off to a new low by 1 tick at 6719.00 at 10:45, rallied up to 6743.00 at 11:10, sold off down to a higher low at 6726.25, and fell into an 8 to 10 point chop until 12:20.
It then traded back down to the 6720.00 level, rallied up to 6734.75 at 12:55, traded down to a new low at 6713.00 at 1:30, rallied back up to 6737.50 at 2:00, and then sold off 43.25 points down to 6694.25 at 3:00. The ES traded up to 6709.50, sold off down to a new low at 6689.00 at 3:20, made 4 lower lows down to 6678.25 at 3:45, and traded 6680.75 as the 3:50 imbalance showed $1 billion to buy. It then sold off down to 6673.75 at 3:55 and traded 6677.25 on the 4:00 cash close.
After 4:00, the ES made 4 lower lows all the way down to 6654.50 at 4:25, rallied up to 6669.00, and settled at 6664.00, down 109.25 points or -1.61%. The NQ settled at 24651.25, down 346.25 points or -1.42% and down 6.10% YTD; the YM settled at 46535, down 813 points or -1.72% and down 8.64% YTD; the RTY settled at 2495.50, down 41.30 points or -1.63% and down 9.85% YTD.
In the end, there were several rotations: buy CLM (crude oil), sell ES, NQ, YM, and RTY; and the other one was buy CL / sell GC (gold). In terms of the ES's and NQ's overall tone, they were weak but gave way to the downside late in the day as crude oil rallied up to 96.20 after 5:00.
In terms of the ES's overall trade, volume was low; only 446k ESH traded and 1.635 million ESM, meaning only 1.189 million ESM traded on the day session.
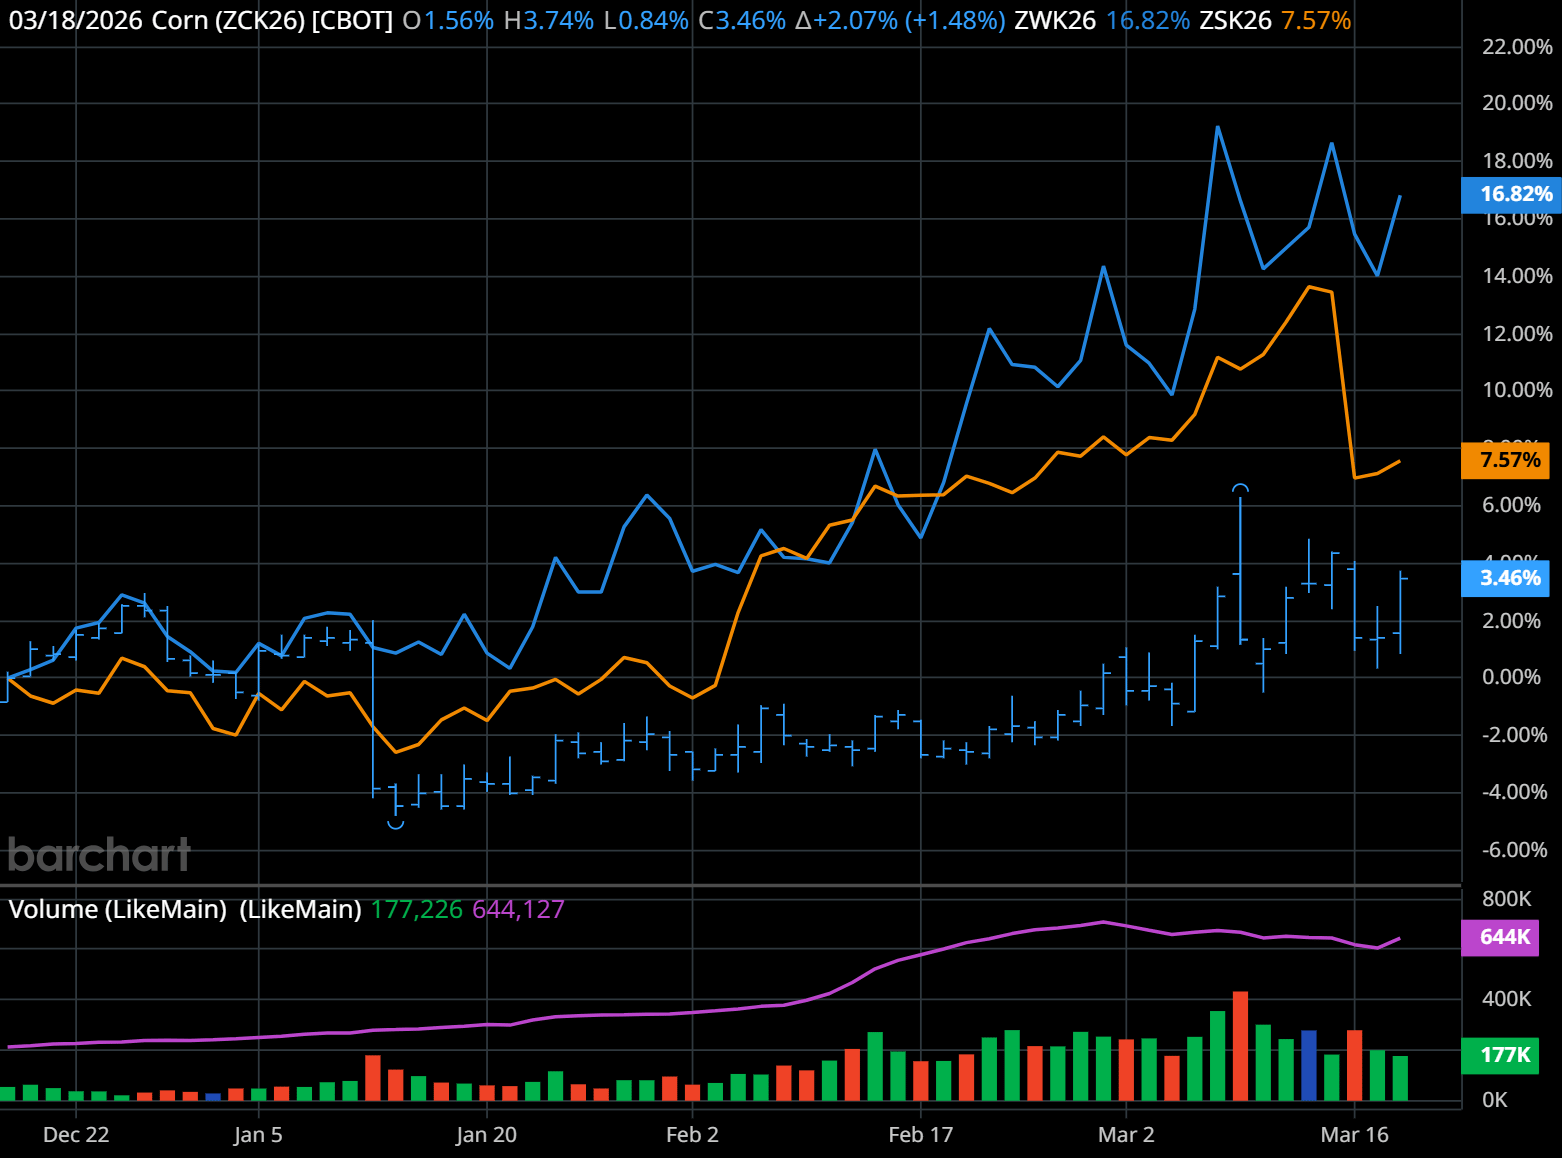
Have you ever given any consideration to the historically low price of beans, wheat, and corn? May beans (ZSK26) closed up 0.41%, May wheat (ZWK26) closed up 2.46%, and corn (CZK) closed up +2.04%. As you can see by the chart, corn has gone up but is underperforming against the beans and wheat. I have a feeling that as long as crude keeps going up, so will the grains.
MiM
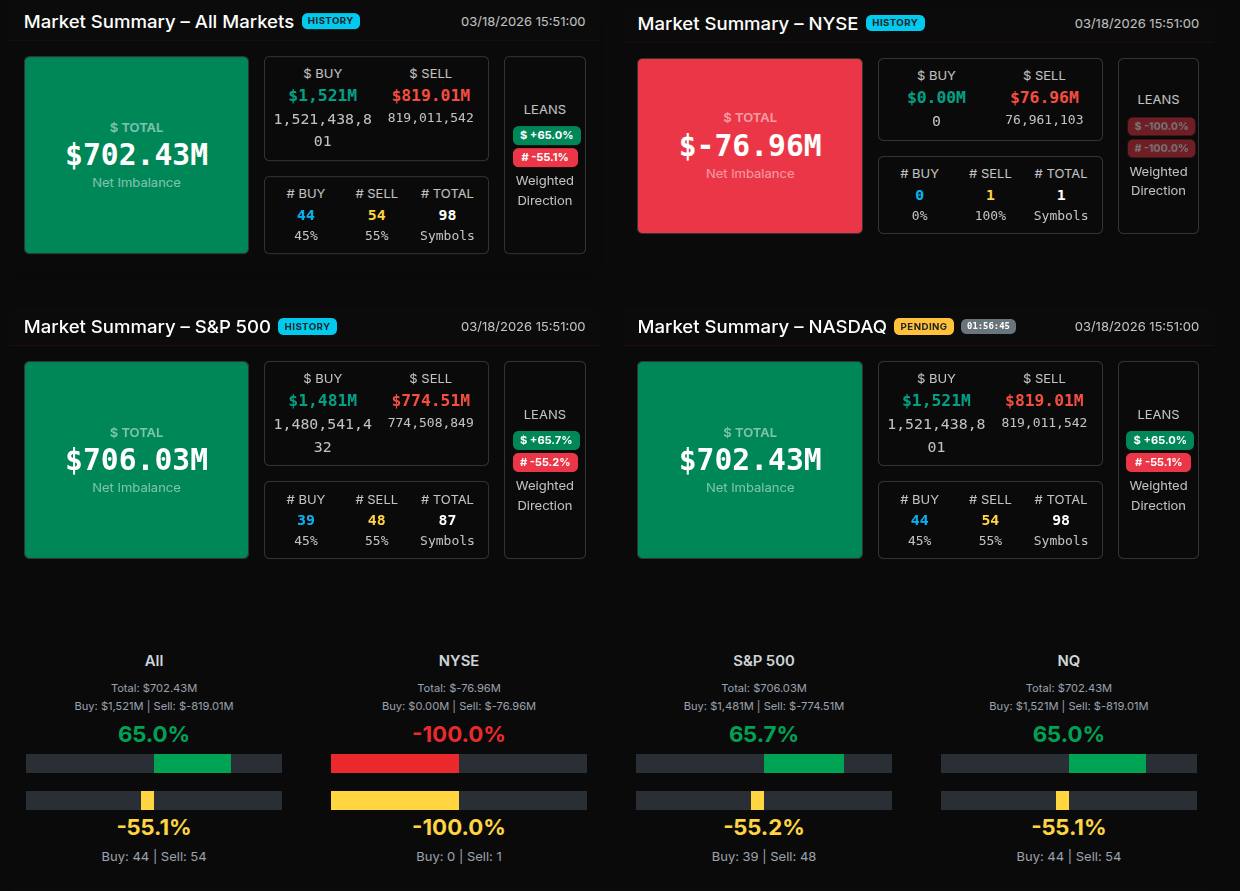
The MOC session developed with a clear institutional buy imbalance that persisted through most of the window, though not without a meaningful mid-auction shift. Early snapshots showed strong demand, with total imbalance building steadily and peaking north of $1.2B before a sharp reversal around 15:56, where the tape briefly flipped to a sizable sell imbalance (-$733M). This transition marked the key inflection point, suggesting either large offsetting programs or late liquidity entering the market. However, the sell pressure was not sustained, and the auction rebalanced back toward a buy-side close, finishing with roughly +$702M and a +65% lean—firmly in buy territory.
From a sector perspective, participation was highly asymmetric. Technology (+81.3%) and Healthcare (+72.5%) showed strong institutional demand, both well above the +66% threshold, indicating broad accumulation rather than rotation. Utilities also printed a notable +86.6%, though on lighter volume, reinforcing a consistent buy-side bias. On the opposite end, Energy (-95.6%) and Industrials (-94.2%) reflected aggressive liquidation, both clearly in wholesale sell territory. Financials, Real Estate, and Basic Materials all registered -100% readings, though with minimal breadth, indicating isolated but complete sell programs.
The tape overall leaned more rotational beneath the surface, with several sectors clustering around the ±50–60% range. Communication Services (-50.3%) and Consumer Cyclical (-55.4%) reflected this balance, despite notable individual names trading actively.
Single stock flows were dominated by large-cap tech and consumer names. MSFT (+$268M), AMZN (+$127M), NVDA-related semis like MU and NXPI (both >$100M), and AAPL (+$81.9M) led the buy side, reinforcing the strength in Technology. Healthcare participation was led by GILD (+$94.9M). On the sell side, TSLA (+$170M paired but within a weaker sector context), PLTR, and Communication names like CMCSA and NFLX showed more mixed or offsetting flows.
Overall, this was a buy-driven close with clear institutional accumulation in growth and defensives, offset by targeted liquidation in cyclicals and energy, producing a net bullish imbalance into the close.


Technical Edge
Fair Values for March 19, 2026
S&P: 51.89
NQ: 221.75
Dow: 300.53
Daily Breadth Data 📊
For Wednesday, March 18, 2026
NYSE Breadth: 21% Upside Volume
Nasdaq Breadth: 29% Upside Volume
Total Breadth: 26% Upside Volume
NYSE Advance/Decline: 20% Advance
Nasdaq Advance/Decline: 22% Advance
Total Advance/Decline: 22% Advance
NYSE New Highs/New Lows: 64 / 118
Nasdaq New Highs/New Lows: 64 / 265
NYSE TRIN: 0.96
Nasdaq TRIN: 0.70
Weekly Breadth Data 📈
For the Week Ending Friday, March 13, 2026
NYSE Breadth: 42% Upside Volume
Nasdaq Breadth: 54% Upside Volume
Total Breadth: 49% Upside Volume
NYSE Advance/Decline: 22% Advance
Nasdaq Advance/Decline: 32% Advance
Total Advance/Decline: 28% Advance
NYSE New Highs/New Lows: 151 / 226
Nasdaq New Highs/New Lows: 226 / 575
NYSE TRIN: 0.39
Nasdaq TRIN: 0.41
S&P 500/NQ 100 BTS Trading Levels (Premium Only)
BTS are daily generated levels created using a combination of proprietary calculations and AI to define an upper range target and a lower range target, split by a bull/bear line. You receive daily charts along with clear descriptions of each level to help guide your trading.
Take a Free Premium Trial to see them in action.
Economic Calendar Today

This Week’s High Importance

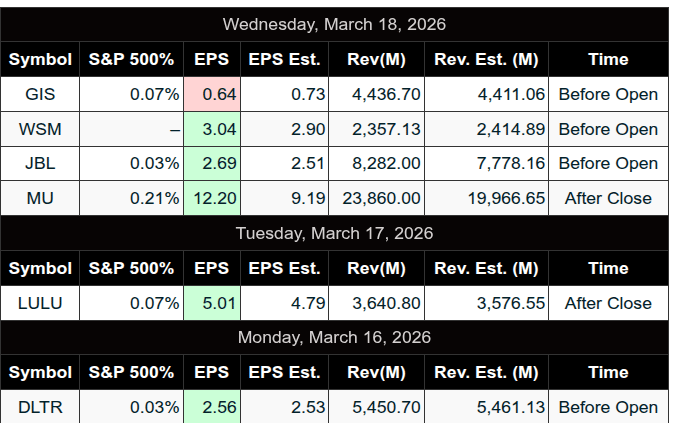
Earnings:

Recent
Trading Room News:
PTG Room Summary – March 18, 2026
PTG Room Summary — Wednesday, March 18, 2026
The day began with a clear Cycle Day 1 framework centered around the 6775 pivot, with defined bull and bear scenarios. Very quickly, it became apparent this would be a high-volatility, two-way session, as both upside and downside targets were hit early. With Fed day, geopolitical headlines, and strong momentum, the tone shifted to fast-moving conditions where discipline and alignment were critical.
Early Session — Two-Way Expansion
Both 6805 upside and 6740 downside targets were fulfilled early
Price tagged the 6810 3-day cycle target before sharply reversing
Immediate recognition: not a trend day — rotational and volatile
Strong reminder to stay flexible and avoid directional bias
Key Levels & Structure
6775 pivot controlled the session early (decision point)
6732.75 Cycle Day 1 projected low identified and respected
Bulls needed to reclaim 6732 to regain control
6715.75 prior low was called ahead of time and later tested
6694.88 violation level tagged and produced a reversal
Excellent example of PTG levels consistently guiding trade decisions
Trade Activity — Execution & Management
CL Open Range Long
Target 1 hit
Stop moved to breakeven showing strong trade management
ES and NQ Open Range Longs
Both stopped out
Reminder that even solid setups can fail in volatile conditions
A10 Short (room member)
Paid well
Aligned with downside momentum
Best takeaway: Manage risk first, profits second
Market Drivers & Environment
Fed Day (rates unchanged) added volatility
Powell commentary created additional swings
Geopolitical tensions and weak PPI influenced sentiment
Crude noted as a major driver of movement
Reinforced need for discipline, awareness, and proper risk control
Afternoon & Range Completion
Prior low test (6715 area) occurred mid-afternoon
Both major range targets completed:
6811 upside
6691 downside
Total range expanded to 125 to 135 plus handles
Closed near lows indicating continued pressure
Closing Takeaways
Textbook Cycle Day 1 behavior with full range expansion
Preparation paid off as levels and scenarios were highly accurate
Strong performance came from:
Staying aligned with the dominant force
Taking AAA setups only
Managing trades actively with discipline
Key lesson: You do not need every move, just the clean ones
DTG Room Preview – Thursday, March 19, 2026
Macro backdrop: Markets under pressure from Middle East conflict and persistent inflation
Equities: S&P 500 and Dow hit new 2026 lows; risk sentiment remains weak
Inflation/Fed: Hot PPI + high gas prices reinforce “higher for longer”; Powell tone hawkish
Energy/geopolitics:
Strikes on key gas infrastructure in Qatar and Iran driving oil volatility
Rising risk around Strait of Hormuz; shipping disruptions ongoing
Regional attacks escalating (UAE, Saudi, Kuwait, Israel)
Volatility/flow:
Volatility elevated post-FOMC; ES 5-day ADR ~120 points
Whale bias leaning bearish into 8:30am ET data
Technical setup (ES):
Back inside short-term downtrend channel
Lost 200-day MA (6761) → flips long-term bias bearish
200-day now resistance
Key levels:
Resistance: 6845/40s, 6965/60s
Support: 6542/37s
Today’s catalysts:
8:30am ET: Jobless Claims, Philly Fed
10:00am ET: New Home Sales, Leading Index, Wholesale Inventories
Earnings:
Premarket: Accenture, Alibaba, Darden, PDD
After close: FedEx
Friday: Carnival, XPeng

