- The Opening Print
- Posts
- Counter-Trend Friday
Counter-Trend Friday
Follow @MrTopStep on Twitter and please share if you find our work valuable!
Our View
I feel like the ES and NQ — everything we see is a big setup.
I woke up just before the ES traded 6474.00 after 6:00 am yesterday. That’s basically up 100 points from Wednesday’s low. After opening at 6465.75 at 9:30 ET, the ES made an early low at 6456.00 at 10:15, traded all the way up to 6504.75 at 3:40, traded 6503 as the 3:50 cash imbalance showed $3 billion to buy, shot up to 6513.00 at 3:57, traded 6511.25 on the 4:00 cash close, traded up to a new high at 6516.75 at 4:15, and settled at 6511.25, up 52.75 points or 0.82 % on the day.
In the end, I always say if you want to know where the S&P is going, you follow — and the best way to do that is with the MrTopStep imbalance meter. Tuesday’s $6.9 billion buy, Wednesday’s $3.3 billion buy, and yesterday’s $3 billion buy have helped push the ES up 145 points in 24 hours.
In terms of the overall tone, it was buy program after buy program as the shorts continued to get squeezed out. In terms of the ES’s overall trade, volume was lower at 1.12 million contracts traded.
I am sure there are a lot of folks out there who say they knew the ES or NQ low was in — they saw it on their charts. OK, I’m not going to argue about that. But I will say that after six weeks of sideways price action, the futures index markets became oversold. And a gigantic amount of new money was poured into the markets— over $12 billion in stocks and ETFs were bought in the first three full trading sessions of September, all leading up to this morning’s jobs report.
I said on Tuesday that a lot gets packed into a four-day trading week — and today’s going to top things off.
Our Lean
I have to go back to the old-school MrTopStep Trading Rules 101 call: Counter-Trend Friday.
COUNTER-TREND FRIDAY: Over the years, this trade works best on monthly NFP jobs Fridays when the S&P futures gap sharply higher or lower on oversized pre-market Globex volumes of +400k (now 250k to 300k) ES contracts before the 8:30 am CT open. This is a fade — a “the bus is too full” type trade.
Example: The S&P is down 6 handles at 6:00 am and then down another 8 or more handles after the jobs number is released. Now the S&P is down 14 handles or more at the 8:30 am open. With 400k+ minis traded before the open, this tells us that traders have already voted (sold). Depending on the price action, the idea is to buy a sharply lower open or allow for another 2–4 handle drop just after the open.
The idea behind this is that with so many minis traded — and it being a Friday, knowing most traders can’t hold futures over the weekend — they put in buy stops, and the algorithms go right for the buy stops. With all the selling used up pre-open, the ES will start to short cover into the buy stops that lift the offer side of a buy program.
This is the original rule, but obviously that was when the ranges were smaller and the volume was larger. Ideally, this trading rule is looking for a big gap in either direction — but I think the best gap to trade would be a gap down, because it fits the trend and the early price action of weakness then rally.
I want to point out a few things:
There are a lot of buy stops above 6518 — the contract high is 6523.00.
I think it's important to remember how much the ES and NQ have rallied in front of today’s jobs report.
The Week 1 Friday options expiration, which is sure to have some rolling up and down.
Our lean: I think we go higher, but I also think there could be some drops. And lastly, it's not been hard to read the late ES price action going into the imbalance lately — especially if the ES is weak late in the day. It clearly has helped add clarity to why the S&P and Nasdaq have rallied so much, so fast.
No one knows what the S&P is going to do next, but what we do know is: it never does what everyone wants it to do when they want it.
Have a good weekend.1
Guest Posts:
HandelStats Market Insights
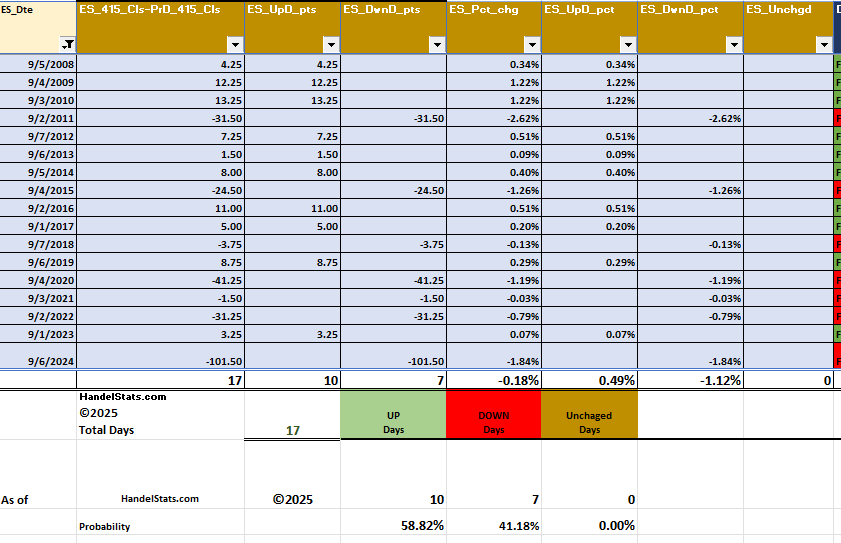
Special Focus: Employment Fridays
Employment Day is always one of the most closely watched sessions of the month. Traders anticipate volatility—but what do the numbers really show? We dug into the data going back to 2008, and here’s what we found:
Employment Fridays Since 2024
20 occurrences (Jan 2024 – Aug 2025)
Up days: 13 (65%)
Down days: 7 (35%)
Average change: -0.23%
Average up move: +0.72%
Average down move: -1.99%
Takeaway: Markets have been up two-thirds of the time on Employment Friday since 2024. But the downside is sharp—losses are nearly 3x larger than gains. Example: -345.50 points in April 2025.
What This Means for Traders
Employment Friday offers probabilistic edges, but risk is asymmetric.
Traders should be prepared for larger downside volatility even in generally bullish patterns.
Knowing the historical stats helps you adjust position sizing and stops ahead of these events.
At HandelStats, our mission is to give traders quantitative clarity on recurring events—whether it’s Employment Fridays, gap statistics, or daily/weekly standard deviation levels.
To learn more, visit HandelStats.com and explore how our sheets and analytics can help you trade smarter.
 |
Get instant access to our partners’ real-time market data and insights not available anywhere else. Here is last night's Founder’s note getting you ready for today’s market and explaining the constraints in yesterday’s market. - MrTopStep
Founder's Note:
Futures are +20bps higher ahead of NFP at 8:30AM ET.
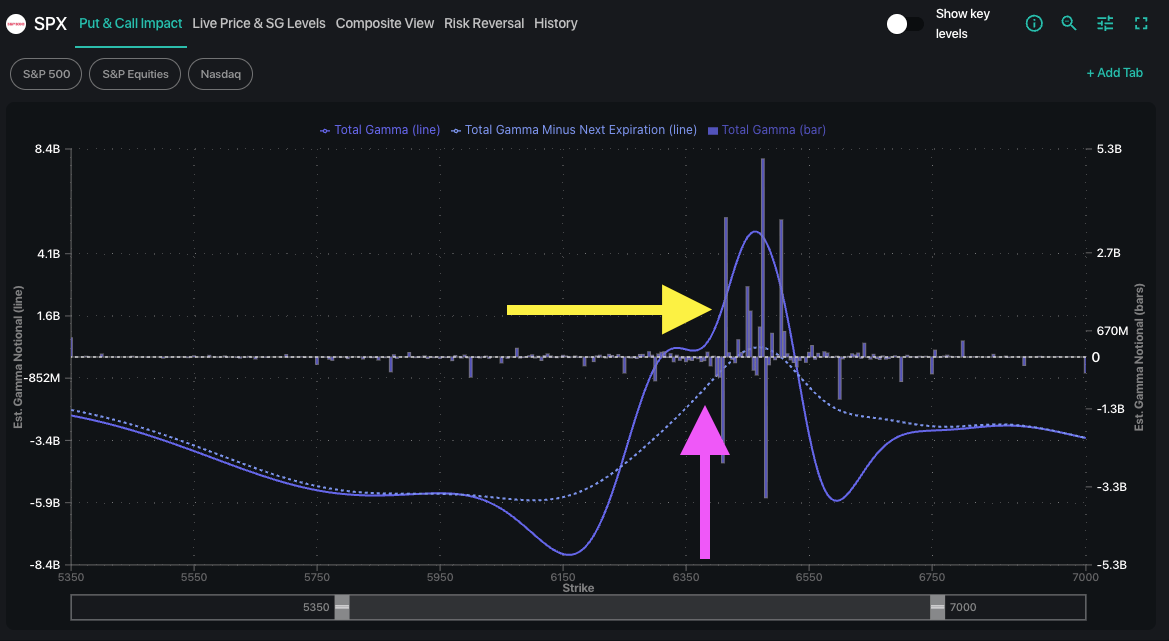
The levels for today are clear: 6,535 to the upside and 6,450 to the downside. These levels are courtesy of Captain Condor and his 50k 0DTE condor, which has been a part of the daily "seek and destroy" algo that has been dominating markets this week (and many days over the past month (see video here & PM note here).
First, lets cover the downside. <6,500 likely leads to a test of 6,450 ,which is now our long term risk-off level. If you pull Captain Condor from the equation, we'd have virtually no positive gamma below, but his 50k lot of spreads at 6,450 would likely be a bouncing point for today.

SPX in EquityHub shows the gamma projection with todays positions (purple line highlighted by yellow arrow), and you can see it hits zero at 6,400. The dashed line is the gamma line ex todays expiration, and you see that gamma is much more negative <6,450. If we test 6,450 today then we would look to hold SPX put spreads for 9/19 OPEX, with eyes on the 6,300 level.
Turning to the upside, the interesting question here is: "What is a bad NFP?" Good data (i.e. jobs and wages are up)? Or people don't have jobs, in which case we get a rate cut? In other words, what exactly is being hedged?
I would answer "nothing" because the 0DTE straddle is $36/55bps - that is really pretty paltry. That being said, the IV's for next week are nearing lower vol bounds, with ATM IV's between Monday and 9/19 just above 10%. 1-month SPX realized vol is ~9% - so the vol premium there is de minimus. The VIX is up at 15, and so the argument here is that if we skip past NFP unharmed then there is some vol premium to extract, which helps to boost stocks higher.
If NFP doesn't matter than the upside level to watch is 6,600 for SPX into 9/17 (VIX exp/FOMC). As Captain Condor is at 6,535 today, that leaves about 1% of gains between here and that 6,600 over the next two weeks. The issue is there is almost no OI above 6,600, and so we currently can't target much over that level. That being said, the above IV's are "zombie territory" which likely means its a big grind for SPX, but other single stocks/IWM/memes will outperform over the next ~10 days. Shorting the vol ETP's may also work over this next week, too, if the market is stable post-NFP.

Get instant access to our partners real-time market data and insights not available anywhere else. Here is last night Founder’s note getting you ready for today’s market and explaining the constraints in yesterday’s market. - MrTopStep

MiM and Daily Recap


The ES opened the overnight Globex session at 6460.00 and quickly tested lower, marking a low of 6454.50 at 19:40. From there, buyers stepped in, lifting the contract to 6472.25 by 22:00, a gain of 17.75 points. That rally was met with selling pressure, pulling prices back to 6458.50 by 23:30. A second recovery attempt carried ES to 6469.00 at 01:20 before another fade down to 6458.50 at 03:00. Momentum improved into the early morning, with the contract climbing to 6473.75 at 06:10, the Globex high. After a brief dip to 6462.75 at 07:50 and a further low at 6461.25 by 09:00, ES firmed into the regular open, settling the overnight trade at 6465.75, up 5.75 points or 0.09%.
The regular session began at 6465.75 and initially climbed to 6474.75 by 09:35. Sellers responded quickly, driving the market down to 6456.25 at 10:15, marking the cash-session low. A sharp rebound then followed, carrying ES to 6487.75 by 11:55, up over 31 points from the morning trough. After a modest pullback to 6479.50 at 12:40, buyers regained control, and a steady afternoon trend developed. By the close, ES hit 6511, completing a 55-point rally from the morning low. The contract closed the regular session at 6511.25, higher by 45.50 points or 0.70% from the open and up 52.75 points or 0.82% from the prior cash close.
The brief cleanup session extended gains modestly, trading as high as 6516.75 before settling at 6512.50. Total full-session volume reached 1.115M contracts, with 918,855 traded during the cash hours.
Market Tone & Notable Factors
The tone of Thursday’s trade was broadly bullish, with the ES shaking off early weakness and finding consistent demand throughout the day. The significant move came after the 10:15 low, where strong momentum pushed the market steadily higher into the afternoon and toward session highs.
The Market-on-Close data confirmed the bullish skew. At 3:51 PM, the imbalance showed $3.08B to buy against $1.03B to sell, leaving 80% of the flow on the buy side. The symbol imbalance finished at 62.3%, favoring buyers but falling short of the 66% threshold for a strong imbalance. Still, the large dollar value imbalance helped sustain late-session strength and supported the close near highs.
Overall sentiment was positive as buyers absorbed early downside probes and pressed the contract to finish near the top of the day’s range. The decisive recovery off the morning low suggests dip-buying demand remains intact, keeping the bullish bias in place heading into the next session.
BTS Trading Levels - (Premium Only)

Technical Edge
Fair Values for August 29, 2025
SP: 9.27
NQ: 39.99
Dow: 56.15
Daily Breadth Data 📊
For Thursday, September 4, 2025
NYSE Breadth: 65.7% Upside Volume
Nasdaq Breadth: 56.3% Upside Volume
Total Breadth: 57.5% Upside Volume
NYSE Advance/Decline: 73.8% Advance
Nasdaq Advance/Decline: 58.5% Advance
Total Advance/Decline: 64.3% Advance
NYSE New Highs/New Lows: 108 / 28
Nasdaq New Highs/New Lows: 176 / 149
NYSE TRIN: 1.55
Nasdaq TRIN: 1.07
Weekly Breadth Data 📈
Week Ending Friday, August 29, 2025
NYSE Breadth: 52.7% Upside Volume
Nasdaq Breadth: 56.4% Upside Volume
Total Breadth: 55.2% Upside Volume
NYSE Advance/Decline: 48.3% Advance
Nasdaq Advance/Decline: 44.2% Advance
Total Advance/Decline: 45.8% Advance
NYSE New Highs/New Lows: 281 / 25
Nasdaq New Highs/New Lows: 478 / 166
NYSE TRIN: 0.80
Nasdaq TRIN: 0.60
Calendars
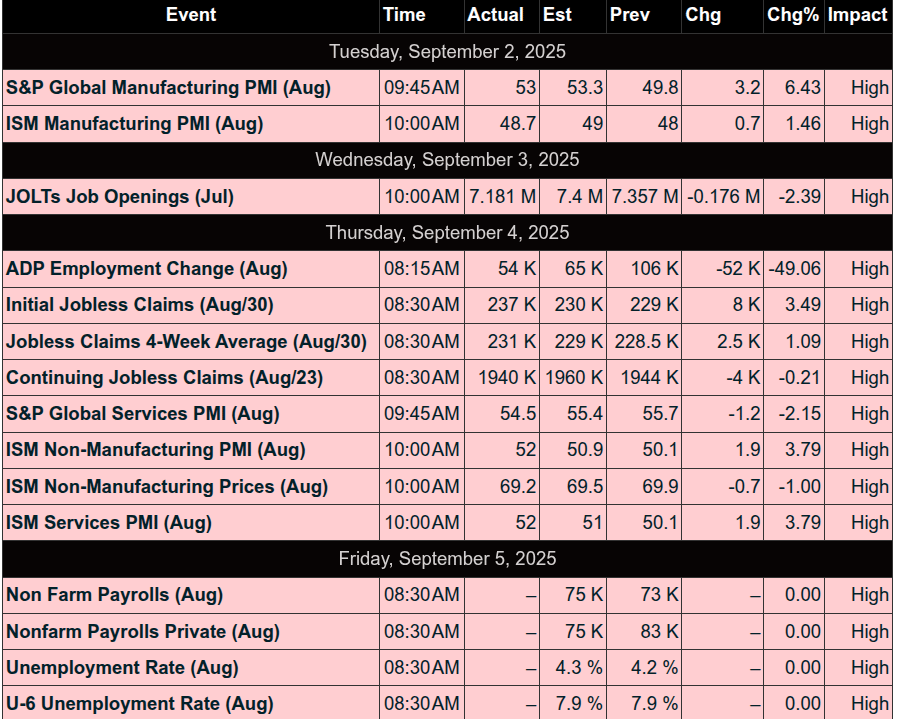
Economic Calendar Today
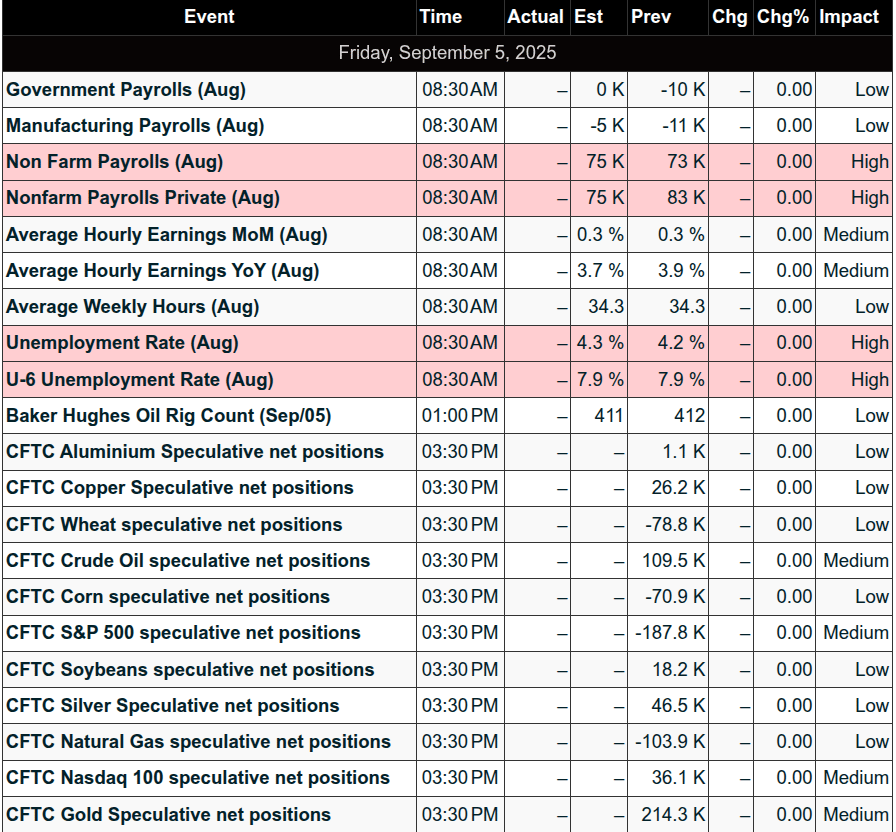
This Week’s High Importance
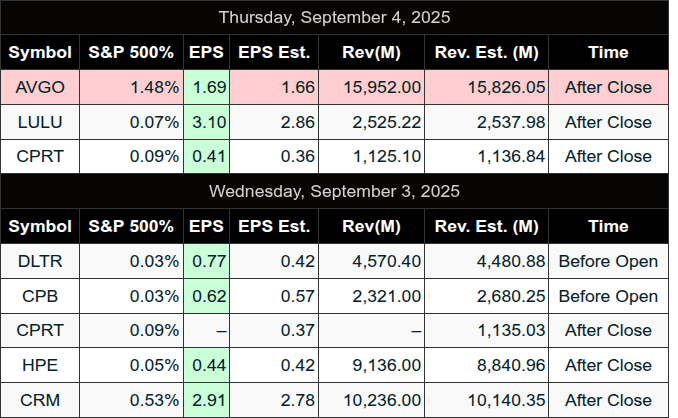
Earnings:

Trading Room News:
Polaris Trading Group Summary - Thursday, September 4, 2025
Yesterday was a textbook Cycle Day 2 continuation rally with solid execution from the PTG team, led by PTGDavid and heavily contributed to by Manny. The room navigated early chop and indecision, then capitalized on a high-probability continuation setup that ultimately hit all major upside targets into the close.
Market Context & Setup
Market opened with bullish structure; continuation long setup identified early
Manny's plan: buy pullbacks 6463–6465 while bid held above 6465, targeting 6476 → 6481 → 6492
Early morning chop tested trader patience, requiring discipline and plan adherence
Gamma levels and options flows (Vanna/Charm) signaled potential for range expansion but capped extremes
Morning Action
Initial long filled and paid +5 handles
Pullback stopped some traders out, but plan remained valid
Manny re-entered long after stopping out on short that still netted $500
Market eventually moved fast and cleanly to fulfill the first two targets of the plan
Traders emphasized patience and not forcing trades in choppy environments
Key Lessons Shared
Importance of having a written plan to avoid reacting emotionally during fast markets
Reminder that not every day requires profits—focus on surviving chop to thrive on trend days
Execution discipline matters: stop placement and letting trades work are critical
Combining old tools with new flow-based setups enhances edge
Mental discipline is as important as technical execution
Midday and Afternoon
Continuation rally confirmed Cycle Day 2 structure
Three-Day Cycle Target of 6495 and CD2 Range High of 6512.75 were fulfilled
$3B MOC Buy Imbalance added late-day fuel to the rally
SpotGamma combo level at 6511 tagged into the close
10-day ATR of ~65 points nearly realized from LOD to HOD
Trade Highlights
Manny executed the continuation long plan twice with strong results
Held partials into extended targets and trailed stops effectively
Roy and others worked on stop placement strategy and managing stacker entries
PTGDavid shared multiple RSPR examples and reinforced proper structure execution
End of Day Wrap
Massive squeeze into the close sparked discussion on whether participants “knew something” ahead of NFP
Final push hit all technical projections, including SpotGamma and cycle levels
Traders discussed potential scenarios for Friday: gap and go, or reversal
Summary
Strong trend day with clear structure and execution opportunities
Patience, planning, and discipline paid off
Room demonstrated high-level collaboration and focus on continuous improvement
DTG Room Preview – Friday, September 5, 2025
Markets are sharply focused on this morning’s August jobs report (8:30am ET), with traders looking for confirmation of labor market weakness. Several data points already point in that direction:
ADP private payrolls grew by only 54K in August (vs. 65K expected).
Jobless claims rose to their highest level since June.
ISM services employment contracted for a third straight month.
This soft labor data is boosting expectations for a Fed rate cut in September, helping push US equity indices near all-time highs.
Fed & Politics:
Stephen Miran, Trump’s Fed nominee, faced tough Senate questions over potential conflicts of interest.
A DOJ probe into Fed Governor Lisa Cook over mortgage fraud is underway; Cook claims political retaliation.
FTC Commissioner Slaughter was reinstated after Trump’s firing attempt; the case could reshape executive power over regulators.
Trade & Macro:
Trump signed a Japan trade deal locking in a 15% tariff on most imports.
The US trade deficit widened in July by 5.9%, likely due to tariff front-loading.
Markets:
No key earnings on deck today.
Volatility is steady (ES 5-day ADR back up to 67 points).
Whale flow is short into the jobs report.
ES pressing new ATHs, remains within short/intermediate-term uptrend channels.
Key ES Levels:
Resistance: 6701/06, 6730/35
Support: 6395/00, 6375/80, 5853/58

Affiliate Disclosure: This newsletter may contain affiliate links, which means we may earn a commission if you click through and make a purchase. This comes at no additional cost to you and helps us continue providing valuable content. We only recommend products or services we genuinely believe in. Thank you for your support!
Disclaimer: Charts and analysis are for discussion and education purposes only. I am not a financial advisor, do not give financial advice and am not recommending the buying or selling of any security.
Remember: Not all setups will trigger. Not all setups will be profitable. Not all setups should be taken. These are simply the setups that I have put together for years on my own and what I watch as part of my own “game plan” coming into each day. Good luck!!
Follow @MrTopStep on Twitter and please share if you find our work valuable!