- The Opening Print
- Posts
- Bulls In Control With 8 Straight Weekly Gains
Bulls In Control With 8 Straight Weekly Gains
Danny Riley
December 26, 2023
Follow @MrTopStep on Twitter and please share if you find our work valuable.
Today is not Fry-Day, but it’s the day after the holidays, so it’s a free-read for everyone. If you’d like to consider upgrading to our premium membership, do so with a free 7-day trial.
Our View
Many of you know my old saying: If you want to know where the S&P is going, all you have to do is follow the money!
I understand this is not always how it works, but it sure has over the last 3 months. After the bonds made their low at 107.04 on October 23, it seemed like the bond rally only added to the stock buying, especially in the tech-heavy Nasdaq.
Aside from the standard beginning and end-of-the-day buying we have seen for the last 9 weeks, there are also multi-trillion dollar options expirations and piles of cash that have been sitting on the sideline (literally in the trillions).
Warren Buffett’s cash and equivalents have swelled to a record amount, totally more than $150 billion.
According to Fundstrat, the stock market is poised to benefit from this cash being put to work in 2024. With this much money floating around, it should mean most selloffs should be short-lived and that buying minor pullbacks over the next few months should be bought according to FundStrat’s Mark Newton.
Newton says the growing pile of cash in money market funds should serve as a strong backstop for the stock market in 2024.
"While several prominent sentiment polls have turned more optimistic in the last few weeks, this gauge should be a source of comfort to market bulls, meaning that minor pullbacks in the weeks/months to come likely should be buyable given the global liquidity backdrop coupled with ample cash on the sidelines," Newton said.
He later added, "Funds might begin to deploy cash in the new calendar year once rebalancing takes place, which might help to fuel the market rally even more."
That would be especially true if the Federal Reserve begins to cut interest rates next year, which the market expects to happen at least five times. If the Fed cuts, the risk-free interest rate on money market funds will fall in tandem, making holding cash a less appealing alternative to putting the money in the stock market.
Ultimately, the growing cash pile suggests that optimism towards stocks isn't as frothy as it might seem, according to Newton, even as the Dow Jones Industrial Average and Nasdaq 100 hit record highs.
Our Lean
I have a friend who has been trading very well, but has stayed out over the last 10 days. He was bullish two months ago, but is now saying he thinks the S&P goes down at the end of the year.
I don't know about that — unless there is an event. Instead, I think you buy any 20 to 50-point pullbacks.
So far December's low volume has clearly favored the upside and with the way the holidays fell this year, I don’t think anyone is hurrying back to get in front of the screens. The last trading day of the year is Friday the 29th, which has the Nasdaq up 16 of the last 22 occasions and was up 29 years in a row, from 1971 to 1999.
Next Monday the exchanges are closed and Dec 2nd — the first trading day of January — has the Nasdaq up 18 of the last 26. The second trading day of January (or Wednesday Jan 3) has the Dow up 21 of the last 30 occasions.
Bottom line/Our Lean: I can’t rule out a pullback, but I think you keep buying the pullbacks right into the beginning of the new year.
For those of you who like HandelStats levels, here they are:
Upside: Trade and hourly close above 4811.25 targets 1 sd at 4827.66. hourly close above there targets 4841.24, hourly close above there targets 2 sd at 4855.07, then weekly 1 sd level at 4861.55. Hourly close above there targets 3 sd at 4882.49.
Downside: Hourly trade below 4811.25 targets settlement 4800.25, then 4795.54. Hourly close below 4794.62 targets 4790. Hourly close below there targets 4777.62, then 4774.25, then -1 sd at 4772.84. Hourly close below there targets 4765, 4763.25, hourly close below there targets -2 sd at 4745.43.
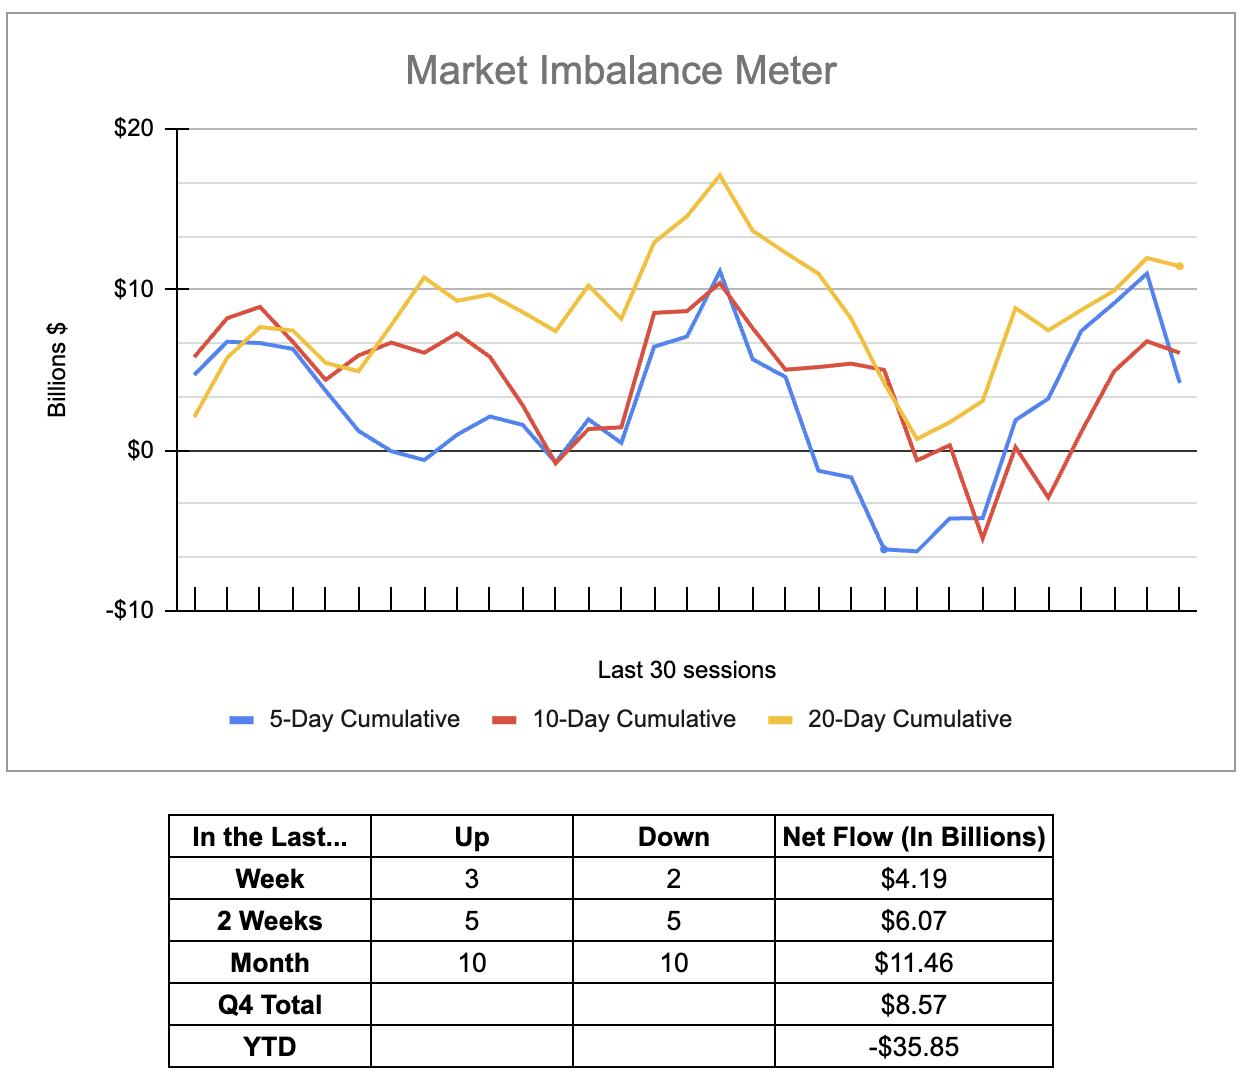
MiM and Daily Recap
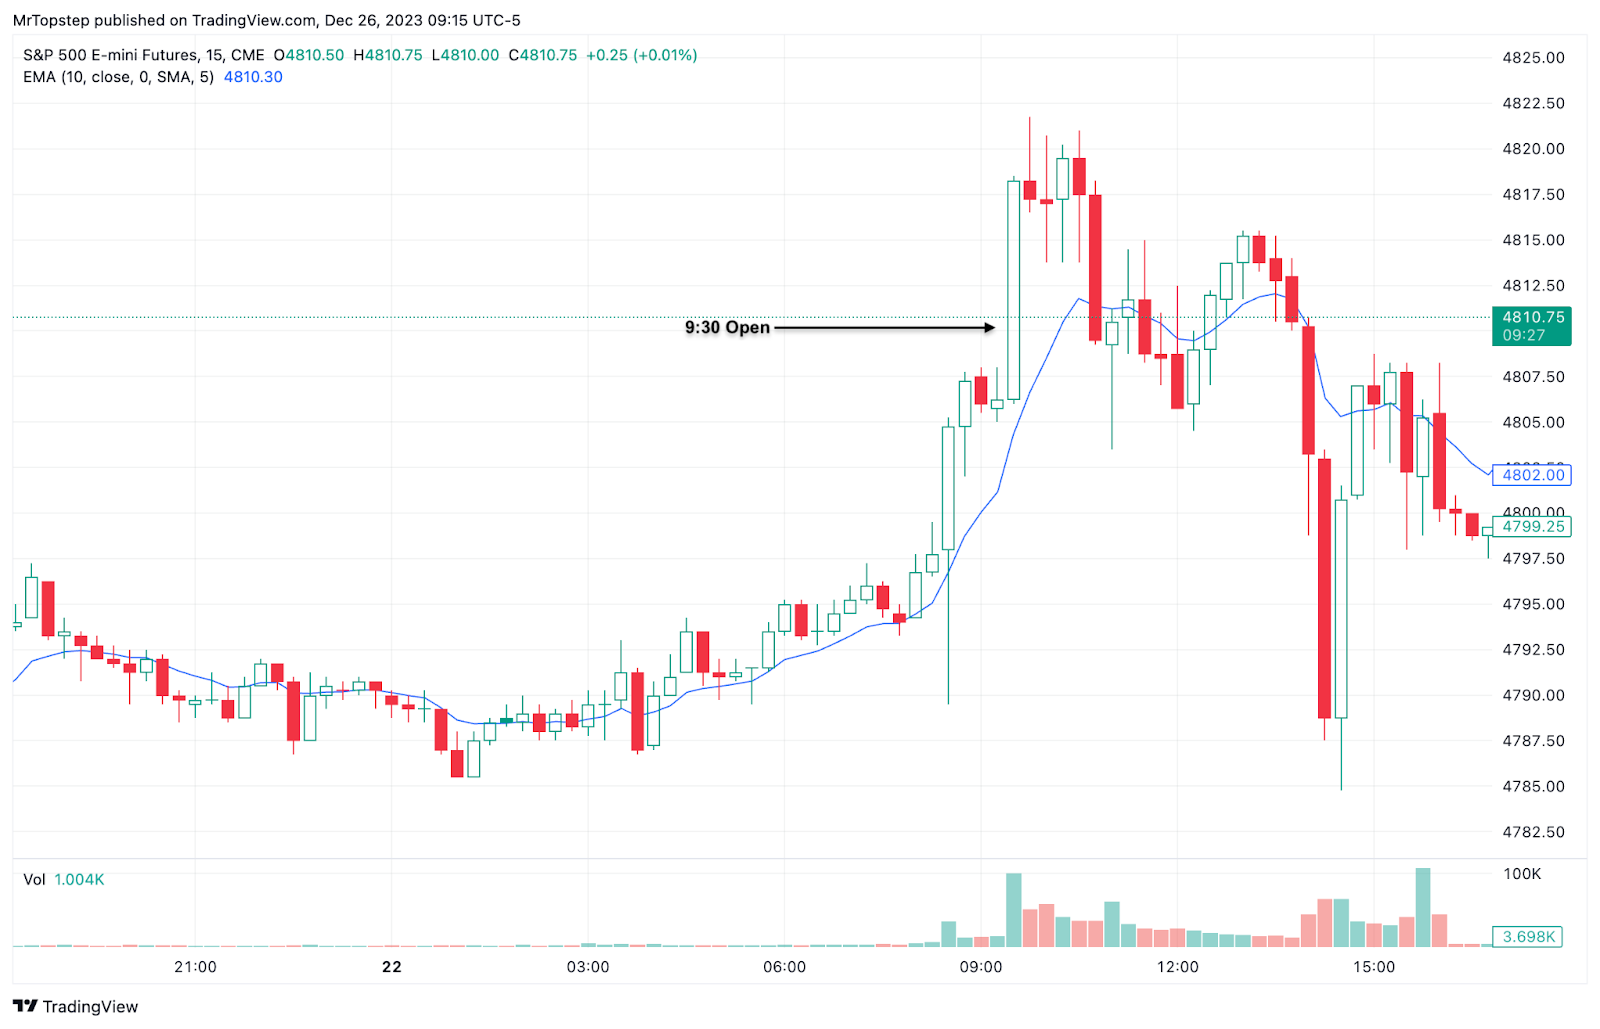
ES recap
The ES traded up to 4808.00 on Globex and opened Friday's regular session at 4805.50. After the open, the ES rallied up to 4821.75, slowly pulled back to the 4814 area, dropped down to 4803.50 at 11:00, and then traded up to another lower high at 4815.50 at 1:40. After that, a sell program hit that pushed the ES down to the 4784.00 at 2:14 and then rallied back up to the 4808.75 level at 3:01 and then dropped down to 4798.00 at 3:41 as the early NYSE imbalance showed $128 million to buy.
The ES traded 4799.50 as the final 3:50 cash imbalance showed $909 million to sell, traded 4806.50 on the 4:00 cash close and settled at 4899.25 on the 5:00 futures close, up 3.5 points or 0.07% on the day.
In the end, liquidity dropped significantly. In terms of the ES's overall tone, it was firm but sloppy. In terms of the ES's overall tone, it was firm. In terms of the ES's overall trade volume was on the lite side, 229k traded on Globex and 1.06 million traded on the day session for a total of 1235 million contracts traded.
Technical Edge
NYSE Breadth: 64% Upside Volume
Nasdaq Breadth: 66% Upside Volume
Advance/Decline: 67% Advance
VIX: ~13.75
ES
Levels from HandelStats.com
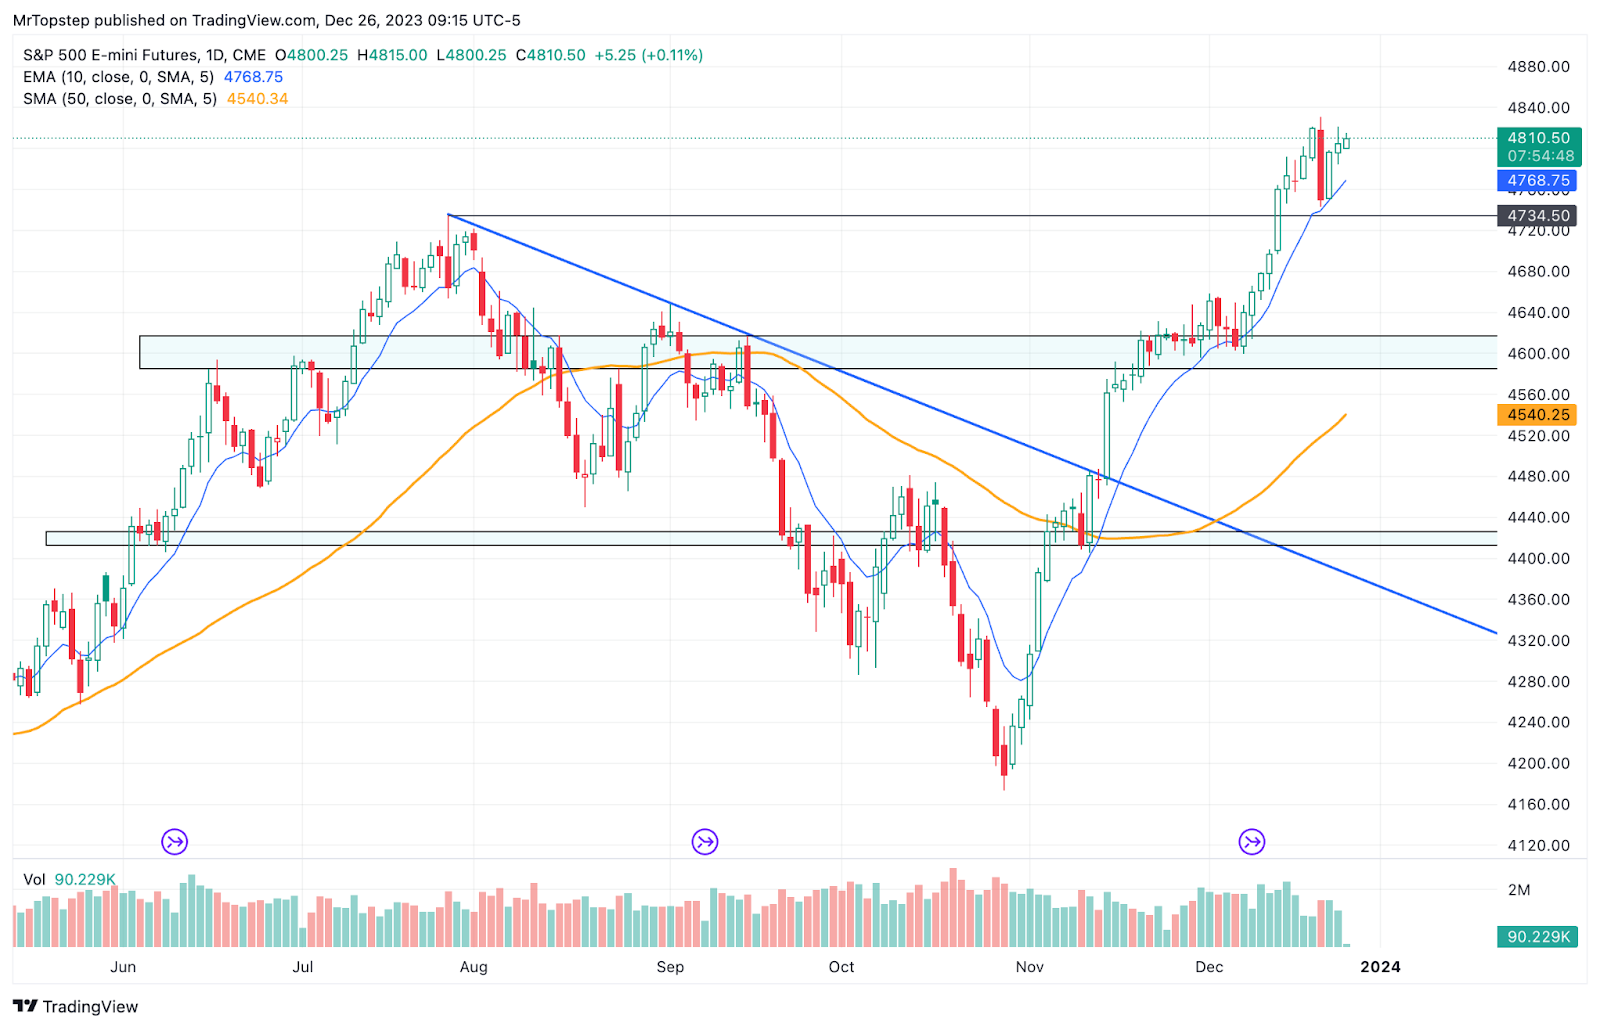
ES daily
Upside: Trade and hourly close above 4811.25 targets 1 sd at 4827.66. hourly close above there targets 4841.24, hourly close above there targets 2 sd at 4855.07, then weekly 1 sd level at 4861.55. Hourly close above there targets 3 sd at 4882.49.
Downside: Hourly trade below 4811.25 targets settlement 4800.25, then 4795.54. Hourly close below 4794.62 targets 4790. Hourly close below there targets 4777.62, then 4774.25, then -1 sd at 4772.84. Hourly close below there targets 4765, 4763.25, hourly close below there targets -2 sd at 4745.43.
NQ
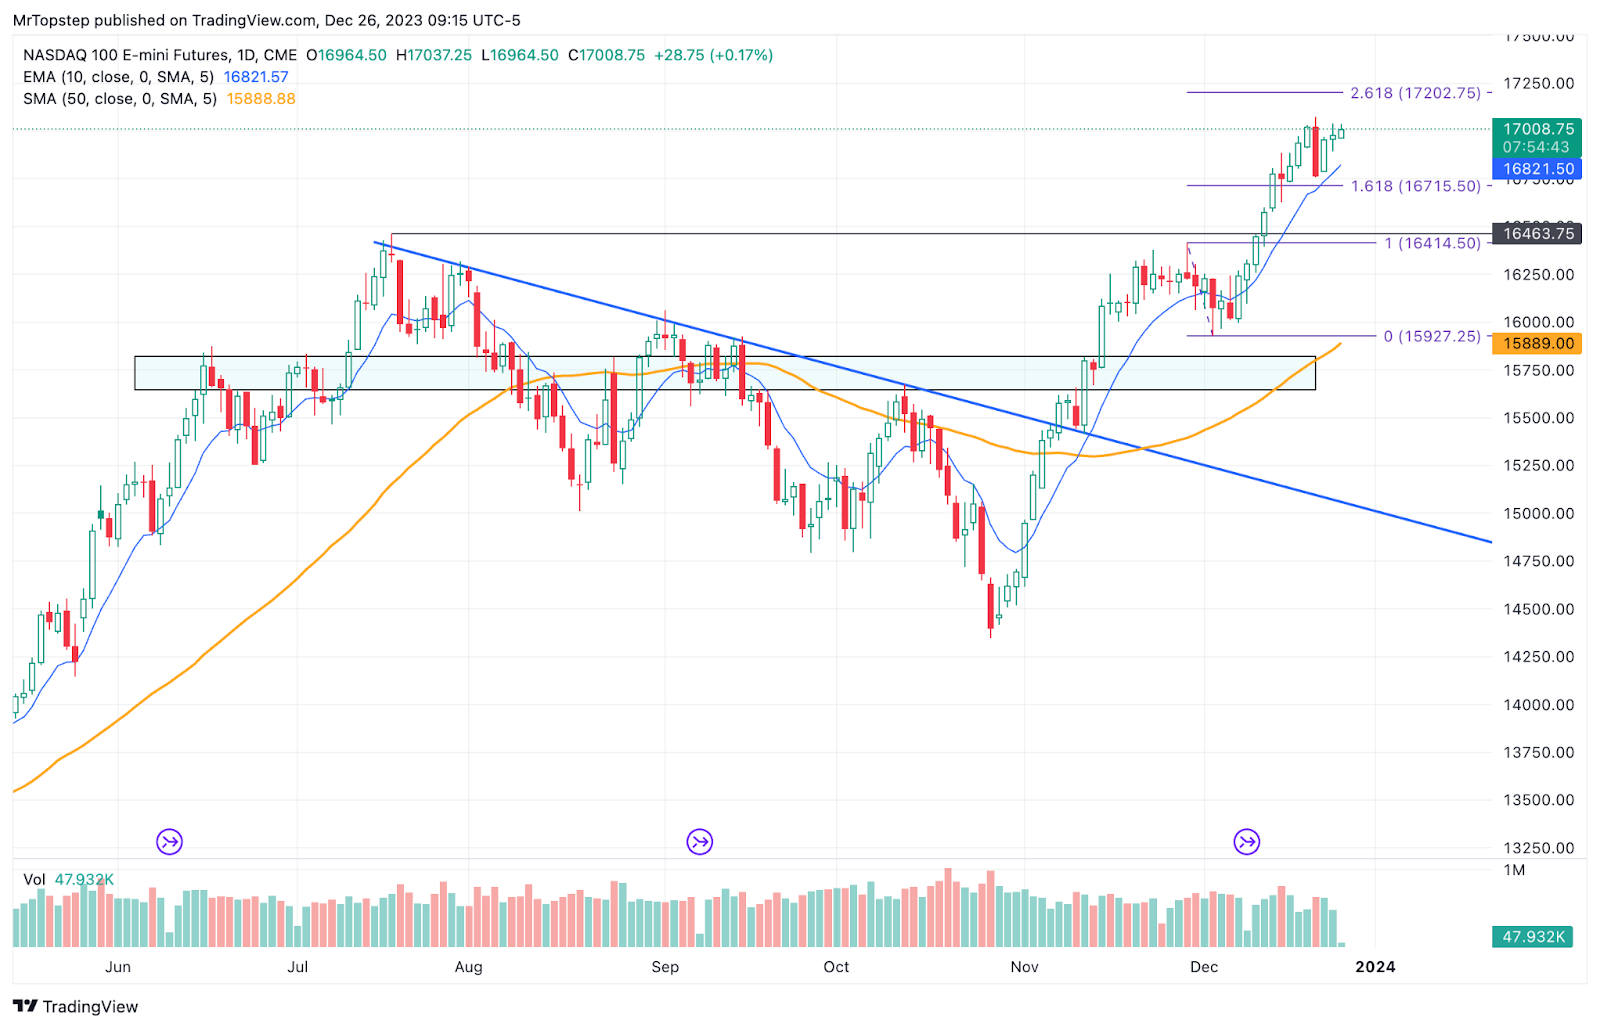
NQ Daily
Upside: trade and hourly close above 17021.75 targets 17040.75. Trade and hourly close above 17040.75 targets 1 sd at 17118.14, hourly close above there targets 2 sd at 17267.54. Trade and hourly close above there targets weekly 1 sd at 17302.80 and 17304.75, hourly close above there targets 3 sd at 17416.93.
Downside: hourly close below 17021.75 targets settlement 16968.75, then 16946.25. Hourly close below there targets 16913, then 16901.75, then 16883 and 16875.50. Hourly close below there targets 16838.25, then -1 sd at 16819.36. Hourly close below there targets 16803.25, hourly close below there targets 16740.50. Hourly close below there targets 16682, then -2 sd at 16669.96, then -1sd weekly at 16634.70, then 16608.35*****
*****Must maintain this level on a weekly close. Hourly close below 16607 targets 16537.62 then -3 sd at 16520.57.
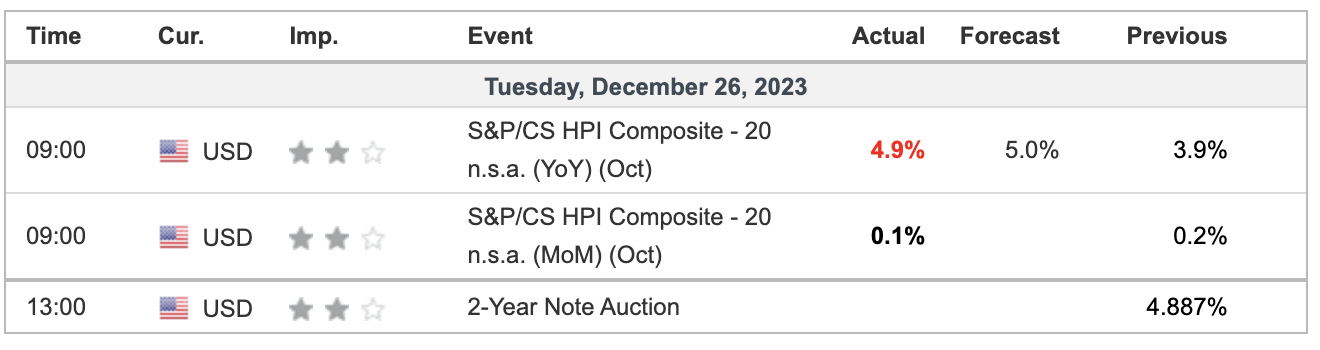
Economic Calendar